Earliest detection of the optical afterglow of GRB 030329 and its variability
Abstract
We report the earliest detection of an extremely bright optical afterglow of the gamma-ray burst (GRB) 030329 using a 30cm-telescope at Tokyo Institute of Technology (Tokyo, JAPAN). Our observation started 67 minutes after the burst, and continued for succeeding two nights until the afterglow faded below the sensitivity limit of the telescope (approximately 18 mag). Combining our data with those reported in GCN Circulars, we find that the early afterglow light curve of the first half day is described by a broken power-law ( ) function with indices (0.047 days), ( days), and ( 1.2 days), where days and days, respectively. The change of the power-law index at the first break at days is consistent with that expected from a “cooling-break” when the cooling frequency crossed the optical band. If the interpretation is correct, the decay index before the cooling-break implies a uniform ISM environment.
1 Introduction
The overall behavior of GRB afterglows has been successfully explained by the standard fireball model (e.g. Piran et al. 1999). It is expected that the deviation from a simple power-law in the afterglow light curve will provide wealth of information on the environment and physical parameters of GRBs. For example, observations of early GRB afterglows confirmed that “breaks” exist in the light curves of a number of GRBs. Such breaks may be understood in the framework of the standard fireball model either as a “jet-break” where the bulk Lorentz factor of the relativistic jet decrease to the inverse of jet opening angle (Sari, Piran Halpern 1999, Rhoads 1999), or the “cooling-break” where the high energy electrons start to lose most of their energy rapidly by synchrotron emission which emit the observed optical photons (Sari, Piran Nakar 1998). While there are number of convincing cases for jet-breaks, identification of a cooling-break in the optical light curve has been difficult since it requires detection of a subtle change in the power-law index (). In order to study afterglow light curves in detail, continuous coverage and a high signal-to-noise ratio are required.
The situation has been dramatically improved since the advent of High Energy Transient Explorer-2 (HETE-2). HETE-2 can determine the positions of GRBs onboard, and notify ground-based observers of the GRB coordinates within 110 minutes after the burst (Ricker et al. 2002). For example, the locations of GRB 021004 (e.g., Fox 2002) and GRB 021211 (e.g., Fox Price 2002) were disseminated within less than a minute after the bursts, which prompted detailed studies of GRB afterglows in the very initial phases while they are bright.
GRB 030329 was detected by the HETE-2 satellite on 29 March 2003 at 11:37:14.7 UT. Position was determined by the ground analysis, and the location was reported to GCN at 73 minutes after the burst (Vanderspek et al. 2003). A very bright( mag) optical transient (OT) was reported at , (Peterson Price 2003, Torii 2003) inside the SXC error circle. This is the brightest GRB ever detected by HETE-2 with the 30400 keV fluence of erg cm-2, and precise and continuous follow-up observations were carried out by dozens of telescopes distributed around the world. Optical spectroscopic observations have determined its redshift as = 0.1685 (Greiner et al. 2003), which is one of the closest ever known and is possibly related to the exceptional brightness of this afterglow. Moreover, spectra taken after several days reveal the evolution of broad peaks in the spectra characteristic of a supernova. The spectral similarity to SN 1998bw (e.g., Galama et al. 1998, Iwamoto et al. 1998) and other energetic supernovae such as 1997ef provides strong evidence that GRB 030329 is associated with core-collapse supernovae (Dado, Dar Rujula 2003, Hjorth et al. 2003, Stanek et al. 2003, Kawabata et al. 2003). In order to investigate the kinetic energy of GRB and the immediate vicinity of its progenitor, the early light curve is important. In this letter, we report the earliest detection of the optical afterglow of GRB 030329 starting 67 minutes after the burst.
2 Observation and photometry
Our observation was performed at Tokyo Institute of Technology using a 30cm-telescope (Meade LX-200) and an unfiltered CCD camera (Apogee AP6E) equipped with a front-illuminated 10241024 CCD chip (Kodak KAF-1001E). The dark current images were subtracted from the obtained CCD images and then flat fielding was applied for all images. We used IRAF/noao/digiphot/apphot/phot packages to analyze the data.
We started observing the preliminary SXC position at 12:44:13 UT on 29 March 2003, 67 minutes (0.047 days) after the burst 111As a HETE-2 Ops graduate student R. Sato took the initiative and “ran up to the roof to start observing” while the location data were still preliminary.. The magnitude of GRB afterglow at the very beginning was mag. This is the earliest detection of the afterglow of GRB 030329 ever reported in literature.
We continued observations for the rest of the night covering days, and performed observations on the following two nights covering the period of days and days, respectively, where refers to the time since the burst onset. The exposure time of each CCD frame was 10 sec ( days; when the after glow was relatively bright) or 30 sec (2.03 days). The magnitude of the comparison stars were calibrated using three stars in the same field of view, which has been calibrated in detail by Henden. Then we determined the magnitude of the OT in each frame relative to the weighted average of 15 bright comparison stars.
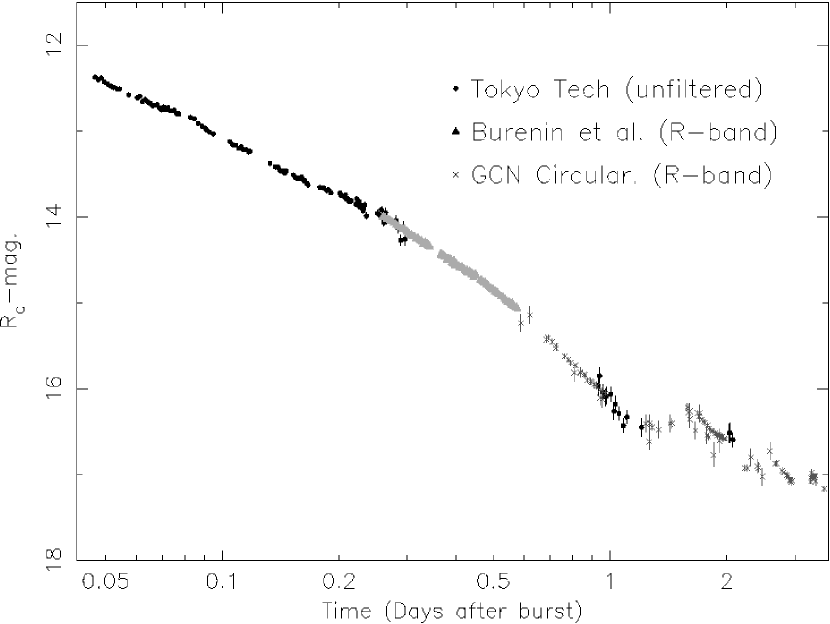
Since the peak sensitivity of our camera is very close to the band, we have calibrated magnitude of the OT by converting our magnitude system () into the system assuming the color correction with the color = 0.74 mag (Zeh et al. 2003) (, where a(r) is the zero-point between the instrumental system and the standard magnitude). The statistical error is mag. Although the zero-point errors were found to be 0.03 mag for the reference stars by Henden (2003), we found our data were consistently brighter than the -band filtered observations (e.g., Burenin et al. 2003). We therefore introduced additional zero-point correction (+0.11 mag) to match the light curves in the overlapped interval. The resulting light curve of the GRB 030329 afterglow in the band is shown by combining data from other observations (see Fig 1).
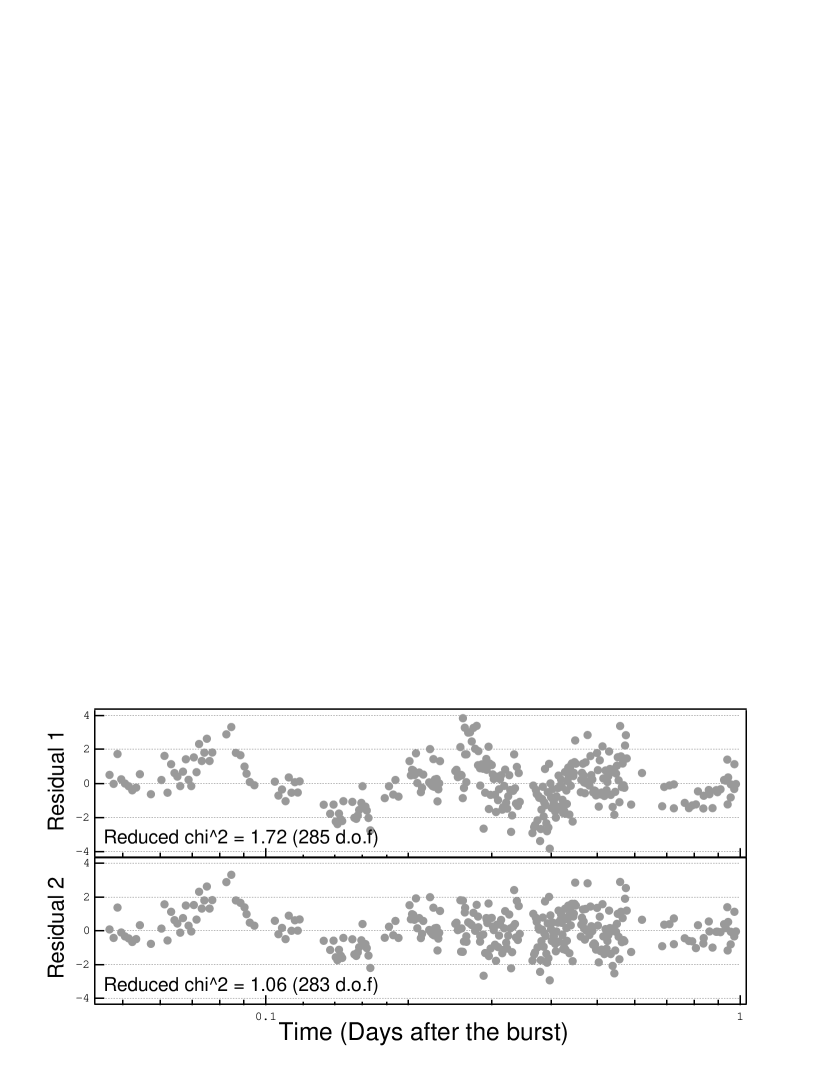
The light curve in the first day cannot be fitted with a single power-law function. We therefore tried to fit the light curve by two different forms of broken power-law functions. One is given by Beuermann et al.: , where is the break time, and provides a measure of the relative width and the smoothness of the break. The other is a “double-broken power-law” function with two breaks with the following form:
| (1) |
where and are the break times and provides a measure of the relative width and the smoothness of the break. Here we excluded the “bump” at days, which is discussed in section 3.3.
We found that the former is not acceptable with a reduced of 1.72 (285 d.o.f) whereas the latter improves the fit significantly (the reduced 1.06 with 283 d.o.f) (see Fig 2).
As a result, it is well described by a broken power-law of the form; ( days), ( days), ( days), where days and days, respectively, and . Here, is determined by essentially the full Tokyo Tech data. The earliest phase of the light curve is well fitted by the single power-law with its index . and are determined by measurements reported by Burenin et al. and GCN (see caption in Fig 1).
3 Discussion
3.1 Light curve at days
We have presented a light curve of the early phase of the optical afterglow of GRB 030329 starting 67 minutes after the burst. This is the earliest detection of GRB 030329 ever reported (Peterson Price 2003, Torii et al. 2003, Uemura et al. 2003).
Burenin et al. (2003) reported follow-up observations of GRB 030329 as early as 6 hours after the burst, using BVRI filters. In each of the filters, they observed a gradual flux decay which can be accurately described as a power-law . They also found a characteristic break in the light curve 0.57 day, after which the afterglow flux started to decline faster. The power-law slopes of the light curves changed from 1.19 to 1.9 for . Notably, this break is nicely consistent with our second break () within error bars, where the power-law slopes changes from to after the break of days (see above). The first break () is not discussed in Burenin et al, since they started their observations just around this break ( days).
Price et al. (2003), Burenin et al. (2003), and Tiengo et al. (2003) found that the results of their observations are consistent with the model where the afterglow emission is generated during the deceleration of the ultra-relativistic collimated jet. They found that the break in the power-law light curve, at days, can be interpreted as the jet-break, i.e., the break which occurs when the angular structure of the ultra-relativistic collimated jet becomes observable (Sari, Piran Halpern 1999, Rhoads 1999). This interpretation is supported by the fact that the break occurred simultaneously in different colors. Furthermore, a change in power-law slope from 1.19 to 1.9, is approximately consistent with that generally observed in jet-break. Therefore, our major concern in this paper is to understand the nature of the first break, , and examine the consistency between the above scenario in the frame work of standard GRB fireball theories (Piran et al. 1999).
3.2 Break at days
There are two possible break frequencies in the spectra, and , where is the synchrotron frequency, is the cooling frequency above which electrons lose their energy rapidly by synchrotron radiation (Sari, Piran Narayan 1998). Since and are the functions of time, a break in the light curve could be observed when and/or crossed over the observed frequency . Therefore, we examined six possible cases to understand the first break (), according to the relation between , and . In the standard GRB scenario, is often called “fast cooling” since all electrons cool rapidly, whereas is referred to “slow cooling” since only the high energy population of electrons cool efficiently. We will also extend our discussion to discriminate between “a homogeneous interstellar medium (ISM) model” (e.g., Sari Piran 1999) and “a pre-existing stellar wind model” (e.g., Chevalier Li 1999) for the GRB environment. The relationships between observed spectral index and model predictions are compared in Table 1.
We first consider the case where both and are above the observed optical frequencies ( or : case (3) and (6) in Table 1). In these two situations, observed flux at should increase with time, which strongly conflicts with the observed declining light curve. On the contrary, if the both cooling frequency and the minimum frequency are below the optical band ( or : case (1) and (4) in Table 1), the predicted optical spectral index would be , where is the electron spectral index. Since the photon spectral index of this afterglow was at days (Burenin et al. 2003), we expect , which is unusually flat for an electron population accelerated in a GRB. Furthermore, power-law index in the light curve should be , which is again inconsistent with obtained with our data.
Case (5) in Table 1 is also ruled out since the predicted power-law index (Sari, Piran Narayan, 1998) is too flat compared to the observed value of . Therefore, we argue that the possible solution is for the time region of . In this case, however, if the burst occurred in pre-existing stellar wind, the optical decay slope is predicted to be , with for a wind model (Panaitescu, Meszaros Rees 1998), which is quite steeper than that observed, and hence we can rule out wind-interaction model. In summary, and ISM model (case (2) in Table 1) is the only possible solution to reproduce both the temporal/spectral index of the optical afterglow of GRB 030329 at days.
In such a slow cooling case, time variation of afterglow flux is given by for and for , respectively (Sari, Piran Narayan 1998). By assuming = 0.88, the electron spectral index is estimated as . Note that, this electron spectral index agrees well with those of electrons accelerated in relativistic shock waves (e.g., Dado, Dar Rujula 2003). Furthermore, we expect that power-law slope of the light curve would change from 0.88 to 1.13 for . Again, this is approximately consistent with the observed spectral index after , where . Therefore, we conclude that the first break in the optical afterglow light curve at is the most probably cooling-break where the cooling frequency crosses down the observed optical frequency.
Under this assumption, we can determine important physical parameters for the GRB emission. For example, we can estimate and , where and are the fractions of the shock energy given to magnetic field and electrons at the shock (Sari, Piran Narayan 1998). In case of slow cooling, would be expected. Since we started our observation 0.047 days after the burst, we can limit the range of as days. For days, days, erg, cm-3, Hz, we obtain
| (2) |
| (3) |
We can also constrain the peak time of reverse shock days after the burst (Sari Piran 1999).
| (4) |
The Lorentz factor depends on time, (Piran 1999). And the magnetic field is calculated using and the Lorentz factor by . Assuming erg, the Lorentz factor and the magnetic field strength at two characteristic breaks time are gauss at days and gauss at days, respectively.
The values of and estimated in the preceding chapter are in good agreement with the averages of these parameters for GRBs calculated by Panaitescu Kumar (2001), which are and .
3.3 Bump at days
Finally, we comment on a small “bump” of the light curves at days () with an amplitude of mag. Uemura et al. (2003) reported a change of slopes from 0.74 to 0.95 days at days. However our earliest data at days has a slope steeper than 0.74. The light curve at days lies on the extrapolation of this earliest segment. We consider this feature as a bump rather than a break.
Short time variabilities, i.e., “bumps and wiggles”, may be associated with the forward/reverse shock structures along the afterglow emitting regions (Kobayashi Zhang 2003), repeated energy injection from the central engine, or fluctuation in the density of the interstellar medium (Nakar, Piran Granot 2003).
First, we can rule out a case with the forward/reverse shock structure, since it predicts the light curve should not have the same power-law index before and after the bump. A case with repeated energy injection is also ruled out since after the injection the light curve after the bump should have the same power-law decay slope, but with a larger normalization. Therefore, we conclude that the bumps in the light curve is likely due to the fluctuation in the external density of the interstellar medium (Nakar, Piran Granot 2003).
We can estimate the distance from the central engine (Piran 1999) and the density variation (Nakar, Piran Granot 2003) at .
| (5) |
| (6) |
We find that density is enhanced about 10 at the distance of cm.
4 Summary
We observed extremely bright optical afterglow of GRB 030329 from 67 minutes after the burst. Our observational results show that the shocked electrons are in the slow cooling regime with an electron index of 2.17 in this burst, and that the burst occurred in a uniform ISM, that is, GRB 030329 can be understood very well in the predicted “standard” model. We conclude the first break changes the power law index by , consistent with the cooling-break in the frame work of the standard external shock model.
References
- Akerlof & McKay (1999) Akerlof, C. W. & McKay, T. A. 1999, GRB Circ. 205
- Beuermann et al. (1999) Beuermann, K. et al. 1999, A&A, 352, L26
- Burenin et al. (2003) Burenin, R. A. et al. 2003, Astronomy Letters, 29, 573
- Cantiello et al. (2003) Cantiello, M. et al. 2003, GRB Circ. 2074
- Chevalier & Li (1999) Chevalier, R. A. & Li, Z. 1999, ApJ, 520, L29
- Dado, Dar, & De Rújula (2003) Dado, S., Dar, A., & De Rújula, A. 2003, ApJ, 594, L89
- Fitzgerald & Orosz (2003) Fitzgerald, J. B. & Orosz, J. A. 2003, GRB Circ. 2056 & 2070
- Fox (2002) Fox, D. W. 2002, GRB Circ. 1564
- Fox & Price (2002) Fox, D. W. & Price, P. A. 2002, GRB Circ. 1731
- Galama et al. (1998) Galama, T. J. et al. 1998, Nature, 395, 670
- Granot (2003) Granot, J., Nakar, E., Piran, T., 2003, astro-ph/0304563
- Greiner et al. (2003) Greiner, J. et al. 2003, GRB Circ. 2020
- Henden (2003) Henden, A. 2003, GRB Circ. 2023
- Hjorth et al. (2003) Hjorth, J. et al. 2003, Nature, 423, 847
- Ibrahimov et al. (2003) Ibrahimov, M. A. et al. 2003, GRB Circ. 2077
- Iwamoto et al. (1998) Iwamoto, K. et al. 1998, Nature, 395, 672
- Kawabata et al. (2003) Kawabata, K. S. et al. 2003, ApJ, 593, L19
- Klose, Hoegner, & Greiner (2003) Klose, S., Hoegner, C., & Greiner, J. 2003, GRB Circ. 2029
- Kobayashi & Zhang (2003) Kobayashi, S. & Zhang, B. 2003, ApJ, 582, L75
- Li, Chornock, Jha, & Filippenko (2003) Li, W., Chornock, R., Jha, S., & Filippenko, A. V. 2003, GRB Circ. 2064
- Lipkin, Ofek, & Gal-Yam (2003) Lipkin, Y., Ofek, E. O., & Gal-Yam, A. 2003, GRB Circ. 2034
- Meegan et al. (1992) Meegan, C. A. et al. 1992, Nature, 355, 143
- Nakar, Piran, & Granot (2003) Nakar, E., Piran, T., & Granot, J. 2003, New Astronomy, 8, 495
- Panaitescu, Meszaros, & Rees (1998) Panaitescu, A., Meszaros, P., & Rees, M. J. 1998, ApJ, 503, 314
- Panaitescu & Kumar (2001) Panaitescu, A. & Kumar, P. 2001, ApJ, 560, L49
- Pavlenko et al. (2003) Pavlenko, E. et al. 2003, GRB Circ. 2050 & 2067
- Peterson & Price (2003) Peterson, B. A. & Price, P. A. 2003, GRB Circ. 1985
- Piran (1999) Piran, T. 1999, Phys. Rep., 314, 575
- Price (2003) Price, A. 2003, GRB Circ. 2058
- Price et al. (2003) Price, P. A. et al. 2003, Nature, 423, 844
- Price & Mattei (2003) Price, A. & Mattei, J. 2003, GRB Circ. 2071
- Rhoads (1999) Rhoads, J. E. 1999, ApJ, 525, 737
- Ricker, Vanderspek, & HETE Science Team (2002) Ricker, G. R., Vanderspek, R. K., & HETE Science Team, 2002, American Astronomical Society Meeting, 201,
- Rumyantsev, Pavlenko, Antoniuk, & Pozanenko (2003) Rumyantsev, V. et al. 2003, GRB Circ. 2028
- Sari, Piran, & Narayan (1998) Sari, R., Piran, T., & Narayan, R. 1998, ApJ, 497, L17
- Sari, Piran, & Halpern (1999) Sari, R., Piran, T., & Halpern, J. P. 1999, ApJ, 519, L17
- Sari & Piran (1999) Sari, R. & Piran, T. 1999, ApJ, 520, 641
- Stanek, Martini, & Garnavich (2003) Stanek, K. Z., Martini, P., & Garnavich, P. 2003, GRB Circ. 2041
- Stanek et al. (2003) Stanek, K. Z. et al. 2003, ApJ, 591, L17
- Tiengo et al. (2003) Tiengo, A. et al. 2003, A&A, 409, 983
- Torii (2003) Torii, K. 2003, GRB Circ. 1986
- Uemura et al. (2003) Uemura, M. et al. 2003, Nature, 423, 843
- Vanderspek et al. (2003) Vanderspek, R. et al. 2003, GRB Circ. 1997
| Model | Environment | Comment | |
|---|---|---|---|
| (1) | ISM | 0.49 | and are inconsistent |
| Wind | 0.49 | and are inconsistent | |
| (2) | ISM | 0.99 | O.K. |
| Wind | 1.49 | does not fit data | |
| (3) | ISM | - | |
| Wind | - | ||
| (4) | ISM | 0.49 | and are inconsistent |
| Wind | 0.49 | and are inconsistent | |
| (5) | ISM | 0.25 | does not fit data |
| Wind | 0.25 | does not fit data | |
| (6) | ISM | - | |
| Wind | - |