Properties of Dark Matter Halos in Disk Galaxies
Abstract
We present a simple technique to estimate mass-to-light () ratios of stellar populations based on two broadband photometry measurements, i.e. a color- relation. We apply the color- relation to galaxy rotation curves, using a large set of galaxies that span a great range in Hubble type, luminosity and scale size and that have accurately measured HI and/or H rotation curves. Using the color- relation, we construct stellar mass models of the galaxies and derive the dark matter contribution to the rotation curves.
We compare our dark matter rotation curves with adiabatically contracted Navarro, Frenk, & White (1997, NFW hereafter) dark matter halos. We find that before adiabatic contraction most high surface brightness galaxies and some low surface brightness galaxies are well fit by a NFW dark matter profile. However, after adiabatic contraction, most galaxies are poorly fit in the central few kpc. The observed angular momentum distribution in the baryonic component is poorly matched by CDM model predictions, indicating that the angular momentum distribution is not conserved during the galaxy assembly process. We find that in most galaxies the dark matter distribution can be derived by scaling up the HI gas contribution. However, we find no consistent value for the scaling factor among all the galaxies.
STScI, 3700 San Martin Dr., Baltimore, MD 21218, U.S.A.
Department of Astronomy, Ohio State University, 140 West 18th Avenue, Columbus, OH 43210-1173, U.S.A.
MPIA, Königstuhl 17, D-69117 Heidelberg, Germany
Department of Physics and Astronomy, University of British Columbia, 6224 Agricultural Road, Vancouver, BC V6T 1Z1, Canada
For a considerable time galaxy rotation curves have been providing some of the strongest evidence for Dark Matter (DM) in the Universe (e.g., Freeman 1970; Rubin 1978; Bosma 1981). A long standing problem has been the derivation of the DM mass distribution from the observed rotation curves. Interestingly, this problem is not due to the unknown nature of the DM component, but is mainly due to the unknown mass scaling of the observed stellar component. This has often been solved by using the maximum disk solution, i.e. assuming the ratio of the stellar component does not change with radius and scaling it up by the maximum amount allowed by the rotation curve (e.g., van Albada et al. 1985). While this is perfectly legitimate to prove the presence of DM, once we accept the existence of DM, there is little reason to believe that all disks are close to maximum (Courteau & Rix 1999; but see Sancisi, these proceedings). Especially in light of currently popular galaxy formation scenarios based on Cold Dark Matter (CDM) cosmologies, we would not expect that most galaxies are close to maximum disk. Here we explore what the DM scaling relations are once we constrain the stellar mass components by stellar population modeling.
1. Stellar Population Mass-to-Light Ratios
To constrain the stellar mass distribution in our sample galaxies, we use the color- relationships for mixed stellar populations of Bell & de Jong (2001). In this paper we showed that for almost any reasonable star formation history and consistent chemical evolution of a galaxy, the stellar population models predict a strong correlation between the optical color of the population and its . This was shown to be robust against gas inflow and outflow, different star formation prescriptions and mild starbursts (Fig. 1a).

The one major assumption we had to make was that all galaxies have similar stellar Initial Mass Functions (IMFs), independent of their other properties. The IMF used in our color- analysis determines the slope of the relation, but not the zero-point. This reflects the fact that the high mass end of the IMF determines the luminosity and the color of a population, but the low mass end sets its mass, shifting the relation in Fig. 1a up and down.
We used the maximum disk limits of the Ursa Major galaxies observed by Verheijen (1997) to constrain the IMF. In Fig. 1b we show the maximum allowed ratios for these galaxies (hence the upper limit symbols) versus their – color. We compare these to the predictions of our models for a standard Salpeter IMF (solid diagonal line). If our models are correct, all ratios of galaxies should scatter around this line. Clearly, this is in conflict with observations, as some galaxy upper limits are below the line, and thus using the of our model would over-predict the rotation curve of these galaxies. Hence, we use a normalization that is lower by 0.3 dex (dotted line). In principle, the normalization could be much lower, but there are many indications that in particular high surface brightness galaxies are close to maximum disk (see e.g. Weiner, these proceedings) and therefore we chose a normalization that has these galaxies close to maximum disk. If our color- relation is correct and all true values are near this line, clearly many galaxies are substantially sub-maximal, with some galaxies in the top part of the diagram being sub-maximal by a factor of 10. We use here the updated color- relations of Bell et al. (2003), which were calibrated with SDSS and 2MASS data.
2. Rotation Curve Modeling
We are currently collecting data for a large sample of galaxies with high quality rotation curves with a broad range in galaxy structural parameters (luminosity, scale size, etc.). For each galaxy we aim to have optical and near-IR surface photometry, HI synthesis observations of column densities and rotation curves and high resolution inner rotation curves from H or CO measurements. We expect a final sample of over 100 galaxies; results for 25 are presented here.

Fig. 2 shows our method to determine DM distributions in our galaxies. Using the color profiles of the galaxies, we determine the radial profiles using the color- relations (middle panel). This allows us to turn the surface brightness profiles into surface mass density profiles (top panel). This not only lets us take the radial variation in into account, but more importantly, it provides us with a consistent way of scaling stellar ratios from one galaxy to the next. We add the neutral gas component by scaling the observed HI surface density by 1.32 to account for He and calculate the resulting baryonic rotation curve (bottom panel). As shown, one can now calculate the DM rotation curve by quadratically subtracting the baryonic curve from the observed curve, but this generally yields noisy DM curves in the region dominated by the stars.
3. Dark Matter Halo Scaling Relations
In order to avoid the problem of noisy DM curves, one often fits parametrized DM halo models. Here we show results of fits using Navarro, Frenk, & White (1997, NFW) DM halos, adiabatically contracted by the calculated baryonic component according to the formalism of Blumenthal et al. (1986) (see Dutton et al. 2003 for details). While we find that most high surface brightness galaxies and many low surface brightness galaxies are fitted by NFW DM profiles before adiabatic contraction, after contraction the model rotation curves of most galaxies over-predict the observed rotation in the central regions.


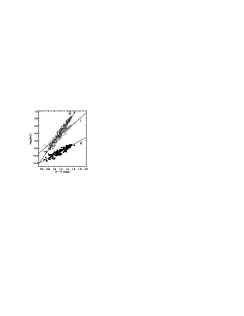
In Fig. 3a we plot the resulting parameters characterizing an NFW profile, and . These parameters have have strongly correlated errors (see Kassin, these proceedings; Dutton et al. 2003) and are often poorly determined even with the stellar mass fixed (all points at are basically undetermined fits). We plot only galaxies with rotation curves extending to at least 3 effective mass radii (about 5 disk scalelengths for pure exponential disks). Before adiabatic contraction, most galaxies lie in the parameter space expected by CDM models (Bullock et al. 2001), but after contraction many galaxies have too small for their , especially at the high mass end. These galaxies have values that are higher than their highest measured speeds, meaning that the model predicts that they have rising rotation curves. Because this has never been observed for massive galaxies and having data out to 5 disk scalelengths is apparently not enough of a constraint, we show in Fig. 3b fits with the observed rotation extended in radius by a factor of 5 with the last measured speed. Even though this does bring a few more galaxies into an acceptable range, there is still a considerable number of galaxies with very high forced by the fit of the central regions. We could reduced the problems caused by adiabatic contraction by lowering our color- normalization, but that would make all galaxies substantial sub-maximal, even the high surface brightness ones.
4. Specific Angular Momentum
Galaxies are thought to build up their angular momentum through tidal torques (Peebles 1969) or by the merging process during galaxy assembly (e.g., Vitvitska 2002). N-body simulations of DM halo formation by Bullock et al. (2001) showed that the specific angular momentum distribution in these DM halos follows a well defined shape. In semi-analytic models it is often assumed that the scale size of a galaxy is set by detailed conservation of the original DM halo angular momentum when the baryons collapse (e.g., Cole et al. 2000; de Jong & Lacey 2001). We calculated the baryonic angular momentum distributions for our best fit models and compared those to the predicted distribution of CDM models. Like van den Bosch et al. (2001) for dwarf galaxies, we find that all galaxies have angular momentum distributions that are clearly different from the models. This suggests that specific angular momentum is not conserved when the gas collapses, which is not surprising given the results of N-body/hydrodynamical modeling of galaxy formation by e.g., Navarro & Steinmetz (2000).
5. Scaling the HI Contribution
It has often been noted that the shapes of the HI and DM rotation curves of galaxies are very similar and that a considerable fraction of the DM in disk galaxies could be made of very cold molecular gas distributed similarly to the HI (see contributions by Combes, Pfenniger and Allen in these proceedings). Hoekstra et al. (2001) studied this phenomenon and found that most of their 26 galaxies were well fitted with a scaled up version of the HI mass distribution when their stellar value was left as a free parameter. Even with values determined by their colors many of our galaxies can be fitted with such a scaled HI model, but the needed HI scaling factors vary greatly among galaxies. A secondary tuning parameter will be needed for the scaling factor.
6. Conclusions
Stellar population synthesis models predict a strong color-
relation. We use this correlation to model rotation curves of
galaxies and determine their DM distribution. Some of the main conclusions
of our investigation are:
- There are large degeneracies in the fitted NFW parameters, even with the
use of stellar constraints.
- With the chosen color- normalization, adiabatically contracted
halos not only over-predict central rotation
speeds of dwarf galaxies, but also those of high surface brightness galaxies.
- The angular momentum distribution in the observed baryons
differs from CDM DM halo predictions, suggesting that
detailed angular momentum is not conserved during the galaxy assembly
process.
- HI rotation curves cannot consistently be scaled
to produce the DM signature.
References
Bell, E. F., & de Jong, R. S. 2001, ApJ, 550, 212
Bell, E. F., McIntosh, D. H., Katz, N., & Weinberg, M. D. 2003, astro-ph/0302543
Blumenthal, G. R., Faber, S.M., Flores, R., & Primack, J.R. 1986, ApJ, 301, 27
Bosma, A. 1981, AJ, 86, 1971
Bullock, J. S., Kolatt, T. S., Sigad, Y., Somerville, R. S., Kravtsov, A. V., Klypin, A. A., Primack, J. R., & Dekel, A. 2001, MNRAS, 321, 559
Cole, S., Lacey, C. G., Baugh, C. M., & Frenk, C. S. 2000, MNRAS, 319, 168
Courteau, S. & Rix, H. 1999, ApJ, 513, 561
de Jong, R. S. & Lacey, C. 2000, ApJ, 545, 781
Dutton, A.A., Courteau, S., Carignan, C., & de Jong, R.S. 2003, astro-ph/0310001
Freeman, K. C., 1970, ApJ, 160, 811
Hoekstra, H., van Albada, T. S., & Sancisi, R. 2001, MNRAS, 323, 453
Navarro, J. F. & Steinmetz, M. 2000, ApJ, 538, 477
Navarro, J. F., Frenk, C. S., & White, S. D. M. 1997, ApJ, 490, 493
Peebles, P. J. E. 1969, ApJ, 155, 393
Rubin, V. C., Thonnard, N., & Ford, W. K. 1978, ApJ, 225, L107
van Albada, T.S., Bahcall, J.N., Begeman, K., & Sancisi, R. 1985, ApJ, 295, 30
van den Bosch, F. C. & Swaters, R. A. 2001, MNRAS, 325, 1017
Verheijen, M. A. W. 1997, PhD thesis, Univ. of Groningen
Vitvitska, M., et al. 2002, ApJ, 581, 799