eurm10 \checkfontmsam10 \pagerange
Hot Gas in the Local Group and Low-Redshift Intergalactic Medium
Abstract
There is increasing observational evidence that hot, highly ionized interstellar and intergalactic gas plays a significant role in the evolution of galaxies in the local universe. The primary spectral diagnostics of the warm-hot interstellar/intergalactic medium are ultraviolet and X-ray absorption lines of O vi and O vii. In this paper, I summarize some of the recent highlights of spectroscopic studies of hot gas in the Local Group and low-redshift universe. These highlights include investigations of the baryonic content of low- O vi absorbers, evidence for a hot Galactic corona or Local Group medium, and the discovery of a highly ionized high velocity cloud system around the Milky Way.
1 Introduction
We live in a wonderful age of discovery and exploration of the universe. As we peer farther and farther back in time, it is becoming ever more important to make sure that we observe the local universe as well as possible. Observations of galactic systems and the intergalactic medium (IGM) in the low-redshift universe are required to study the universe as it has evolved over the last billion years. They are essential for the interpretation of higher redshift systems, and they form a framework for studies of such key topics as galactic evolution, “missing mass”, and the distribution of dark matter. Studies of hot gas and its relationship to galaxies are shedding new light on these and other astronomical topics of interest today. In this review, I summarize some basic information about the elemental species and types of observations that can be used to study hot gas. I also provide overviews of recent spectroscopic observations of hot gas in the low-redshift universe (§2), the Local Group (§3), and the high velocity cloud (HVC) system that surrounds the Milky Way (§4). Some concluding remarks on future observations can be found in §5.
Table 1 contains a summary of some of the most important diagnostics of hot gas in the local universe. The species listed are detectable in either the ultraviolet or X-ray bandpasses accessible with spectrographs aboard the Hubble Space Telescope (HST), the Far Ultraviolet Spectroscopic Explorer (FUSE), the Chandra X-ray Observatory, and XMM-Newton. Most of the diagnostics listed can be observed at their rest wavelength, which means that they can be used to study hot gas in the Local Group. Others must be redshifted into one of the observable bandpasses; the observed wavelength at is listed for for comparison in the table.
| Ion, | b | bthc | |||
| (Å) | (K) | (km s-1) | |||
| FUSE, HST | |||||
| H i Ly-series | … | … | 1369-1824 | … | 13–129d |
| C iv 1548.195 | 0.1908 | 2.470 | 2322.292 | 11.8 | |
| C iv 1550.770 | 0.0952 | 2.169 | 2326.155 | 11.8 | |
| N v 1238.821 | 0.1570 | 2.289 | 1858.232 | 14.6 | |
| N v 1242.804 | 0.0782 | 1.988 | 1864.206 | 14.6 | |
| O iv 787.711 | 0.111 | 1.942 | 1181.567 | 12.9 | |
| O v 629.730 | 0.515 | 2.511 | 944.595 | 16.1 | |
| O vi 1031.926 | 0.1329 | 2.137 | 1547.889 | 17.1 | |
| O vi 1037.617 | 0.0661 | 1.836 | 1556.425 | 17.1 | |
| Ne viii 770.409 | 0.103 | 1.900 | 1155.614 | 21.5 | |
| Ne viii 780.324 | 0.0505 | 1.596 | 1170.486 | 21.5 | |
| Chandra, XMM-Newton | |||||
| O vii 21.602 | 0.696 | 1.177 | 32.403 | 28.8 | |
| O viii 18.967 | 0.277 | 0.720 | 28.450 | 47.8 | |
| O viii 18.972 | 0.139 | 0.421 | 28.459 | 47.8 | |
| Ne ix 13.447 | 0.0724 | 0.988 | 20.170 | 35.2 | |
a-values and wavelengths (in Å) are from Morton (1991), Verner, Barthel, & Tytler (1994), and Verner, Verner, & Ferland (1996).
bTemperature of maximum ionization fraction in collisional ionization equilibrium (Sutherland & Dopita 1993).
cThermal line width, b = , at unless indicated otherwise.
dValue of b for K.
The O vi resonance doublet lines are the best lines to use for kinematical investigations of hot ( K) gas in the low-redshift universe. O vi has a higher ionization potential than other species observable by FUSE and HST, and oxygen has the highest cosmic abundance of all elements other than hydrogen and helium. X-ray spectroscopy of the interstellar or intergalactic gas in higher ionization lines (e.g., O vii, O viii) is possible with XMM-Newton and the Chandra X-ray Observatory for a small number of sight lines toward AGNs and QSOs, but the spectral resolution (R ) is modest compared to that afforded by FUSE (R ) or HST/STIS (). While the X-ray lines provide extremely useful information about the amount of gas at temperatures greater than K, the interpretation of where that gas is located, or how it is related to the K gas traced by O vi, is hampered at low redshift by the kinematical complexity of the hot interstellar medium (ISM) and IGM along the sight lines observed, as discussed below. Nevertheless, the X-ray diagnostics are of fundamental importance for determining the ionization state of the nearby hot gas, and they provide information about hotter gas that is not traced by species in the ultraviolet wavelength region of the electromagnetic spectrum.
Table 2 contains a high-level summary of key considerations for absorption and emission-line spectroscopy of hot interstellar and intergalactic plasmas. Both types of observations have their strengths, and the combination of ultraviolet and X-ray information holds great promise for studies of the ISM and IGM.
| UV Absorption | X-ray Absorption | X-ray Emission | |
| Observatory | FUSE, HST | ||
| N | N | I | |
| … | |||
| Spatial Info. | Point source | Point source | Extended source |
aAssuming a metallicity of solar and peak ionization fractions (see text).
2 Low-Redshift O vi Absorption Systems
One of the recent successes of observational cosmology is the excellent agreement in estimates of the amount of matter contained in baryons derived from measures of the temperature fluctuations in the cosmic microwave background and spectroscopic measures of the primordial abundance of deuterium relative to hydrogen in the high-redshift intergalactic medium (Spergel et al. 2003). At high redshift (), most of the baryons in the universe are contained in intergalactic absorbers, which are detected through spectroscopic observations of their H i and He ii Ly absorption against the background light of distant quasars. At lower redshifts, the Ly forest thins out and galaxies become more prevalent (Penton, Shull, & Stocke 2000). Censuses of these low-redshift Ly clouds and galaxies reveal a baryon deficit compared to the amount of matter observed in the high-redshift universe (see Fukugita, Hogan, & Peebles 1998). This “missing baryon” problem has led to the suggestion that much of the baryonic material at low redshift is found in the form of hot, highly ionized intergalactic gas that is difficult to detect with existing instrumentation.
Hydrodynamical simulations of the evolution of the IGM in the presence of cold dark matter predict that the intergalactic clouds collapse into coherent sheets and filaments arranged in a web-like pattern. As lower density gas streams into the deeper potential wells at the intersections of these sheets and filaments, clusters of galaxies form. Shocks heat the collapsing structures to temperatures of K, resulting in a pervasive network of hot gas (Cen & Ostriker 1999; Davé et al. 2001). Understanding the physical processes involved in galaxy-formation is the key to determining whether this description of the intergalactic medium is correct. In particular, the simulations do not yet have sufficient observational constraints to accurately model how the cosmic web responds to the formation of galaxies. Feedback between galaxies and the cosmic web affects the kinematics, distribution, metal content, and temperature of the IGM. These processes are probably self-regulating. Detailed studies are most promising at low redshift, where it is possible to sample the IGM absorption on finer scales, identify faint galaxies, and study galactic properties in greater detail than is possible at high redshift. Many fundamental questions remain to be answered:
-
1.
Is the hot IGM a significant repository of baryons at low redshift? How much mass is contained in the cosmic web of hot gas?
-
2.
How does feedback during galaxy formation affect the properties of the IGM and the efficiency of galaxy formation? What are the primary feedback mechanisms?
-
3.
What is the morphology of the cosmic web and the dark matter it traces?
-
4.
Are there fundamental relationships between the hot IGM and the hot gas found in clusters and groups of galaxies?
Observational evidence for a hot IGM at low redshifts remains limited mainly to detections of highly ionized oxygen (primarily O vi) along a small number of sight lines. The low-redshift O vi systems that have been observed have a variety of strengths and O vi/H i ratios. Many occur at the redshifts of groups or clusters of galaxies along the same sight lines. Several sight lines have been examined in detail for O vi absorbers: H 1821+643 (Tripp, Savage, & Jenkins 2000; Oegerle et al. 2000), PG 0953+415 (Tripp & Savage 2000; Savage et al. 2002), 3C 273 (Sembach et al. 2001), PKS 2155-304 (Shull, Tumlinson, & Giroux 2003), PG 1259+593 (Richter et al. 2004), PG 1116+215 (Sembach et al. 2004), and PG 1211+143 (Tumlinson et al. 2004). An important piece of information that is lacking for many of the well-observed O vi absorbers is the amount of C iv associated with the O vi. This information can, and should, be obtained with the HST.
Figure 1 illustrates a few of the absorption lines observed by FUSE in one of the two O vi systems toward PG 0953+415 (Savage et al. 2002). The lines are easily detected and are nearly resolved at the FUSE resolution of km s-1 (FWHM). This absorption system has ionization properties consistent with photoionization by dilute ultraviolet background radiation but may also be collisionally ionized. A good example of a system that is probably collisionally ionized is given by Tripp et al. (2001). Other investigators have suggested that many of the O vi systems are collisionally ionized based on the observed relationship between the line width and O vi column density found for a wide range of environments containing O vi (Heckman et al. 2002).

The baryonic contribution of the O vi absorbers to the closure density of the universe is (O vi) = 0.002 if their typical metallicity is solar (Savage et al. 2002). Here, is the Hubble constant in units of 75 km s-1 Mpc-1. This baryonic contribution is of the same order of magnitude as the contribution from stars and gas inside galaxies. More information about O vi in the low-redshift IGM can be found in the aforementioned sight line references. See Tripp (2002) for a recent review of the subject.
Information on hot gas at low redshift is also provided by X-ray measurements of O vii and O viii, although the number of measurements is limited at this time. These results are sometimes conflicting, as in the case of the absorbers toward PKS 2155-304 (e.g., Fang et al. 2002; Shull et al. 2003), or are of modest statistical significance (e.g., Cagnoni 2002; Mathur, Weinberg, & Chen 2003; McKernan et al. 2003b). None of the claimed detections to date at have been particularly convincing. Still, the fact that it is possible to conduct searches for X-ray absorption lines in the hot IGM is promising. To form a large enough database to make firmer statements about the baryonic contribution of gas hotter than that contained in the O vi absorption systems will likely require spectrographs on X-ray telescopes with very large effective areas, such as Constellation-X.
3 Hot Local Group Gas
An interesting development in studies of the gaseous content of Local Group galaxies is the mounting evidence for a hot, extended corona of low density gas around the Milky Way. This corona may extend to great distances from the Galaxy, and may even pervade much of the Local Group. In recent years, several results have strengthened the case for such a medium. These include:
-
i.
The detection of O vi high velocity clouds in the vicinity of the Galaxy. The properties of these clouds suggest that the O vi is created at the boundaries of cooler HVCs as they move through a pervasive coronal medium (Sembach et al. 2003; Collins, Shull, & Giroux 2004). The properties of the O vi HVCs and their possible origins are discussed below in §4.
-
ii.
Chandra and XMM-Newton detections of O vii absorption near zero redshift. O vii peaks in abundance at K in collisional ionization equilibrium. A summary of these O vii detections is given in Table 3, where the observed equivalent width of the O vii line is listed. Other high ionization species, such as O viii and Ne ix may also be detected along the same sight lines, albeit at somewhat lower significance.
-
iii.
Ram-pressure stripping of gas in Local Group dwarf galaxies. Moore & Davis (1994) postulated a hot, low-density corona to provide ram pressure stripping of some of the Magellanic Cloud gas and to explain the absence of gas in globular clusters and nearby dwarf spheroidal companions to the Milky Way (see also Blitz & Robishaw 2000). The shape and confinement of some Magellanic Stream concentrations (Stanimirovic et al. 2002) and the shapes of supergiant shells along the outer edge of the LMC (de Boer et al. 1998) are also more easily explained if an external medium is present.
-
iv.
Drag deflection of the Magellanic Stream on its orbit around the Milky Way. N-body simulations of the tidal evolution and structure of the leading arm of the Magellanic Stream require a low-density medium ( cm-3) to deflect some of the Stream gas into its observed configuration (Gardiner 1999).
| Sight Line | l (o) | b (o) | (mÅ)a | Instrument | Referencesb |
|---|---|---|---|---|---|
| PKS 2155-304 | 17.73 | –52.25 | Chandra LETG | N02,F03 | |
| Chandra LETG | F02 | ||||
| XMM RGS | R03 | ||||
| Mrk 421 | 179.83 | +65.03 | XMM RGS | R03 | |
| 3C 273 | 289.95 | +64.36 | Chandra LETG | F03 | |
| XMM RGS | R03 | ||||
| NGC 4593 | 297.48 | +57.40 | Chandra HETG | M03 |
aEquivalent width in mÅ. For those studies listing equivalent
widths in energy units rather than wavelength units,
the following conversion was used: . Errors for all values are quoted are at 90% confidence, except the C02 value for Mrk 421, which is a 1 estimate.
bReferences: C02 = Cagnoni (2002);
F02 = Fang et al. (2002); F03 = Fang, Sembach, & Canizares (2003);
M03 = McKernan et al. (2003a);
N02 = Nicastro et al. (2002); R03 = Rasmussen, Kahn, & Paerels (2003).
3.1 An Estimate of X-ray Absorption Produced by the Hot Gas at
Perhaps the most direct measure of the amount of hot gas is given by the X-ray absorption measurements. A tenuous hot Galactic corona or Local Group gas should be revealed through X-ray absorption-line observations of O vii. The medium should have a temperature K to avoid direct detection in lower ionization species such as O vi, a density cm-2 to prevent orbital decay of the Magellanic Stream, and an extent kpc to explain the detections of O vi in the Magellanic Stream (see Sembach et al. 2003). The column density of O vii in the hot gas is given by
N(O vii) = (O/H)⊙ f ,
where is the metallicity of the gas in solar units, f is the ionization fraction of O vii, is the path length, and (O/H) (Allende Prieto, Lambert, & Asplund 2001). At K, f (Sutherland & Dopita 1993). For cm-3, (O vii) ( kpc) cm-2. This column density is of the order of magnitude derived for the equivalent widths listed in Table 3. Conversion of the observed O vii equivalent widths into an O vii column densities requires assumptions about the Doppler parameters for the lines since the lines are likely unresolved, with some authors preferring to constrain the possible b-values (e.g., Fang et al. 2003; Nicastro et al. 2002), and others preferring to list only lower limits to N(O vii) from the assumption of a linear curve of growth (e.g., Rasmussen et al. 2003).
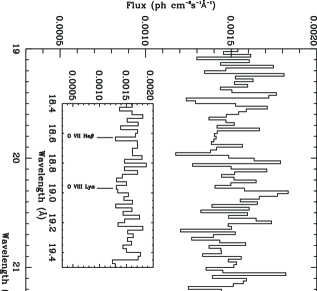
It is extremely important to realize that there may be sources for the O vii and other high ionization X-ray lines observed that do not involve a hot Galactic corona or Local Group medium. Alternative locations for some of the hot gas along the sight lines observed include the thick disk and low halo of the Galaxy (see Savage et al. 2003) and large Galactic structures that are filled with hot gas, such as Loop I (see Snowden et al. 1997). The possible contributions of these different regions to the observed O vii absorption along the 3C 273 sight line are discussed by Fang et al. (2003); a portion of their X-ray spectrum is reproduced in Figure 2. Isolating the distant Galactic corona or Local Group contributions to the X-ray absorption from nearby regions of hot gas is difficult to do kinematically because the spectral resolution of the X-ray data is insufficient to resolve the velocities of most objects in the Local Group from the velocity of the Galaxy.
A hot extended Galactic corona or Local Group medium has several testable predictions. O vii absorption should be observed in essentially any direction where an X-ray bright background continuum source can be observed with sufficient signal-to-noise to detect the line with a strength mÅ. The amount of absorption observed may vary based on direction and the types of foreground structures probed. In general, observations of nearby X-ray sources should yield interstellar O vii column densities less than those observed toward extragalactic X-ray sources. Futamoto et al. (2003) have recently reported the detection of strong O vii absorption toward the low mass X-ray binary 4U1820-303 in NGC 6624, which is at odds with this prediction since 4U1820-303 is only kpc from the Galactic plane. However, Futamoto et al. (2003) did not detect O vii toward Cyg-X2, which is at a similar Galactic altitude. Additional observations of this type would be valuable for determining the distribution of hot gas near the plane of the Galaxy. Investigators working in this field should report significant non-detections whenever possible.
3.2 Problems with a Single-Phase Ultra-Low Density Medium Model
Given the probability that several regions contribute to the observed absorption, it is dangerous to assume that the X-ray bearing gas is uniform, at a single temperature, or confined to one type of region. The same holds true for the lower temperature O vi gas, which is known to have a patchy spatial distribution and line profiles that contain multiple components (see Savage et al. 2003; Sembach et al. 2003; Howk et al. 2002). An example of the pitfalls that can be encountered in analyses of the X-ray absorption is provided by the PKS 2155-304 sight line. Nicastro et al. (2002) associated the X-ray absorption near along the PKS 2155-304 sight line with the high-velocity O vi absorption observed by Sembach et al. (2000). They found that a relatively uniform, ultra-low density, single-phase plasma with a density cm-3 and a size of roughly 3 Mpc was able to explain the O vi-viii absorption, modulo some difficulties in reproducing the observed Ne/O ratio in the hot gas. From this, they concluded that the X-ray bearing gas must be distributed throughout the Local Group. However, this conclusion rested strongly on the supposition that the high velocity O vi absorption and the X-ray absorption in this direction are uniquely related, with no other significant sources of O vi or O vii-viii inside or outside the Galaxy. This conclusion fails to account for the complex distribution of gas along the sight line and the ample evidence that the O vi HVCs in this direction have kinematical signatures similar to lower ionization species whose presence is not consistent with gas at K and cm-3 [see Sembach et al. (1999) and Collins et al. (2004) for information on the lower ionization species such as C ii, C iv, Si ii, Si iii, Si iv]. The ionization parameter in the proposed medium is far too high to explain the strengths of the low ionization lines observed at essentially the same velocities as the O vi HVCs. Other types of inhomogeneities in the hot gas distribution may also be present, as they are needed to reconcile the observed Ne/O ratio with a solar ratio of Ne/O (Nicastro et al. 2002). (The possibility of explaining the factor of 2 discrepancy between the observed Ne/O ratio and the solar ratio by preferential incorporation of oxygen into dust grains seems dubious given the much higher cosmic abundance of oxygen). If one invokes inhomogeneities in the gas distribution to explain the lower ionization gas, then such regions must necessarily account for some, or perhaps even all, of the O vi. As a result, the ionization constraints used to deduce the existence of an ultra-low density medium break down, and the adoption of a uniform single temperature medium is cast in doubt.
The low ionization high velocity clouds toward PKS 2155-304 should have densities typical of those of clouds located near the Galaxy (i.e., cm-3). An example of one such region is high velocity cloud Complex C, whose ionization conditions suggest that the cloud is interacting with gas in an extended Galactic corona (Sembach et al. 2003; Fox et al. 2004; Collins et al. 2004). Interactions of this type are consistent with the wider distribution of high velocity O vi seen on the sky (see §4) and provide a dynamic, non-equilibrium view of the gas ionization that is far more amenable to creating a range of ionization conditions than is possible in a static, ultra-low density medium having enormous cooling times.
Thus, while some of the highly ionized oxygen may be located in the Local Group, consideration of all of the available information indicates that an ultra-low density ( cm-3, ) Local Group medium is not a viable explanation for all of the X-ray and high velocity O vi absorption toward PKS 2155-304. A low density (but not too low density) medium with cm-3 is still a possible repository for much of the highly ionized gas, but is in all likelihood only part of a complex distribution of hot gas along this sight line. Additional discussion of the observational and theoretical implications of a Local Group medium and the complications that can arise in interpreting the existing data can be found in Maloney (2003).
4 High Velocity Clouds in the Vicinity of the Milky Way
We have conducted an extensive study of the highly ionized high velocity gas in the vicinity of the Milky Way using data from the FUSE satellite. Below, I summarize the results for the sight lines toward 100 AGNs/QSOs and two distant halo stars (see Sembach et al. 2003; Wakker et al. 2003). The FUSE observations represent the culmination of megaseconds of actual exposure time and many years of effort by the FUSE science team. For the purposes of this study, gas with km s-1 is typically identified as “high velocity”, while lower velocity gas is attributed to the Milky Way disk and halo. Sample spectra from the survey are shown in Figure 3. Complementary talks on this subject were presented at the Sydney IAU in Symposium 217 by Blair Savage (a description of the FUSE O vi survey) and Bart Wakker (an overview of high velocity clouds) (see Savage et al. 2004; Wakker 2004).

4.1 Detections of High Velocity O vi
Sembach et al. (2003) identified 84 individual high velocity O vi features along 102 sight lines observed by FUSE. A critical part of this identification process involved detailed consideration of the absorption produced by O vi and other species (primarily H2) in the thick disk and halo of the Galaxy, as well as the absorption produced by low-redshift intergalactic absorption lines of H i and ionized metal species along the lines of sight studied. Our methodology for identifying the high velocity features and the possible complications involved in these identifications are described in detail by Wakker et al. (2003). We searched for absorption in an LSR velocity range of km s-1 centered on the O vi line. With few exceptions, the high velocity O vi absorption is confined to km s-1, indicating that the identified O vi features are either associated with the Milky Way or are nearby clouds within the Local Group. Information about the lower velocity ( km s-1) gas inside the thick disk and low halo of the Milky Way can be found in Savage et al. (2003).
We detect high velocity O vi absorption with total equivalent widths mÅ at confidence along 59 of the 102 sight lines surveyed. For the highest quality sub-sample of the dataset, the high velocity detection frequency increases to 22 of 26 sight lines. Forty of the 59 sight lines have high velocity O vi absorption with mÅ, and 27 have total equivalent widths mÅ. Converting these O vi equivalent width detection frequencies into estimates of (H+) in the hot gas indicates that % of the sky (and perhaps as much as %) is covered by hot ionized hydrogen at a level of cm-2, assuming an ionization fraction f and a gas metallicity similar to that of the Magellanic Stream (). This detection frequency of hot H+ associated with the high velocity O vi is larger than the value of % found for warm, high velocity neutral gas with (H i) cm-2 traced through 21 cm emission (Lockman et al. 2002).
4.2 Velocities
The high velocity O vi features have velocity centroids ranging from km s-1 to km s-1. There are an additional 6 confirmed or very likely (% confidence) detections and 2 tentative detections of O vi between and +1200 km s-1; these very high velocity features probably trace intergalactic gas beyond the Local Group. Most of the high velocity O vi features have velocities incompatible with those of Galactic rotation (by definition).

We plot the locations of the high velocity O vi features in Figure 4, with squares indicating positive velocity features and circles indicating negative velocity features. The magnitude of the LSR velocity (without sign) is given inside each square or circle for the dominant high velocity O vi feature along each sight line. For sight lines with multiple high velocity features, we have plotted the information for the feature with the greatest O vi column density. Solid dots indicate directions where no high velocity O vi was detected.
There is sometimes good correspondence between high velocity H i 21 cm emission and high velocity O vi absorption. When high velocity H i 21 cm emission is detectable in a particular direction, high velocity O vi absorption is usually detected if a suitable extragalactic continuum source is bright enough for FUSE to observe. For example, O vi is present in the Magellanic Stream, which passes through the south Galactic pole and extends up to , with positive velocities for and negative velocities for . O vi is present in high velocity cloud Complex C, which covers a large portion of the northern Galactic sky between and and has velocities of roughly –100 to –170 km s-1. The H 1821+643 sight line () contains O vi absorption at the velocities of the Outer Arm ( km s-1) as well as at more negative velocities.
In some directions, high velocity O vi is observed with no corresponding high velocity H i 21 cm emission. For example, at there are many O vi HVCs with km s-1. Some of these features are broad absorption wings extending from the lower velocity absorption produced by the Galactic thick disk/halo. High velocity O vi features toward Mrk 478 (, km s-1), NGC 4670 (, km s-1), and Ton S180 (, km s-1) stand out as having particularly unusual velocities compared to those of other O vi features in similar regions of the sky. They too lack counterparts in H i 21 cm emission. These features may be located outside the Local Group (i.e., in the IGM). We are currently investigating the H i content of some of these clouds through their H i Lyman-series absorption in the FUSE data.
The segregation of positive and negative velocities in Figure 4 is striking, indicating that the clouds and the underlying (rotating) disk of the Galaxy have very different kinematics. A similar velocity pattern is seen for high velocity H i 21 cm emission and has sometimes been used to argue for a Local Group location for the high velocity clouds (see Blitz et al. 1999). The kinematics of the high velocity O vi clouds are consistent with a distant location, but do not necessarily require an extended Local Group distribution as proposed by Nicastro et al. (2003). The dispersion about the mean of the high velocity O vi centroids decreases when the velocities are converted from the Local Standard of Rest (LSR) into the Galactic Standard of Rest (GSR) and the Local Group Standard of Rest (LGSR) reference frames. While this reduction is expected if the O vi is associated with gas in a highly extended Galactic corona or in the Local Group, it does not provide sufficient proof by itself of an extended extragalactic distribution for the high velocity gas because the correction to the LGSR reference frame requires proper knowledge of the total space velocities of the clouds. Only one component of motion - the velocity toward the Sun - is observed. Additional information, such as the gas metallicity, ionization state, or parallax resulting from transverse motion across the line of sight, is needed to constrain whether the clouds are located near the Galaxy or are farther away in the Local Group.
4.3 Column Densities and Line Widths
The high velocity O vi features have logarithmic column densities (cm-2) of 13.06 to 14.59, with an average of and a median of 13.97 (see Figure 5, left panel). The average high velocity O vi column density is a factor of 2.7 times lower than the typical low velocity O vi column density found for the same sight lines through the thick disk/halo of the Galaxy (see Savage et al. 2003).


The line widths of the high velocity O vi features range from 16 km s-1 to 81 km s-1, with an average of km s-1 (see Figure 5, right panel). The lowest values of b are close to the thermal width of 17.1 km s-1 expected for O vi at its peak ionization fraction temperature of K in collisional ionization equilibrium (Sutherland & Dopita 1993). The higher values of b require additional non-thermal broadening mechanisms or gas temperatures significantly larger than K.
4.4 Origin of the High Velocity O vi
One possible explanation for some of the high velocity O vi is that transition temperature gas arises at the boundaries between cool/warm clouds of gas and a very hot ( K) Galactic corona or Local Group medium. Sources of the high velocity material might include infalling or tidally disturbed galaxies. A hot, highly extended ( kpc) corona or Local Group medium might be left over from the formation of the Milky Way or Local Group, or may be the result of continuous accretion of smaller galaxies over time. Evidence for a hot Galactic corona or Local Group medium is given in §3. Hydrodynamical simulations of clouds moving through a hot, low-density medium show that weak bow shocks develop on the leading edges of the clouds as the gas is compressed and heated (Quilis & Moore 2001). Even if the clouds are not moving at supersonic speeds relative to the ambient medium, some viscous or turbulent stripping of the cooler gas likely occurs. An alternative explanation for the O vi observed at high velocities may be that the clouds and any associated H i fragments are simply condensations within large gas structures falling onto the Galaxy. Cosmological structure formation models predict large numbers of cooling fragments embedded in dark matter, and some of these structures should be observable in O vi absorption as the gas passes through the K temperature regime (Davé et al. 2001).
4.5 Are the O vi HVCs Extragalactic Clouds?
Some of the high velocity O vi clouds may be extragalactic clouds, based on what we currently know about their ionization properties. However, claims that essentially all of the O vi HVCs are extragalactic entities associated with an extended Local Group filament based on kinematical arguments alone appear to be untenable. Such arguments fail to consider the selection biases inherent in the O vi sample, the presence of neutral (H i) and lower ionization (Si iv, C iv) gas associated with some of the O vi HVCs, and the known “nearby” locations for at least two of the primary high velocity complexes in the sample — the Magellanic Stream is circumgalactic tidal debris, and Complex C is interacting with the Galactic corona (see Fox et al. 2004). Furthermore, the O vii X-ray absorption measures used to support an extragalactic location have not yet been convincingly tied to either the O vi HVCs or to a Local Group location. The O vii absorption may well have a significant Galactic component in some directions (see Fang et al. 2003). The Local Group filament interpretation (Nicastro et al. 2003) may be suitable for some of the observed high velocity O vi features, but it clearly fails in other particular cases (e.g., the Magellanic Stream or the PKS 2155-304 HVCs – see §3). It also does not reproduce some of the properties of the ensemble of high velocity O vi features in our sample. For example, the “Local Supercluster Filament” model (Kravtsov, Klypin, & Hoffman 2002) predicts average O vi velocity centroids higher than those observed ( km s-1 vs. km s-1) and average O vi line widths higher than those observed (FWHM km s-1 vs. FWHM km s-1). Additional absorption and emission-line observations of other ions at ultraviolet wavelengths, particularly C iv and Si iv, would provide valuable information about the physical conditions, ionization, and locations of the O vi clouds.
5 Summary and Future Prospects
The detection of hot gas locally and at low redshift has altered our perspective on the presence of highly ionized gas outside of galaxies and has led to refined estimates of the baryonic content of the present-day universe. Clearly, there is much work yet to be done in determining the spatial distribution of the hot gas, its physical conditions, and its association with galaxies and the larger-scale gaseous structures from which galaxies form.
A deeper understanding of the spatial distribution of the hot gas would be possible with ultra-sensitive maps of the diffuse O vi emission associated with the cosmic web. Emission maps would enable estimates of the filling factor of the hot gas, and would set the context for ongoing absorption-line studies of the hot gas. Experiments to produce O vi emission maps over large regions of the sky are well-suited to small and medium Explorer-class missions and have been proposed to NASA.
The Hubble Space Telescope Cosmic Origins Spectrograph, which is to be installed as part of the next HST servicing mission, will greatly enhance studies of O vi systems at redshifts by increasing the number of accessible background sources to use for the absorption-line measurements. Larger redshift paths will be probed, and more sight lines will be examined. In addition, the high sensitivity of the spectrograph will permit the acquisition of very high signal-to-noise spectra for bright extragalactic sources. In the longer term, larger (6-20 m) ultraviolet/optical telescopes in space will make it possible to select many closely spaced lines of sight for detailed spectroscopic and imaging investigations of galactic and intergalactic structures associated with the hot gas. A key scientific motivation for such investigations will be to determine feedback mechanisms operating on the hot gas and the degree to which these processes affect the formation and evolution of galaxies.
Acknowledgements.
I thank Blair Savage, Bart Wakker, Philipp Richter, and Marilyn Meade for their efforts in making the FUSE O vi survey a reality. I acknowledge lively discussions about O vi absorption with Todd Tripp and Mike Shull.References
- [] Allende Prieto, C., Lambert, D.L., Asplund, M. 2001, ApJ, 556, L63
- [] Blitz, L., & Robishaw, T. 2000, ApJ, 541, 675
- [] Blitz, L., Spergel, D.N., Teuben, P., Hartmann, D., & Burton, W.B. 1999, ApJ, 514, 818
- [] Cagnoni, I. 2002, astro-ph/0212070
- [] Cen, R., & Ostriker, J.P. 1999, ApJ, 514, 1
- [] Collins, J.A., Shull, J.M., & Giroux, M.L. 2004, ApJ, submitted
- [] Davé, R., et al. 2001, ApJ, 552, 473
- [] de Boer, K.S., Braun, J.M., Vallenari, A., & Mebold, U. 1998, A&A, 329, L49
- [] Fang, T.T., Marshall, H.L., Lee, J.C., Davis, D.S., & Canizares, C.R. 2002, ApJ, 572, L127
- [] Fang, T., Sembach, K.R., & Canizares, C.R. 2003, ApJ, 586, L49
- [] Futamoto, K., Mitsuda, K., Takei, Y., Fujimoto, R., & Yamasaki, N. 2003, ApJ, in press [astro-ph/0310867]
- [] Fox, A., Savage, B.D., Wakker, B.P., Richter, P., Tripp, T.M., & Sembach, K.R. 2004, ApJ, in press
- [] Fukugita, M., Hogan, C., & Peebles, J. 1998, ApJ, 503, 518
- [] Gardiner, L.T., 1999, in ASP Conf. Ser. 166, The Stromlo Workshop on High Velocity Clouds, eds. B.K. Gibson & M.E. Putman, (San Francisco: ASP), 292
- [] Heckman, T.M., Norman, C.A., Strickland, D.K., & Sembach, K.R. 2002, ApJ, 577 ,691
- [] Howk, J.C., Savage, B.D., Sembach, K.R., & Hoopes, C.G. 2002, ApJ, 572, 264
- [] Kravtsov, A.V., Klypin, A., & Hoffman, Y. 2002, ApJ, 571, 563
- [] Lockman, F.J., Murphy, E.M., Petty-Powell, S., & Urick, V. 2002, ApJS, 140, 331
- [] Mathur, S., Weinberg, D.H., & Chen, X. 2003, ApJ, 582, 82
- [] Maloney, P.R. 2003, in the IGM/Galaxy Connection, eds. J.L. Rosenberg & M.E. Putman, (Dordrecht: Kluwer), 299
- [] McKernan, B., Yaqoob, T., George, I.M., & Turner, T.J. 2003a, ApJ, 593, 142
- [] McKernan, B., Yaqoob, T., Mushotzky, R., George, I.M., & Turner, T.J. 2003b, astro-ph/0310476
- [] Moore, B., & Davis, M. 1994, MNRAS, 270, 209
- [] Morton, D.C. 1991, ApJS, 77, 119
- [] Nicastro, F., et al. 2002, ApJ, 573, 157
- [] Nicastro, F., et al. 2003, Nature, 421, 719
- [] Oegerle, W.R., et al. 2000, ApJ, 538, L23
- [] Penton, S.V., Shull, J.M., & Stocke, J.T. 2000, ApJ, 544, 150
- [] Quilis, V., & Moore, B. 2001, ApJ, 555, L95
- [] Rasmussen, A., Kahn, S.M., & Paerels, F. 2003, in the IGM/Galaxy Connection, eds. J.L. Rosenberg & M.E. Putman, (Dordrecht: Kluwer), 109 [astro-ph/0301183]
- [] Richter, P., Savage, B.D., Tripp, T.M., & Sembach, K.R. 2004, ApJ, submitted
- [] Savage, B.D., Sembach, K.R., Tripp, T.M., & Richter, P. 2002, ApJ, 564, 631
- [] Savage, B.D., et al. 2003, ApJS, 146, 125
- [] Savage, B.D, Wakker, B.P., Sembach, K.R., Richter, P., & Meade, M. 2004, in IAU Symp. 217, Recycling Intergalactic and Interstellar Matter, eds. P. Duc, J. Brain, & E. Brinks
- [] Sembach, K.R., Savage, B.D., Lu, L., & Murphy, E.M. 1999, ApJ, 515, 108
- [] Sembach, K.R., et al. 2000, ApJ, 538, L31
- [] Sembach, K.R., Howk, J.C., Savage, B.D., Shull, J.M., & Oegerle, W.R. 2001, ApJ, 561, 573
- [] Sembach, K.R., et al. 2003, ApJS, 146, 165
- [] Sembach, K.R., Tripp. T.M., & Savage, B.D. 2004, ApJ, in prep
- [] Shull, J.M., Tumlinson, J., & Giroux, M.L. 2003, ApJ, 594, L107
- [] Snowden, S.L., et al. 1997, ApJ, 485, 125
- [] Spergel, D., et al. 2003, ApJS, 148, 175
- [] Sutherland, R.S., & Dopita, M.A. 1993, ApJS, 88, 253
- [] Stanimirovic, S., Dickey, J.M., Kro, M., & Brooks, A.M. 2002, ApJ, 576, 773
- [] Tripp, T.M. 2002, in ASP Conf. Ser. 254, Extragalactic Gas at Low Redshift, eds. J.S. Mulchaey & J.T. Stocke, (Provo: ASP), 323
- [] Tripp, T.M., Giroux, M.L., Stocke, J.T., Tumlinson, J., & Oegerle, W.R. 2001, ApJ, 563, 724
- [] Tripp, T.M., & Savage, B.D. 2000, ApJ, 542, 42
- [] Tripp, T.M., Savage, B.D., & Jenkins, E.B. 2000, ApJ, 534, L1
- [] Tumlinson, J., Shull, J.M., Giroux, M.L., & Stocke, J.T. 2004, in prep
- [] Verner, D.A, Barthel, P. & Tytler, D. 1994, ApJ, 430, 186
- [] Verner, D.A., Verner, E.M., & Ferland, G.J. 1996, Atomic Data Nucl. Data Tables, 64, 1
- [] Wakker, B.P. 2001, ApJS, 136, 463
- [] Wakker, B.P. 2004, in IAU Symp. 217, Recycling Intergalactic and Interstellar Matter, eds. P. Duc, J. Brain, & E. Brinks
- [] Wakker, B.P., et al. 2003, ApJS, 146, 1