The inner kiloparsec of the jet in 3C 264
We present new multi-frequency EVN, MERLIN and VLA observations of the radio source 3C 264, sensitive to linear scales ranging from the parsec to several kiloparsecs. The observations confirm the existence of regions with different properties in the first kiloparsec of the jet. The most remarkable feature is the transition between a well collimated narrow jet at distances from the core below 80 pc, to a conical-shaped wide jet, with an opening angle of . Another change of properties, consisting of an apparent deflection of the jet ridge line and a diminution of the surface brightness, occurs at a distance of pc from the core, coincident with the radius of a ring observed at optical wavelengths. Our observations add new pieces of information on the spectrum of the radio-optical jet of 3C 264, with results consistent with a synchrotron emission mechanism and a spectrum break frequency in the infrared. Brightness profiles taken perpendicularly to the jet of 3C 264 are consistent with a spine brightened jet at distances below 100 pc from the core, and an edge-brightened jet beyond, which can be interpreted as evidence of a transverse jet velocity structure. Our observations do not allow us to distinguish between the presence of a face–on dust and gas disk at the center of the host galaxy of 3C 264, or rather an evacuated bubble. However, the properties of the jet structure, the changes in the polarization angle, and the plausible jet orientation can be naturally brought into agreement in the bubble scenario.
Key Words.:
Galaxies: individual (3C 264, NGC 3862) – Galaxies: active – Galaxies: nuclei – Galaxies: jets – Radio continuum: galaxies1 Introduction
The radio source 3C 264 (B1142+198) is a low luminosity radio galaxy optically identified with NGC 3862, an elliptical galaxy in the cluster Abell 1367 with and a redshift (Smith et al. smith (2000)). This radio galaxy has been observed at many different wavelengths from the radio to the X-ray, allowing a good determination of its nuclear spectral energy distribution (Capetti et al. capetti2 (2000)). 3C 264 has a Fanaroff-Riley type I radio structure (Fanaroff & Riley fanaroff (1974)) with a head-tailed morphology at kiloparsec scales111We assume throughout a Hubble constant of km s-1 Mpc-1 and a deceleration parameter of , so that corresponds to 412 pc, a prominent core and a wiggling jet extending toward the northeast that ends in a blob of emission at (11.5 kpc) from the core (Gavazzi, Perola & Jaffe gavazzi (1981); Bridle & Vallée bridle (1981); Baum et al. baum1 (1988); Lara et al. lara97 (1997)). There is evidence of counterjet emission in the southwest direction from the core (Lara et al. lara97 (1997)). Both the jet and counterjet are embedded in a vast and diffuse region of low surface brightness emission which seems to be dragged toward the north, possibly revealing the existence of a high density intra-cluster medium.
Simultaneous EVN222EVN: European VLBI Network and MERLIN333MERLIN: Multi-Element Radio Linked Interferometer Network observations at 5.0 GHz by Lara et al. (lara99 (1999)) showed for the first time the detailed structure of 3C 264 at sub-kiloparsec scales. It consists of a one-sided jet with evident variations in its morphological properties with distance: i) the strong core and innermost jet (0 - 10 pc); ii) a well-collimated and narrow region (10-100 pc); iii) a region with strong widening, kinks and filaments (100-300 pc); iv) a faint and narrow region after a jet deflection (300 - 400 pc from the core).
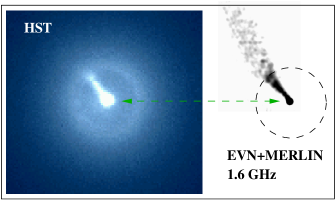
Besides this rich radio structure, another peculiarity of 3C 264 is the existence of an optical jet coincident with the radio jet, most possibly of synchrotron nature (Lara et al. lara99 (1999)) and extending up to (0.82 kpc) (Crane et al. crane (1993); Baum et al. baum2 (1997)). There is also evidence of a “ring” around the host galaxy core with a radius between and (300 - 400 pc) (Baum et al. baum2 (1997)).
We present in this paper new observations of the radio galaxy 3C 264, made with MERLIN and the EVN at 1.6 GHz, and VLA444VLA: Very Large Array observations at 1.6, 5.0, 22.5 and 43.3 GHz. The new data allow a direct comparison with previous sub-kiloparsec scale observations at 5.0 GHz (Lara et al. lara99 (1999)) and shed light on the properties of the inner kiloparsec of the jet in 3C 264, a length scale which is crucial to the understanding of the FR I vs. FR II dichotomy of radio galaxies.
2 Observations and data reduction
We observed 3C 264 simultaneously with the EVN and MERLIN arrays at 1.6 GHz on June 3rd 1997. Eleven EVN antennas participated in the Very Long Baseline Interferometry (VLBI) observations forming a sensitive interferometric array with minimum and maximum baselines of 0.77 M and 46 M, respectively (Table 1). All the antennas recorded left circular polarization, with a synthesized bandwidth of 28 MHz. The strong compact sources 4C 39.25 and 1144+402 were observed to serve as fringe finders during the correlation of the data. The VLBI data were correlated in absentia by the staff of the MkIIIA VLBI correlator at the Max-Planck-Institut für Radioastronomie in Bonn (Germany). We used the NRAO AIPS555AIPS: Astronomical Image Processing System, developed and maintained by the NRAO package to correct for instrumental phase and delay offsets between the separate baseband converters in each antenna, and to determine the antenna-based fringe correction. The visibility amplitudes were calibrated using the system temperatures and gain information provided for each telescope. Data imaging was performed with the Difmap package (Shepherd et al. shepherd (1994)). A summary of these and other observations presented in this paper is displayed in Table 1.
| Array | Frequency | Bandwidth | Time | Date |
| (GHz) | (MHz) | (min) | (yr) | |
| EVNa | 1.6 | 28 | 720 | 1997.42 |
| MERLINb | 1.6 | 16 | 720 | 1997.42 |
| VLA-A | 1.6 | 50 | 30 | 1999.68 |
| VLA-A | 5.0 | 100 | 30 | 1999.68 |
| VLA-A | 22.5 | 100 | 180 | 1999.68 |
| VLA-A | 43.3 | 100 | 180 | 1999.68 |
| a EVN array (diameter in parenthesis): Shanghai (25m) and Urumqi (25m) in China, Simeiz (22m) in Ukraine, Torun (32m) in Poland, Medicina (32m) and Noto (32m) in Italy, Effelsberg (100m) in Germany, Onsala (25m) in Sweden, Westerbork (25m) in The Netherlands, and Cambridge (32m) and Lovell-Jodrell (76m) in the U.K. | ||||
| b MERLIN array (diameter in parenthesis): Defford (25m), Cambridge (32m), Knockin (25m), Darnhall (25m), Jodrell-MK2 (25m), Jodrell-Lovell (76m) and Tabley (25m) | ||||
The MERLIN array consisted of seven antennas, all located in England (U.K.) (Table 1). The maximum and minimum baselines of the array were 1.2 M and 37 k, respectively. All telescopes recorded right and left circular polarizations, excepting Cambridge which was participating also as part of the EVN array and could not record both hands due to bandwidth limitations in the radio link transporting the signal from each MERLIN antenna to the correlator in Jodrell Bank. The data were edited and amplitude calibrated at Jodrell Bank using standard procedures based on the OLAF package (Muxlow et al. muxlow (1988)). Flux density calibration of the MERLIN data was performed by comparison of 1144+402 and OQ 208 with the primary flux calibrator 3C 286. The pipeline developed at Jodrell Bank was used as a first approach for the phase calibration. The data were then exported to the Difmap package, where we performed several cycles of self-calibration.

The independently self-calibrated data from the EVN and MERLIN were combined using the AIPS package. The different calibration procedures applied to each data set resulted in a slight () misalignment in the flux density scales of each interferometer. The antennas in Cambridge and Jodrell Bank (Lovell) participated simultaneously in the EVN and the MERLIN observations, defining a common baseline for the two arrays which we used to match the flux density scales. Since MERLIN is more sensitive to extended radio emission which is resolved by the EVN and it makes use of primary flux density calibrators during the calibration process, we adjusted the EVN data to match the MERLIN flux density scale.
3C 264 was also observed at 1.6, 5.0, 22.5 and 43.3 GHz with the VLA in its most extended configuration (VLA-A) on September 6th 1999. The observing bandwidth was 50 MHz at 1.6 GHz and 100 MHz at the other three frequencies. The whole VLA (27 antennas) participated in the 1.6 and 5.0 GHz observations. Only 13 antennas had 43 GHz receivers at the time of the observations, so the array was split in two, with these 13 antennas observing at 43 GHz and the remaining 14 observing simultaneously at 22 GHz. At 1.6 and 5.0 GHz, the radio sources 3C 147 and 3C 138 were used as primary calibrators, and the nearby radio source J1158+248 as interferometric phase calibrator. At 22.5 and 43.3 GHz, 3C 286 was used as primary calibrator, and we used the fast switching mode during the observations to reduce tropospheric phase fluctuations at 43 GHz. The nearby radio source J1150+243 was used as a phase calibrator. Moreover, the radio source J1159+292 was observed regularly at 8.4 GHz during the observations to improve the pointing accuracy of the interferometer at 22 and 43 GHz. The processes of self-calibration and imaging of the data were carried out with the NRAO AIPS package and/or Difmap following standard procedures.
3 Results
3.1 Results at 1.6 GHz
Images of 3C 264 at 1.6 GHz made with the VLA, MERLIN and the EVN, illustrating the very different linear scales sampled by each interferometer separately, are displayed in Fig. 1. The VLA map shows a strong core and a wiggling jet directed toward the northeast. It confirms the existence of a weak counterjet in southwest direction. Moreover, it shows also the halo-like diffuse and extended emission which surrounds both, the jet and counterjet. The map obtained with MERLIN shows the jet of 3C 264 up to from the core, where it starts its curvature toward the northwest as observed with the VLA. The jet is broad and well resolved transversally, with a width at zero intensity reaching ( pc) at about from the core. MERLIN detects significant polarized flux in the jet up to a distance of from the core with a mean degree of polarization of . The E-vector is oriented perpendicularly to the jet ridge line (position angle, P. A. ), with a rotation to P. A. = at from the core. The EVN map shows a core-jet parsec scale structure, starting at P. A., slightly different from that observed at larger scales (P. A.). Several blobs of emission can be distinguished in the parsec-scale jet, the most remarkable one at 53.7 mas from the core and with a flux density of 4 mJy (labeled 3 in Fig. 2).


In order to obtain a quantitative description of the parsec scale structure of 3C 264 which could be readily compared with future VLBI observations, we have fitted simple elliptical Gaussian components to the VLBI visibility data using a least square algorithm within Difmap. Six components were required to satisfactorily reproduce the data. The estimated parameters for each component are given in Table 2. In Fig. 2 we show the EVN map obtained after several iterations of model-fit and self-calibration, with the model in Table 2 superimposed.
| Comp. | S | D | P.A. | L | r | |||||||
| (mJy) | (mas) | (deg) | (mas) | (deg) | ||||||||
| Core | 126. | 2 | 0. | 0 | 0. | 0 | 0. | 38 | 1. | 00 | – | |
| 1 | 23. | 3 | 9. | 29 | 23. | 0 | 3. | 16 | 1. | 00 | – | |
| 2 | 18. | 6 | 23. | 12 | 31. | 4 | 60. | 55 | 0. | 10 | 27. | 5 |
| 3 | 4. | 0 | 53. | 69 | 34. | 7 | 1. | 59 | 1. | 00 | – | |
| 4 | 11. | 9 | 102. | 53 | 31. | 9 | 44. | 22 | 0. | 23 | 32. | 7 |
| 5 | 7. | 3 | 192. | 31 | 34. | 4 | 28. | 81 | 0. | 68 | 5. | 9 |
| a Symbols used are: (S) flux density; (D) the angular distance from the core component; (P.A.) the position angle with respect to the core; (L) the length of the major axis; (r) the ratio between the major and minor axis; () the orientation of the major axis defined in the same sense as the P. A. | ||||||||||||
The advantage of combining two interferometers like MERLIN and the EVN resides in that it is possible to obtain structure information at angular resolutions intermediate to those provided by each instrument alone. In Fig. 3 we present three selected maps of 3C 264 obtained from the combined MERLIN + EVN data set. Sensitivity to emission at different scales is obtained by applying the appropriate weighting schemes to the combined visibility data during the mapping process, this allows the mapping of the radio structure of 3C 264 with angular resolutions spanning the range 6 mas to 180 mas. The maps in Fig. 3 show the detailed structure of the jet of 3C 264 in its first kiloparsec length.
3.2 Results at 5.0 GHz
Fig. 4 displays the VLA-A image of 3C 264 made at 5 GHz,
with an angular resolution of . We can neatly follow the
curvature in the kiloparsec scale jet up to a distance of
17′′ from the core. We detect the blob of emission at from
the core in northeast direction, although at this angular resolution
we find no hints of the low level extended emission. Thanks
to the high sensitivity of the observations, we also detect radio
emission on the counterjet side, up to a distance of from the
core. The structure is faint and resolved transversally. We assume
that this feature contains the true counterjet. The fact that its
shape is not as collimated as expected in a jet is consistent with the
absence of a clear counterjet also in the VLA image at 1.6 GHz (upper
panel in Fig. 1). This might imply that the counterjet has
a large opening angle.
In Fig. 5 we display the total intensity at 5 GHz with vectors representing the polarized flux density (length) and position angle (orientation). The angular resolution of this image is . Most of the polarized emission comes from the unresolved inner jet, where the mean degree of polarization is about 7%. The position angle in this region is different from that observed at 1.6 GHz, possibly due to Faraday rotation. At larger distances, beyond 1” from the core, the jet is well resolved and the image shows that the polarized emission is produced mostly at the jet edges. The degree of polarization here is higher, reaching 15%.
3.3 Results at 22.5 and 43.3 GHz
In Fig. 6 we present the VLA-A images of 3C 264 made at 22.5 and 43.3 GHz. The region shown corresponds approximately to the the dotted box in Fig. 3-left. We detect the jet up to and from the core at 22.5 and 43.3 GHz, respectively, and nothing beyond. At 22.5 GHz we find polarized emission in the jet, with a mean degree of polarization of 22%. The E-vectors are basically perpendicular to the jet ridge-line, except at the observed jet extreme where there is an apparent change in P. A. We also note the detection of polarized flux in the radio core, with a degree of polarization slightly above the 1% level. The polarization P.A. in the jet is not too different from that found at 1.6 GHz, whereas the polarization percentage is about 3 times higher. This can be interpreted as due to Faraday rotation and implies that some P.A. rotation is actually present at 1.6 GHz, but it is not apparent because of the ambiguity. This would also be consistent with the P.A. measured at 5 GHz. A detailed analysis is not possible, since the images have too different angular resolutions, but a rough comparison of the images leads to a rotation measure of about 185 rad/m2.
At 43.3 GHz we find a strong core and a weak jet. Unfortunately, the quality of the data at this frequency was not good, and we were not able to obtain a reliable calibration of the polarization data.
4 Discussion
4.1 Spectrum
The observations at 22 and 43 GHz add new pieces of information on the spectrum of the jet in 3C 264. In Table 3 we display the data presented in Lara et al. (lara99 (1999)), adding new data from our observations. The jet flux density at radio wavelengths has been estimated in AIPS following these authors, that is by measuring the total flux density and then subtracting the integrated flux density of a Gaussian component that fits the core emission. In Fig. 7, we display the broad band spectrum of the jet and determine a radio spectral index666The spectral index is defined so that the flux density from a least squares fitting to the data. The spectrum between radio and optical wavelengths (spectral index of -1.34) is consistent with a synchrotron emission mechanism and the existence of a spectrum break frequency in the infrared.
We also display in Table 3 and Fig. 7 the core flux density determined at radio wavelengths (at 1.5, 5.0, 22.5 and 43.3 GHz) with an angular resolution of 90 mas. We obtain a flat spectral index, with (dashed line in Fig. 7).


| Frequency | Jet Flux | Core Flux | References | |||
| (GHz) | (mJy) | (mJy) | ||||
| 1. | 66 | 130. | 0 | 209. | 0 | 1 |
| 5. | 0 | 78. | 0 | 171. | 0 | 2 |
| 22. | 5 | 29. | 3 | 147. | 2 | 1 |
| 43. | 3 | 20. | 5 | 123. | 8 | 1 |
| 3. | 83 e+5 | 0. | 076 | – | 2 | |
| 4. | 35 e+5 | 0. | 062 | – | 3 | |
| 4. | 46 e+5 | 0. | 049 | – | 2 | |
| 5. | 48 e+5 | 0. | 046 | – | 2 | |
| 24. | 20 e+5 | 0. | 0005 | – | 4 | |
| References for the jet flux density: (1) These data; (2) Lara et al. lara99 (1999); (3) Baum et al. baum2 (1997); (4) Prieto et al. prieto (1996). | ||||||
4.2 Jet velocity and orientation
Assuming that 3C 264 consists of two intrinsically symmetric jets with isotropic emissivity, their velocity, , and orientation with respect to the observer, , can be constrained from the jet to counterjet brightness ratio, (see Giovannini et al. giov94 (1994) for more details). Values of at different distances from the core have been compiled from the literature or derived from our data considering the best available images at different angular resolutions to assure that no jet brightness is missing because of excessive angular resolution or poor sampling of the visibility function. In Table 4 we report values (or limits) for , and the corresponding values (or limits) for from radio and optical images, where we assume a radio jet spectral index and an optical spectral index (Lara et al. lara99 (1999)). The available data at about from the core constrain the angle to be with a velocity c. Starting from from the core we detect also the counterjet in the VLA images which allows the estimation of values for and .
The counterjet detection at 1′′.5 and 2′′ from the core constrains the jet velocity to be c at 600 pc from the core. Therefore, the present results show that the decrease in the jet velocity is slower than estimated in Baum et al. (baum2 (1997)). By comparing our results with the adiabatic model discussed in Baum et al. (baum2 (1997)) we find general agreement assuming an initial jet velocity (, where is the Lorentz factor) and an orientation . A slower initial velocity predicts too low a jet velocity in the range 400 to 600 pc from the core; a smaller value of is not possible for the same reason, while is not allowed from the jet to counterjet brightness ratio (see their Figs. 18a-b).
| Distance | R | Instrument | ∗ | References | |||||
| (′′) | (pc) | (∘) | |||||||
| 0. | 005 | 2. | 1 | 24 | VLBI | 0.56 | 56 | 0.87 | 1 |
| 0. | 01 | 4. | 1 | 18 | VLBI | 0.52 | 59 | 0.81 | 1 |
| 0. | 05 | 20. | 6 | 23 | EVN+MERLIN | 0.55 | 56 | 0.86 | 2 |
| 0. | 10 | 41. | 2 | 16 | EVN+MERLIN | 0.50 | 60 | 0.78 | 2 |
| 0. | 15 | 61. | 8 | 20 | MERLIN | 0.54 | 58 | 0.84 | 1 |
| 0. | 3 | 123. | 6 | 18 | MERLIN | 0.52 | 59 | 0.81 | 1 |
| 0. | 3 | 123. | 6 | 37 | HST | 0.49 | 60 | 0.77 | 1 |
| 0. | 5 | 206. | 0 | 28 | MERLIN | 0.58 | 54 | 0.91 | 1 |
| 0. | 5 | 206. | 0 | 32 | HST | 0.48 | 62 | 0.74 | 1 |
| 0. | 8 | 329. | 6 | 32 | MERLIN | 0.60 | 53 | 0.93 | 2 |
| 1. | 0 | 412. | 0 | 16 | MERLIN | 0.50 | 60 | 0.78 | 2 |
| 1. | 5 | 618. | 0 | 17 | VLA-A | 0.51 | 59 | 0.80 | 2 |
| 2. | 0 | 824. | 0 | 15 | VLA-A | 0.49 | 60 | 0.77 | 2 |
| 2. | 8 | 1153. | 6 | 11 | VLA-A | 0.45 | 64 | 0.69 | 2 |
| 3. | 3 | 1359. | 6 | 5 | VLA-B | 0.31 | 72 | 0.48 | 1 |
| 5. | 0 | 2060. | 0 | 3 | VLA-B | 0.22 | 78 | 0.34 | 1 |
|
∗ is assumed,
except with HST data where a valued of is assumed.
is the estimated jet velocity if References: (1) Baum et al. baum2 (1997); (2) Data in this paper |
|||||||||
4.3 Jet structure
4.3.1 Longitudinal structure
The detailed images at 1.6 GHz of the first kiloparsec of the jet in 3C 264 basically confirm the different regions described by Lara et al. (lara99 (1999)) from observations at 5.0 GHz. A good correspondence between features of the jet is observed at both frequencies. The jet appears very well collimated up to a distance of 200 mas (82 pc) from the core. At this position, the jet undergoes a strong widening, with its edges apparently defining a perfect cone with an opening angle of (see Fig. 3-right). This observed opening angle corresponds to an intrinsic opening angle of (assuming an orientation angle ). The expected velocity for a freely expanding jet and an intrinsic opening angle is (), in good agreement with values reported in Table 4
Lara et al. (lara99 (1999)) find that the brightness distribution of the jet at 5.0 GHz is not continuous between 80 and 300 pc, showing three main “blobs” which might suggest the existence of a helical twist. At 1.6 GHz, the observed structure is also consistent with a possible helical filament embedded in a conical nozzle. At (330 pc) from the core we observe another change of properties: there seems to be a deflection of the jet ridge line northward at this position, and the surface brightness is significantly lower beyond. This distance coincides with the length of the observed jet at 22.5 GHz. Moreover, as previously mentioned, the electric vector at 1.6 GHz changes abruptly at from the core, from P. A. to P. A. . At further distances, the jet as observed at 1.6 GHz remains broad but is again well collimated with a small opening angle.
4.3.2 Transverse structure
In Fig. 8 we present profiles of the surface brightness distribution taken perpendicularly to the jet ridge line at several positions along the jet. The profile at a distance of 100 mas from the core is consistent with a spine brightened jet, with a FWHM of 20 mas (broader than the FWHM of the Gaussian beam used for convolution of the image). At smaller distances from the core, a spine brightened jet is consistent with the VLBI image of 3C 264 (Fig. 1). At distances from the core beyond 300 mas, the profiles become flatter and are no longer indicative of spine brightening, being compatible instead with an edge brightened jet.
The apparent transition from a spine brightened to an edge brightened jet is consistent with a two velocity jet regime. External jet regions are decelerated by their interaction with the interstellar medium and their velocity becomes significantly different from the jet spine velocity. We note that with an orientation of with respect to the observer, a high velocity jet is strongly de-boosted: the Doppler factor is less than 1, becoming smaller for increasing velocities. In this region lower velocity structures are less de-boosted. Therefore the external lower velocity region of the jet appears brighter than the inner high velocity spine and we thus observe a limb-brightened jet structure. Of course, at large distances from the core, where the inner spine is no more strongly relativistic, the Doppler de-boosting is not relevant and we observe again a jet with an uniform brightness distribution while in the inner pc scale regions the jet can appear centrally peaked because of angular resolution limitations or because the two velocity regime has not started yet. We note that the existence of a velocity structure in 3C 264 is also consistent with Chiaberge et al. (chiaberge (2000)), who propose jet velocity structures as a general scenario to reconcile the radio and optical properties of FR Is and BL Lacs with the unification schemes.
The magnetic field observed with MERLIN at 1.6 GHz (Fig. 1) and with the VLA at 22.5 GHz (Fig. 6-left) does not show the distribution expected by the models of jets advancing through the external medium, that is a perpendicular magnetic field associated with the fast spine, and a predominantly parallel magnetic field associated with the shear layer interacting with the external medium (Laing et al. laing (1993); Aloy et al. aloy (2000)). Our results could be explained if most of the polarized emission in 3C 264 comes from the shear layer of the jet, as is effectively observed at larger distances at 5 GHz (Fig. 5).
4.4 Disk or bubble at the center of NGC 3862?
The position where the second important change of properties in the jet of 3C 264 takes place, that is at from the core, is precisely coincident with the radius of the optical ring, as already noted by Baum et al. (baum2 (1997); see Fig. 9). It is not clear from optical studies of the host galaxy of 3C 264, NGC 3862, if this ring defines the boundaries of a face-on flattened disk, or rather of a central bubble. Disk structures are commonly found in the central kpc regions of the host galaxies of FR I radio galaxies (e.g. de Koff et al. dekoff (1995), Martel et al. martel (2000)), strongly supporting the face-on disk scenario in NGC 3862. However, Hutchings et al. (hutchings (1998)) suggest that the ring defines an evacuated region cleared of dust by some nuclear-related process. The analysis of the color excess and gradients inside the ring of NGC 3862 by Martel et al. (martel (2000)) support the existence “of a partially evacuated, inclined, and flattened system surrounded by a red ring”.
From the current optical and radio data it is not possible to discriminate between the face-on disk or the spherical bubble scenario. If we consider the possibility of a face-on disk, the change in the jet properties at the position of the optical ring would be just a coincidence observed in projection on the disk boundary (see Fig. 9). Moreover, that would also imply a closer than inferred orientation of the jet toward the observer, assuming that disks and jets are approximately perpendicular (e.g. Capetti & Celotti capetti1 (1999)). In this context, we note also the claim by Sparks et al. (sparks (2000)), suggesting that optical synchrotron emission is observed only when the jet points toward the observer, based on the fact that 4 out of 5 nearby FR I radio galaxies with optical synchrotron jets present almost circular face-on dust disks. This suggestion assumes a face-on disk scenario and jets perpendicular to the disks. However, they explicitly mention 3C 264 as a peculiar case.
On the other hand, if we consider the possibility of an evacuated spherical bubble in the center of NGC 3862, it would render a natural explanation for the almost perfect circular symmetry of the ring and the change of the radio (and optical) properties of the jet as it crosses the bubble boundary (Baum et al. baum2 (1997); Hutchings et al. hutchings (1998)). Moreover, the observed widening of the jet inside the ring would be consistent with an expansion favored by the lower density medium within the evacuated bubble. This scenario would also be consistent with an orientation of the jet of 3C 264 of the order of with respect to the observer (Sect. 4.2).
5 Conclusions
We present in this paper new observations of the radio source 3C 264 which are sensitive to linear scales ranging from the parsec to several kiloparsecs. Observations at 1.6 GHz were made simultaneously with the EVN and MERLIN in 1997. Observations at 1.6, 5.0, 22.5 and 43.3 GHz were made two years later with the VLA in its most extended configuration. The main conclusions are:
-
1.
The observations confirm the existence of different regions in the jet of 3C 264, as previously found by Lara et al. (lara99 (1999)). The most remarkable feature is the transition between a well collimated narrow jet at distances from the core below 80 pc, to a conical shaped wide jet, with an opening angle of . This transition coincides also with a transition in the transverse structure of the jet, which is consistent with a spine brightened jet in the collimated region and an edge brightened jet in the conical region. This result is also in agreement with the possible presence of jet velocity structure (fast spine surrounded by a slower layer) as found in other FR I sources (e.g. B2 1144+35; Giovannini et al. giov99 (1999)) or Bl Lacs (Mkn 501; Giroletti et al. giroletti (2003))
-
2.
An apparent deflection of the jet ridge line, together with a diminution of the surface brightness and a change in the polarization properties, is present at a distance of pc from the core, strikingly coincident with the radius of a ring observed at optical wavelengths.
-
3.
From observational data we estimate an initial jet velocity and an orientation of the jet with respect to the observer , consistent with previous estimations of these parameters (Baum et al. baum2 (1997)).
-
4.
Our data contribute to a better knowledge of the spectrum of the radio-optical jet of 3C 264. We find a radio spectral index of -0.58 which has to be compared with a spectral index of -1.34 at optical wavelengths. The spectrum between radio and optical wavelengths is consistent with a synchrotron emission mechanism and the existence of a spectrum break frequency in the infrared.
-
5.
The properties of the jet structure, the changes in the polarization angle, and the plausible jet orientation () with respect to the observer can be naturally brought into agreement with the presence of a spherical bubble in the center of NGC 3862, even if the existence of a face on dust and gas disk cannot be completely ruled out.
Acknowledgements.
We thank Dr. Muxlow for his assistance during the MERLIN data reduction process at Jodrell Bank; L.L. acknowledges support by the European Union under contract ERBFMGECT950012. This research is supported in part by the Spanish DGICYT (AYA2001-2147-C02-01). LF and GG acknowledges the Italian Ministry for University and Research (MURST) for financial support under grant Cofin 2001-02-8773. The MERLIN/VLBI National Facility is operated by the University of Manchester on behalf of the Particle Physics and Astronomy Research Council. The European VLBI Network is a joint facility of European, Chinese and other radio astronomy institutes funded by their national research councils. The National Radio Astronomy Observatory is a facility of the National Science Foundation operated under cooperative agreement by Associated Universities, Inc.References
- (1) Aloy, M.A., Gómez, J.L., Ibáñez, J.M., et al. 2000, ApJ, 582, L88
- (2) Baum, S. A., Heckman, T., Bridle, A., et al. 1988, ApJS, 68, 643
- (3) Baum, S. A., O’Dea, C. P., Giovannini, G., et al. 1997, ApJ, 483, 178 (Erratum 492, 854 (1998))
- (4) Bridle, A. H. & Vallée, J. P. 1981, AJ, 86, 1165
- (5) Capetti, A. & Celotti, A. 1999, MNRAS, 304, 434
- (6) Capetti, A., Trussoni, E., Celotti, A. et al. 2000, MNRAS, 318, 493
- (7) Chiaberge, M., Celotti, A., Capetti, A. & Ghisellini, G. 2000, å, 358, 104
- (8) Crane, P., Peletier, R., Baxter, D. et al. 1993, ApJ, 402, L37
- (9) De Koff, S., Baum, S., Sparks, W. B. et al. 1995, BAAS, 187, 1202
- (10) Fanaroff, B. L. & Riley, J. M. 1974, MNRAS, 167, 31
- (11) Gavazzi, G., Perola, C. G. & Jaffe, W. 1981, å, 103, 35
- (12) Giovannini, G., Feretti, L., Venturi, T. et al. 1994, ApJ, 435, 116
- (13) Giovannini, G., Taylor, G. B., Arbizzani, E. et al. 1999, ApJ, 522, 101
- (14) Giovannini, G., Cotton, W. D., Feretti, L., et al. 2001, ApJ, 552, 508
- (15) Giroletti, M., Giovannini, G., Feretti, L., et al., ApJ, in press
- (16) Hutchings, J. B., Baum, S. A., Weistrop, D., et al. 1998, AJ, 116, 634
- (17) Laing, R. A. 1993, in Space Telescope Sci. Inst. Symp. 6: Astrophysical Jets, ed. D. Burgarella, M. Livio & C. P. O’Dea, Cambridge University Press, Cambridge, 95
- (18) Lara, L., Cotton, W. D., Feretti, L., et al. 1997, ApJ, 474, 179
- (19) Lara, L., Feretti, L., Giovannini, G., et al. 1999, ApJ, 513, 197
- (20) Martel, A. R., Turner, N. J., Sparks, W. B., Baum, S. A. 2000, ApJS, 130, 267
- (21) Muxlow, T. W. B., Junor, W., Spencer, R. E., et al. 1988, in IAU Symp. 129: The Impact of VLBI on Astrophysics and Geophysics, ed. M. J. Reid M. J. & J. M. Moran, Kluwer Academic Publishers, 131
- (22) Prieto, M. A. 1996, MNRAS, 282, 421
- (23) Shepherd, M. C., Pearson, T. J., & Taylor, G. B. 1994, BAAS, 26, 987
- (24) Smith, R. J., Lucey, J. R., Hudson, M. J., et al. 2000, MNRAS, 313, 469
- (25) Sparks, W. B., Baum, S. A., Biretta, J. et al. 2000, ApJ, 542, 667