Interaction of Nanoparticles with Radiation
Abstract
Interstellar grains span a wide range of sizes from a few angstroms to a few micrometers. The presence of nanometer-sized or smaller particles in the interstellar medium is indicated directly by the interstellar far ultraviolet (UV) extinction, the ubiquitous 3.3, 6.2, 7.7, 8.6, and 11.3 polycyclic aromatic hydrocarbon (PAH) emission features, the near and mid infrared broadband emission seen in the IRAS 12 and 25 bands and the COBE-DIRBE 3.5, 4.9, 12 and 25 bands, the 10–100 Galactic foreground microwave emission, and indirectly by the heating of interstellar gas. For nanoparticles under interstellar conditions, UV/visible photon absorption is the dominant excitation process. With a heat capacity smaller than or comparable to the energy of an energetic stellar photon, nanoparticles are subject to single-photon heating, followed by vibrational relaxation, photoionization, and photodestruction. With excited electrons spatially confined, semiconductor nanoparticles are expected to luminesce efficiently. This review focuses on the photophysics of nanoparticles with emphasis on the stochastic heating and the vibrational excitation of interstellar PAH molecules, and the excitation of photoluminescence with special attention given to silicon nanoparticles.
Theoretical Astrophysics Program,
The University of Arizona,
Tucson, AZ 85721; agli@lpl.arizona.edu
1. Introduction: Historical Perspectives of Studies of Interstellar Grain Compositions and Sizes
When the existence of solid particles in interstellar space was first convincingly demonstrated by Trumpler (1930) through the discovery of color excess between the photographic (with an effective wavelength ) and visual ( ) magnitudes, the grains were estimated to be , corresponding to radii of (Trumpler 1930). By the end of the 1930s, a extinction law (i.e., the interstellar extinction varied approximately inversely with wavelength ) in the wavelength range 1–3 had been well established (Hall 1937; Stebbins, Huffer, & Whitford 1939). At that time, metallic grains with a dominant size of 0.05 (Schalén 1936) or a power-law size distribution in the size range (Greenstein 1938) were proposed to explain the extinction law, partly because meteoritic particles (predominantly metallic) and interstellar grains were then thought to have the same origin.
In view of the spatial correlation between gas concentration and dust extinction, Lindblad (1935) suggested that interstellar grains were formed by condensation from the interstellar gas through random accretion of gas atoms. However, it was found later that in typical interstellar conditions, the Lindblad condensation theory would result in a complete disappearance of all condensable gases and the grains would grow to sizes (10) well beyond those which would account for the interstellar extinction (see Oort & van de Hulst 1946 and references therein). By introducing a grain destruction process caused by grain-grain collisions as a consequence of interstellar cloud encounters, Oort & van de Hulst (1946) further developed the interstellar condensation idea and led to the “dirty ice” model consisting of saturated molecules such as H2O, CH4, and NH3 with an equilibrium size distribution which could be roughly approximated by a functional form and an average size of 0.15.
The discovery of interstellar polarization (Hall 1949; Hiltner 1949) cast doubts on the “dirty ice” model since ice grains are very inefficient polarizers. This stimulated Cayrel & Schatzman (1954) to consider graphite grains as an interstellar dust component since aligned graphite particles would be a very efficient interstellar polarizer because of their strong optical anisotropy. The “dirty ice” model was also challenged by nondetection of the 3.1 feature of H2O ice outside of molecular clouds (Danielson, Woolf, & Gaustad 1965; Knacke, Cudaback, & Gaustad 1969). This gave the late J. Mayo Greenberg (1922–2001) the incentive to perform the early experiments on the ultraviolet (UV) photoprocessing of low temperature mixtures of volatile molecules simulating the “original” dirty ice grains (Greenberg et al. 1972) to understand how and why the predicted H2O was not clearly present. From such experiments was predicted a new component of interstellar dust in the form of complex organics known as “organic refractories”, containing a mixture of aliphatic and aromatic carbonaceous molecules (Greenberg et al. 2000).
As an alternative to the interstellar condensation process, Hoyle & Wickramasinghe (1962) proposed that graphite particles with radii a few times 0.01 could form in the atmospheres of cool N-type carbon stars, and subsequently be ejected into interstellar space by the stellar radiation pressure, and be responsible for (part of) the interstellar extinction and polarization. The graphite proposal further gained its strength from the prominent 2175 interstellar extinction hump detected by the Aerobee rocket observation (Stecher 1965), which was generally attributed to small graphitic grains (Stecher & Donn 1965), although its exact nature still remains unidentified (Draine 1989, 2003a).
Similarly, Kamijo (1963) first proposed that SiO2 whose size is of the order of 20, condensed in the atmospheres of cool M-type stars and expelled into interstellar space, could serve as condensation nuclei for the formation of “dirty ices”. It was later shown by Gilman (1969) that grains around oxygen-rich cool giants are mainly silicates such as Al2SiO3 and Mg2SiO4. Interstellar silicates were first detected in emission in the Trapezium region of the Orion Nebula (Stein & Gillett 1969); in absorption toward the Galactic Center (Hackwell, Gehrz, & Woolf 1970), and toward the Becklin-Neugebauer object and the Kleinmann-Low Nebula (Gillett & Forrest 1973). Silicates are now known to be an ubiquitous interstellar dust component (see §1 in Li & Draine 2001a for a review).
In the 1960s and early 1970s,
the extension of the extinction curve toward the middle
and far UV () was made possible
by rocket and satellite observations,
including the rocket-based photoelectric
photometry at and 2200
(Boggess & Borgman 1964); the Aerobee Rocket spectrophotometry
at 1200 3000
(Stecher 1965);
the Orbiting Astronomical Satellite
(OAO-2) spectrophotometry at
1100
(Bless & Savage 1972);
and the Copernicus Satellite spectrophotometry at
1000
(York et al. 1973).
By 1973, the interstellar extinction curve had been
determined over the whole wavelength range from
0.2 to 10.
The fact that the extinction continues to increase
in the far UV (e.g., see York et al. 1973)
implies that no single grain type with either a single size or
a continuous size distribution could account for the observed
optical to far-UV interstellar extinction (Greenberg 1973).
This led to the abandonment of any one-component grain models
and stimulated the emergence of various kinds of models
consisting of multiple dust constituents,
including silicate, silicon carbide,
iron, iron oxide, graphite, dirty ice, solid H2, etc.
In 1956 Platt first suggested that very small grains or large molecules of less than 10 in radius grown by random accretion from the interstellar gas could be responsible for the observed interstellar extinction and polarization. Platt (1956) postulated these “Platt” particles as quantum-mechanical particles containing many ions and free radicals with unfilled electronic energy bands. Donn (1968) further proposed that polycyclic aromatic hydrocarbon-like “Platt particles” may be responsible for the UV interstellar extinction.
Greenberg (1968) first pointed out that very small grains with a heat content smaller than or comparable to the energy of a single stellar photon, cannot be characterized by a steady-state temperature but rather are subject to substantial temporal fluctuations in temperature. Under interstellar conditions, grains larger than a few hundred angstroms in radius would attain an equilibrium temperature in the range of 15–25 (Greenberg 1968, 1971; Mathis, Mezger, & Panagia 1983; Draine & Lee 1984; Li & Draine 2001b). This temperature was long thought to be 3 before van de Hulst (1949) made the first realistic estimation of 10–20 for both metallic and dielectric grains.
In a study of the scattering properties of interstellar dust (albedo and phase function) determined from the OAO-2 observations at 1500 of the diffuse Galactic light (Witt & Lillie 1973), Witt (1973) first explicitly suggested a bi-modal size distribution for interstellar grains: large grains with radii would provide extinction in the visible region including scattering which is strongly forward directed, and small particles with radii would dominate the UV region and contribute nearly isotopic scattering.
The presence of “Platt” particles in a dust cloud near M17 was first suggested by Andriesse (1978) based on an analysis of its IR spectral energy distribution which was shown to be characterized by a combination of widely different color temperatures (e.g., the far-IR and near-IR color temperatures are 38 and 150, respectively) and that the 8–20 emission spectrum is similar over a distance of 2′ through the source. Andriesse (1978) argued that the color temperature differences cannot be easily ascribed to a spatial variation of the dust temperature in this cloud, because the cloud profile appears to be independent of the wavelength; instead, “Platt” particles with sizes of 10 exhibiting temperature fluctuations up to 150 plus large grains with an equilibrium temperature of 36 can explain the observed IR spectrum of M17.
In a near-IR (1.25–4.8) photometric and spectrophotometric study of three visual reflection nebulae NGC 7023, 2023, and 2068, Sellgren, Werner, & Dinerstein (1983) discovered that each nebula has extended near-IR emission consisting of emission features at 3.3 and 3.4 and a smooth continuum which can be described by a greybody with a color temperature 1000. They found that the emission spectrum (i.e., the color temperature for the continuum and the 3.3 feature) shows very little variation from source to source and within a given source with distance from the central star. Sellgren (1984) argued that this emission could not be explained by thermal emission from dust in radiative equilibrium with the central star since otherwise the color temperature of this emission should fall off rapidly with distance from the illuminating star; instead, she proposed that this emission is emitted by ultrasmall grains, 10 in radius, which undergo large excursions in temperature due to stochastic heating by single stellar photons.
The presence of a population of ultrasmall grains in the diffuse ISM was explicitly indicated by the 12 and 25 “cirrus” emission detected by the Infrared Astronomical Satellite (IRAS) (Boulanger & Pérault 1988), which is far in excess (by several orders of magnitude) of what would be expected from large grains of 15–25 in thermal equilibrium with the general interstellar radiation field. Subsequent measurements by the Diffuse Infrared Background Experiment (DIRBE) instrument on the Cosmic Background Explorer (COBE) satellite confirmed this and detected additional broadband emission at 3.5 and 4.9 (Arendt et al. 1998).
More recently, spectrometers aboard the Infrared Telescope in Space (IRTS) (Onaka et al. 1996; Tanaka et al. 1996) and the Infrared Space Observatory (ISO) (Mattila et al. 1996) have shown that the diffuse ISM radiates strongly in emission features at 3.3, 6.2, 7.7, 8.6, and 11.3. These emission features, first seen in the spectra of the planetary nebulae NGC 7027 and BD+30o3639 (Gillett, Forrest, & Merrill 1973), have been observed in a wide range of astronomical environments including planetary nebulae, protoplanetary nebulae, reflection nebulae, HII regions, circumstellar envelopes, and external galaxies (see Tielens et al. 2000 for a review). Often referred to as “unidentified infrared” (UIR) bands, these emission features are now usually attributed to free-flying PAH molecules which are vibrationally excited upon absorption of a single UV/visible photon (Léger & Puget 1984; Allamandola, Tielens, & Barker 1985; Allamandola, Hudgins, & Sandford 1999; Draine & Li 2001; Li & Draine 2001b) although other carriers have also been proposed such as carbonaceous grains with a partly aromatic character (e.g., HAC [Duley & Williams 1981, Duley, Jones, & Williams 1990], quenched carbonaceous composite [QCC; Sakata et al. 1992], coal [Papoular et al. 1996], fullerenes [C60; Webster 1993]), and surface-graphitized nanodiamonds (Jones & d’Hendecourt 2000).
Since the late 1970s, various modern interstellar dust models have been developed (see Li & Greenberg 2003, Draine 2004, Dwek et al. 2004 for recent reviews). In general, these models fall into three broad categories:
-
•
The silicate-graphite model – this model consists of two (physically) separate dust components each with a power-law size distribution in the size range (Mathis, Rumpl, & Nordsieck 1977 [hereafter MRN]; Draine & Lee 1984). Modifications to this model were later made by Draine & Anderson (1985), Weiland et al. (1986), Sorrell (1990), Siebenmorgen & Krügel (1992), Rowan-Robinson (1992), Kim, Martin, & Hendry (1994), Dwek et al. (1997), Clayton et al. (2003), and Zubko, Dwek, & Arendt (2003) by including new dust components (e.g., amorphous carbon, carbonaceous organic refractory, and PAHs) and adjusting dust sizes (e.g., deriving dust size distributions using the “Maximum Entropy Method” or the “Method of Regularization” rather than presuming a certain functional form).
Recent developments were made by Draine and his coworkers (Li & Draine 2001b, 2002a, 2002b; Weingartner & Draine 2001a) who have extended the silicate-graphite grain model to explicitly include a PAH component as the small-size end of the carbonaceous grain population. The PAH component, containing of C relative to H, is represented by a log-normal size distribution with and for (see Li & Draine 2001b). Note that with the PAH component added, the size distribution of the larger grains is changed from the simple MRN power-law (see Weingartner & Draine 2001a; Zubko et al. 2003).
-
•
The silicate core-carbonaceous mantle model – originally proposed by Greenberg (1978) in the context of a complex cyclic evolutionary scenario (see Greenberg & Li 1999), this model consists of larger silicate grains coated by a layer of carbonaceous organic refractory material, produced by UV photolysis of ice mixtures which attempts to simulate the physical and chemical processes occurring in interstellar space. The most recent development of this model was that of Li & Greenberg (1997), who modeled the core-mantle grains as 2:1 (the ratio of the length to the diameter) finite cylinders (to account for the interstellar polarization) with a Gaussian size distribution for the mantle and a single silicate core radius and a “cut-off” size . In addition, a PAH component and a population of small graphitic grains are added respectively to account for the far-UV extinction rise plus the “UIR” emission bands and the 2175 extinction hump.
Again, modifications to this model were also made by considering different coating materials (e.g., amorphous carbon, HAC), including new dust type (e.g., iron, small bare silicates), and varying dust size distributions (Chlewicki & Laureijs 1988; Duley, Jones, & Williams 1989; Désert, Boulanger, & Puget 1990; Li & Greenberg 1998; Zubko 1999a). The Duley et al. (1990) model exclusively consists of silicate core-HAC mantle grains with a bimodal size distributions: (1) 43% of the total dust mass in grains which produce the far-UV extinction rise and the 2175 hump through an electronic transition of the OH- ions in low-coordination sites on or within silicate grains, and (2) the remaining dust mass in grains 0.05 with a power-law size distribution. The “UIR” bands were attributed to the thermally isolated aromatic “islands” of HAC material – Duley et al. (1989) postulated that an absorbed stellar photon might remain localized in a single aromatic unit of the grain long enough for the unit to cool by IR vibrational relaxation rather than by transferring the photon energy to the phonon spectrum of the grain.
-
•
The composite grain model – realizing that grain shattering due to grain-grain collisions and subsequent reassembly through agglomeration of grain fragments may be important in the ISM, Mathis & Whiffen (1989) modeled the interstellar grains as composite collections of small silicates, vacuum ( in volume), and carbon of various kinds (amorphous carbon, HAC, organic refractories) with a power-law size distribution in the size range . In addition, a separate small graphite component containing of C is needed to account for the 2175 extinction hump. Wright (1987) argued that a fractal structure would be expected for interstellar grains formed through the coagulation of small grain fragments created from grain disruption caused by supernova shock waves. In view that the relative abundances of refractory elements in the ISM may be as low as 65% of solar (Snow & Witt 1996), Mathis (1996) revised the composite model in order to satisfy the tighter abundance constraints. To optimize the use of the heavy elements, Mathis (1996) derived a vacuum fraction of 45%. The “UIR” emission, which remained unaccounted for in the models of Mathis & Whiffen (1989) and Mathis (1996), was taken into account in Zubko et al. (2003) by including a population of PAH molecules.
It is fair to say that, as can be seen from the above summarizing description of the key contemporary dust models, a consensus on the interstellar dust compositions and sizes is now approaching among various grain models, although the debate in details is still going on and is not expected to disappear in the near future (except that the IR spectropolarimetric observation at 3.4 and 9.7 may allow a direct test of the core-mantle model for interstellar dust; see Li & Greenberg 2002) —
-
•
Regarding the grain chemical composition, the most generally accepted view is that interstellar grains consist of amorphous silicates and some form of carbonaceous materials; the former is inferred from the 9.7 Si–O stretching mode and 18 O-Si-O bending mode absorption features in interstellar regions as well as the fact that the cosmically abundant heavy elements such as Si, Fe, Mg are highly depleted; the latter is mainly inferred from the 2175 extinction hump (and the ubiquitous 3.4 C–H stretching vibrational band) and the fact that silicates alone are not able to provide enough extinction. For the carbonaceous component, a wide range of dust materials have been suggested including amorphous carbon, coal, C60, diamond, graphite, HAC, PAHs, organic refractory, and QCC (see Pendleton 2004 for a review of the carbonaceous component).
-
•
It is also generally accepted that, through the analysis of the wavelength-dependent interstellar extinction and polarization curves as well as the near and mid IR emission, interstellar grain sizes may be separated into two domains – (1) the “large” grain component (with radii ; including the “classical” grains [with ]) which is primarily responsible for the extinction, polarization and scattering at visible wavelengths and the IR emission at ; and (2) the “very small grain” component (with ) which contributes importantly to the extinction in the vacuum-UV and emit strongly in the near and mid IR at (see Figs. 8,16 of Li & Draine 2001b) when transiently heated to high temperatures during quantized absorption events.
While the size distribution for the “classical grain” component is relatively well constrained by fitting the observed interstellar extinction curve for an assumed dust composition, our knowledge of the size distribution for the “very small grain” component is better constrained by the interstellar near and mid IR emission due to the fact that, for , these very small grains are in the Rayleigh limit (1) and their extinction cross sections per unit volume are independent of size, so that the observed UV/far-UV extinction curve () only constrains the total volume of this grain component: , where is the hydrogen column density. In contrast, the near and mid IR intensity is sensitive to the grain heat capacity ( ) which determines the maximum temperature to which the grain can reach when illuminated by a radiation field: where is the absorption cross section for a grain of radius at wavelength (for grains in the Rayleigh limit, ), is the Planck function, is the dust temperature distribution function. Evidently, is a sensitive function of grain size (see Draine & Li 2001, Li & Draine 2001b; and §3, Fig. 6 of this paper).
In the following sections of this review, we will focus on the ultrasmall grain component (), with particular emphasis on the photophysical processes including the stochastic heating and the vibrational excitation of PAH molecules, and the excitation of the photoluminescence of silicon nanoparticles. In astrophysical literature, one frequently encounters terms like “ultrasmall grains”, “very small grains”, “large molecules”, “tiny grains”, and “nanoparticles”; to avoid confusion, we emphasize here that they are synonymous. In the following we will use the term “nanoparticles” – by “nanoparticles” we mean grains of a few angstroms to a few tens of nanometers in radius.
In §2 we summarize the direct and indirect evidence for the existence of nanoparticles in the ISM. The vibrational excitation of nanoparticles is detailed in §3. In §4 we discuss the physics regarding the excitation of photoluminescence. In §5 we present an overview of the nanoparticle species known or proposed to exist in interstellar space. Concluding remarks are given in §6.
2. Nanoparticles in Interstellar Space
The discovery of presolar nanodiamonds (see §5.4) and TiC nanocrystals (see §5.5) in primitive meteorites implies that there must exist such nano-sized species in interstellar space. In addition, as already mentioned in §1, the presence of nanoparticles in the ISM is clearly indicated by —
-
•
(1) The ubiquitous distinctive set of “UIR” emission bands at 3.3, 6.2, 7.7,
8.6, and 11.3. This emission, accounting for 20% of the total power radiated by dust, is closely explained by transiently heated PAHs with an abundance 45 parts per million (ppm) and a log-normal size distribution peaking at 6 (with 100 carbon atoms; see Li & Draine 2001b for details). -
•
(2) The mid-IR emission at . This emission, first discovered by the IRAS broadband photometry at 12 and 25 and later confirmed by the COBE-DIRBE observations, cannot be explained by large grains () heated by the interstellar radiation field to equilibrium temperatures 15–25 since the predicted emission intensities from large grains are smaller than the IRAS 12 and 25 emission intensities by several orders of magnitude. In the diffuse ISM, the emission at accounts for 35% of the total power radiated by dust. It is well recognized that this emission arises from nanoparticles () stochastically heated by single UV/visible photons to temperatures significantly higher than their time-averaged temperatures (see Draine & Li 2001 and references therein). Even at 60, the nanoparticle component contributes 70% of the total emission power of the diffuse ISM detected by the COBE-DIRBE photometers (see Fig. 8 of Li & Draine 2001b).
-
•
(3) To a lesser degree, the far-UV extinction rise. The far-UV interstellar extinction continues to rise up to , and there does not appear to be any evidence of saturation even at this wavelength (see Whittet 2003). Since it is generally true that a grain absorbs and scatters light most effectively at wavelengths comparable to its size (Krügel 2003), we can therefore conclude that there must be appreciable numbers of interstellar grains with (e.g., in the size distribution derived by Weingartner & Draine [2001a], grains smaller than 2 provides of the total surface area, although they contain only of the total dust mass). However, as remarked earlier (see §1), the far-UV extinction curve is not able to tell us the details of the size distribution of the nanoparticle component.
-
•
(4) The “anomalous” Galactic foreground microwave emission in the 10—
100 region. This emission, discovered unexpectedly in recent experiments to study the angular structure in the cosmic background radiation, was found to be positively correlated with interstellar dust, as traced by the 100 IRAS map or the 140 COBE-DIRBE map (see Draine 1999 and references therein). However, the dust thermal emission at microwave frequencies extrapolated from the 100–3000 far-IR emission radiated by large grains in thermal equilibrium with the interstellar radiation field falls far below the observed microwave emission (Draine 1999). This “anomalous” emission also significantly exceeds the free-free emission from interstellar plasma (Draine & Lazarian 1998a). As described by Draine and his coworkers (Draine & Lazarian 1998b; Draine & Li 2003), a number of physical processes, including collisions with neutral atoms and ions, “plasma drag” (due to interaction of the electric dipole moment of the grain with the electric field produced by passing ions), and absorption and emission of photons, can drive nanoparticles to rapidly rotate, with rotation rates reaching tens of GHz. The rotational electric dipole emission from these spinning nanoparticles, the very same grain component required to account for the “UIR” emission and the IRAS 12 and 25 emission, was shown to be capable of accounting for the “anomalous” microwave emission (Draine & Lazarian 1998a,b; Draine 1999). -
•
(5) The photoelectric heating of the diffuse ISM. Grains are long thought to be an important energy source for the interstellar gas through ejection of photoelectrons since (a) photons with energies below the ionization potential of H (13.6) do not couple directly to the gas; and (b) other heating sources such as cosmic rays, magnetic fields, and turbulence are unimportant as a global heating source for the diffuse ISM.
The photoelectric heating starts from the absorption of a far-UV photon by a dust grain, followed by ejection of an electron which then collisionally heats the interstellar gas by transferring (to the gas) the excess energy left over after overcoming the work function (the binding energy of the electron to the grain) and the electrostatic potential of the grain (if it is charged).
In the diffuse ISM, nanoparticles (and in particular, angstrom-sized PAH molecules) are much more efficient in heating the gas than large grains (see Tielens & Peeters 2002 and references therein) since (a) the mean free path of an electron in a solid is just 10 and therefore photoelectrons created inside a large grain rarely reach the grain surface; and (b) the total far-UV absorption is dominated by the nanoparticle component. Recent studies show that grains smaller than are responsible for of the total photoelectric heating of the gas, with half of this provided by grains smaller than 15 (Bakes & Tielens 1994; Weingartner & Draine 2001b).
-
•
(6) The Extended Red Emission (ERE) ? This emission, first detected in the Red Rectangle (Schmidt, Cohen, & Margon 1980), is characterized by a broad, featureless band between 5400 and 9500, with a width and a peak of maximum emission at , depending on the physical conditions of the environment where the ERE is produced. The ERE has been seen in a wide variety of dusty environments: the diffuse ISM of our Galaxy, reflection nebulae, planetary nebulae, HII regions, and other galaxies (see Witt & Vijh 2004 for a review). The ERE is generally attributed to photoluminescence (PL) by some component of interstellar dust, powered by UV/visible photons.
The observational evidence shows that (a) the ERE carriers must have a photon conversion efficiency (the number ratio of PL photons to exciting photons) substantially larger than 10% as estimated from the correlation of ERE intensity with HI column density at high Galactic latitudes (Gordon, Witt, & Friedmann 1998), and (b) the carriers can be easily modified or destroyed by intense UV radiation (Witt 2000). This suggests that the ERE carriers are very likely in the nanometer size range because (a) in general, nanoparticles are expected to luminesce efficiently through the recombination of the electron-hole pair created upon absorption of an energetic photon, since in such small systems the excited electron is spatially confined and the radiationless transitions that are facilitated by Auger and defect related recombination are reduced (see §4); and (b) small nanoparticles may be photolytically more unstable and/or more readily photoionized in regions where the radiation intensity exceeds certain levels of intensity and hardness, and thus resulting in both a decrease in the ERE intensity and a redshift of the ERE peak wavelength, since (i) photoionization would quench the luminescence of nanoparticles, and (ii) the smaller grains would be selectively removed due to size-dependent photofragmentation (Smith & Witt 2002).
Proposed ERE carriers include (a) “classic” submicron-sized carbonaceous materials: HAC (Duley 1985; Witt & Schild 1988), QCC (Sakata et al. 1992), and coal (Papoular et al. 1996); (b) nanometer-sized carbon-based materials: PAHs (d’Hendecourt et al. 1986), and carbon nanoparticles (Seahra & Duley 1999); (c) nanometer-sized silicon-based materials: crystalline silicon nanoparticles (Witt et al. 1998; Ledoux et al. 1998, 2001; Smith & Witt 2002); and (d) particle-bombarded silicate grains (Koike et al. 2002).
The carbon-based models appear to be ruled out: (a) submicron-sized carbon materials appear to be unable to simultaneously match the observed ERE spectra and the required PL efficiency (Witt et al. 1998); (b) although high photoluminescence efficiencies can be obtained by PAHs, the lack of spatial correlation between the ERE and the PAH IR emission bands in some regions (see Li & Draine 2002a and references therein), together with nondetection of ERE emission in reflection nebulae illuminated by stars with effective temperatures (Darbon, Perrin, & Sivan 1999), whereas PAHs emission bands have been seen in such regions (e.g., see Uchida, Sellgren, & Werner 1998) and are expected for the PAH emission model (Li & Draine 2002b), seems to argue against PAHs as ERE carriers; (c) the carbon nano-cluster hypothesis put forward by Seahra & Duley (1999) appears to be invalid as indicated by nondetection in NGC 7023 of the predicted 1 ERE peak (Gordon et al. 2000), although they argued that these carbon nanoparticles with mixed bonding would be able to meet both the ERE profile and the PL efficiency requirements.
The silicon nanoparticle (SNP) model, originally proposed by Witt et al. (1998) and Ledoux et al. (1998), seems promising. Experimental data show that SNPs provide so far the best match to the observed ERE spectra and to the quantum efficiency requirement. However, this model also has difficulty: we calculated the thermal emission expected from such particles, both in a reflection nebula such as NGC 2023 and in the diffuse ISM; we found that SNPs would produce a strong emission feature at 20 which is not seen in the observational spectra; therefore we concluded that if the ERE is due to SNPs, they must be either in clusters or attached to larger grains (see Li & Draine 2002a for details).
3. Excitation of Vibrational Transitions
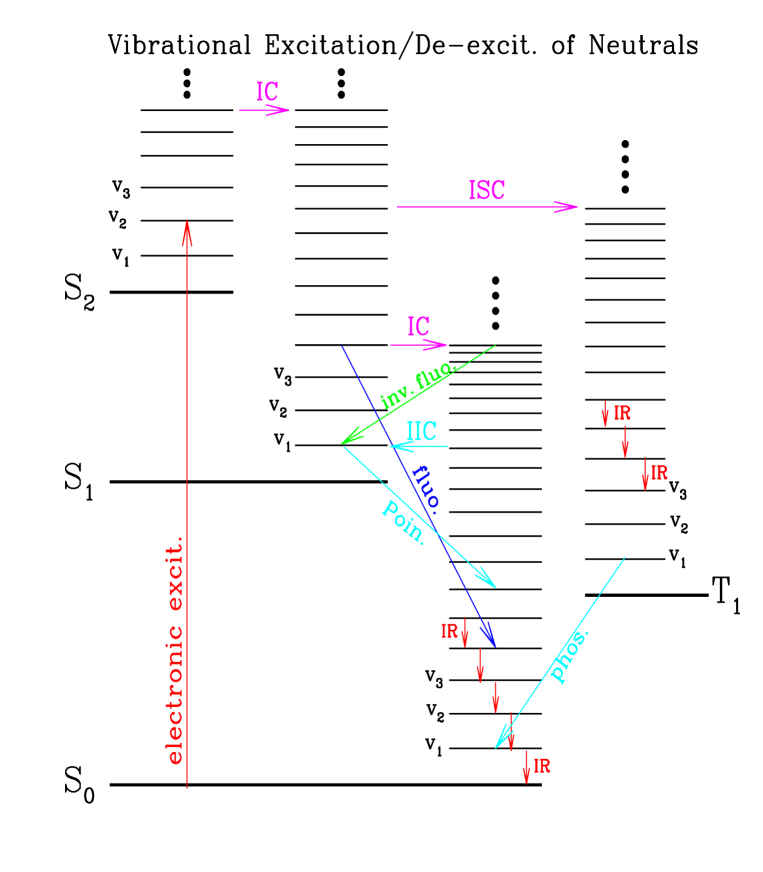
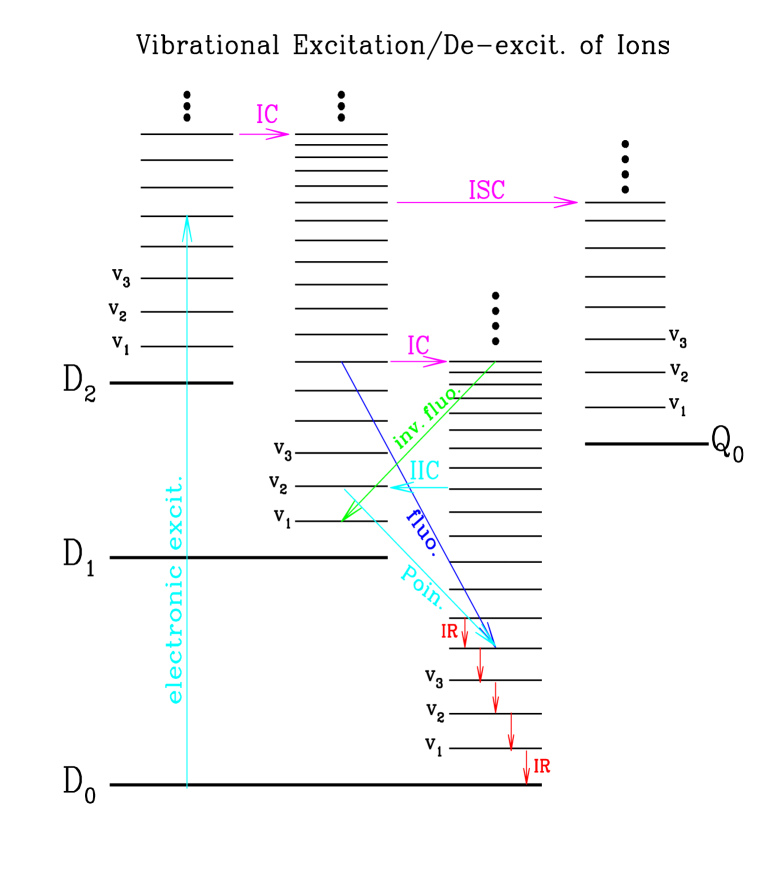
For isolated, free-flying nanoparticles or large molecules in many astrophysical environments, photon absorption is often the dominant excitation process. Prior to the absorption of an energetic photon, a molecule stays at the ground electronic state, which is (the lowest singlet state) for neutrals and (the lowest doublet state) for ions, containing very little vibrational energy. After photoabsorption occurs, the molecule is excited to an upper electronic state for neutrals or for ions (1). The electronically excited molecule has 3 major competing decay channels to relax its energy: radiation, photoionization, and photodissociation. In this section we will focus on the radiation process and use PAHs as an example.
3.1. An Overview of the Photoexcitation and Emission Processes
Once the molecule is electronically excited, both radiative and radiationless transitions will occur between its vibrational modes, electronic and vibrational states (see Birks 1970 for detailed discussions on neutral molecules):
-
•
the molecule will undergo internal vibrational redistribution (IVR), an iso-
energetic radiationless process between vibrational modes, which rapidly (–) spreads the absorbed energy among its vibrational degrees of freedom; -
•
the molecule will undergo internal conversion (IC), a radiationless transition between electronic states of the same multiplicity, which very quickly (–) transfers the electronic energy to a highly vibrationally excited state of the lower lying electronic state (i.e., for neutrals, and for ions where );
-
•
the molecule will also undergo intersystem crossing (ISC), a rapid radiationless transition between electronic states of different multiplicity (i.e., for neutrals, and for ions where );
-
•
the molecule will undergo fluorescence, a radiative electronic transition () between states of the same multiplicity, which results in the emission of a visible photon (i.e., for neutrals, and for ions where ; for many molecules, this transition mainly takes place between the first excited electronic state or and the ground state or , as a consequence of rapid internal conversion which results in a practically complete conversion of the initial excitation energy to vibrationally excited levels of the or and or electronic states);
-
•
the molecule will also undergo phosphorescence with emission of a visible photon, a very slow (a few seconds) radiative electronic transition between states of different multiplicity (i.e., for neutrals where ; for ions, this transition [i.e. ] is not important since internal conversion dominates over intersystem crossing so that the molecule ends up in highly vibrationally excited levels of the ground electronic state [Leach 1987]);
-
•
finally, the molecule will undergo IR emission, a radiative vibrational transition () between higher and lower vibrational states of the same electronic state. This transition mainly takes place in the ground electronic state or because of rapid internal conversion and electronic fluorescence which ultimately drive the molecule down to the ground electronic state with a high vibrational energy, except for some neutral molecules (e.g. chrysene C18H12) a large fraction of this transition occurs in the first excited triplet state as a result of rapid intersystem crossing. Note that in Figure 1 we only plot the v=1 vibrational transitions (where v is the vibrational quantum number) given by the harmonic oscillator selection rule; but overtone transitions with v=2,3,… are also allowed when account is taken of anharmonicity. We should stress that in astrophysical literature, vibrational transitions are sometimes also called “vibrational fluorescence” (e.g. see Allamandola et al. 1989); in this case, we shall call the fluorescence process described above “electronic fluorescence”.
In addition, for highly isolated molecules, there could exist another two radiative energy decay channels – the inverse fluorescence (Leach 1987) and the recurrent fluorescence (Léger, Boissel, & d’Hendecourt 1988). The former results from a transition from a high vibrational level of a lower electronic state to a higher electronic state. The latter, also known as the Poincaré fluorescence, was postulated by Léger et al. (1988) as resulting from an inverse electronic conversion (i.e., the partial conversion of the vibrational energy of the ground electronic state into electronic excitation), followed by emitting a visible photon just like the ordinary (electronic) fluorescence process. However, the Poincaré fluorescence may have a quantum yield larger than one (i.e., several fluorescence photons can be emitted during one photoabsorption event since the molecule can oscillate many times between the electronic ground state and the excited state provided the absorbed energy is high enough; see Léger et al. 1988).
Figures 1 and 2 give a schematic overview of the above-described main processes following the absorption of an energetic photon respectively for a neutral molecule and a molecular cation.
The stochastic heating of ultrasmall grains has been extensively studied in literature (see Draine & Li 2001 and references therein). All studies prior to the identification of PAH molecules as the carrier of the “UIR” bands used the “thermal” approach (i.e., the vibrationally excited grain is described as a system having an internal temperature; see §3.3). The issue of “thermal” versus “non-thermal” arose when Léger and his coworkers used the “thermal” approach to model the vibrational excitation of PAHs to explain the “UIR” bands (Léger & Puget 1984; Léger, d’Hendecourt, & Défourneau 1989), while Allamandola, Tielens, & Barker (1985, 1989) took a statistical approach and questioned the validity of the “thermal” approximation. Barker & Cherchneff (1989), d’Hendecourt et al. (1989), Schutte, Tielens, & Allamandola (1993), and Cook & Saykally (1998) found that the thermal approximation was valid for computing thermal emission spectra. Below we will discuss the recent efforts we took to model the PAH excitation and de-excitation processes (Draine & Li 2001) using both the “exact-statistical” approach (§3.2) and the “thermal-approximation” approach (§3.3).
3.2. “Exact-Statistical” Approach
As discussed in §3.1, in most cases soon after the photoabsorption an isolated nanoparticle (or large molecule) converts almost all of the initial photoexcitation energy to vibrational energy of the highly vibrationally excited ground electronic state, and hence for both neutrals and ions, IR emission is always the dominant deactivation process. Therefore, it is reasonable to model the stochastic heating of a nanoparticle in terms of pure vibrational transitions.
Ideally, if both the vibrational energy levels and the level-to-level transition probabilities were known, we could (at least in principle) solve for the statistical steady-state populations of the different energy levels of grains illuminated by a known radiation field. However, this level of detailed information is generally unavailable, for even the smallest and simplest PAH molecules.
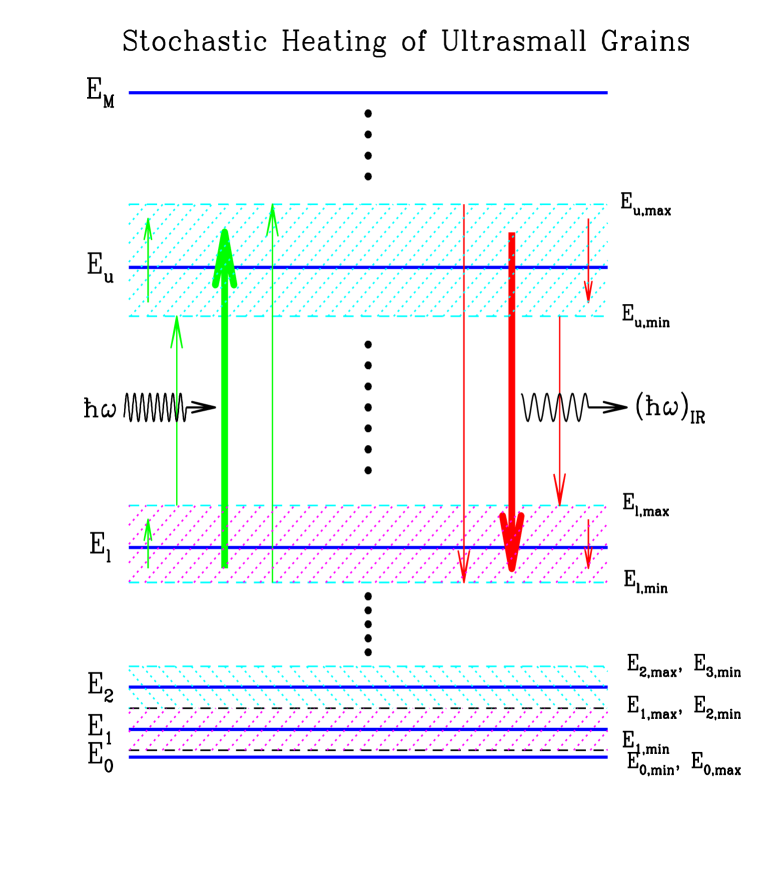
Draine & Li (2001) developed an “exact-statistical” theory for modeling the photoexcitation and emission processes of nanoparticles. In this theory, the state of the grain is characterized by its vibrational energy . Since there are too many vibrational energy levels to consider individually, they are grouped into “bins” , where the -th bin is , with representative energy , and width (see Fig. 3 for illustration). Let be the probability of finding the grain in bin . The probability vector evolves according to for , where the transition matrix element is the probability per unit time for a grain in bin to make a transition to one of the levels in bin . If we define the diagonal elements of to be , then under the steady state condition (i.e. for ) the state probability evolution equation becomes for . Combining this with the normalization condition , we obtain a set of linear equations for the first elements of : for , which we solve using the bi-conjugate gradient (BiCG) method. The remaining undetermined element is obtained by .
For a given starlight energy density , the state-to-state transition rates for transitions can be determined from photon absorptions and photon emissions. The rate for upward transitions is just the absorption rate of photons with such an energy that they excite the grain from bin just to bin . If the bin width is sufficiently small (i.e., if ), the excitation rate is simply for , where is the grain absorption cross section at wavelength = ( is the Planck function and is the speed of light); and , where the integral takes energy absorbed in transitions to levels beyond the highest bin and allocates it to the highest bin (). For the special case of transitions we include “intrabin” absorptions: . Correction for finite bin width, which is important when the treatment is applied to grains with radii , has been made by Draine & Li (2001) by introducing a factor (see Eqs.[15-25] of Draine & Li 2001).
The rates for downward transitions can be determined from a detailed balance analysis of the Einstein coefficient. Similarly, if the bin width is sufficiently small, the de-excitation rate can be approximated as for 1, where the -containing term is the contribution of stimulated emission, and the degeneracies and are the numbers of energy states in bins and , respectively: , where is the vibrational density of states at internal energy , which corresponds to the number of ways of distributing this energy between different modes of this grain. Again, we refer the reader to Draine & Li (2001) for finite bin width corrections as well as “intrabin” radiation consideration (see Eqs.[29-31] of Draine & Li 2001).
It is seen from the above discussions that we require only , the degeneracies , and the starlight spectrum to completely determine the transition matrix . A molecule containing atoms will have distinct vibrational modes (plus 3 translational degrees of freedom and 3 rotational degrees of freedom). If the molecule is approximated as a set of harmonic oscillators, and the frequencies of all normal modes of this molecule are known, we can calculate , the number of distinct vibrational states with total vibrational energy less than or equal to , using the Beyer-Swinehart algorithm (Beyer & Swinehart 1973; Stein & Rabinovitch 1973). So far, the frequencies of these normal modes have been computed only for a small number of PAHs, with some frequencies determined experimentally, but mode spectra are not yet available for most PAHs of interest.
Since exact densities of states are often unknown for interstellar PAHs, the Whitten & Rabinovitch (1963) approximation, a semi-empirical expression, has been extensively used in literature: / where is the density of states (the number of accessible vibrational states per unit energy) at internal energy , is the total zero point energy of the molecule, is the vibrational frequency, and 01 is an empirical correction factor.
In contrast, the Draine & Li (2001) “exact-statistical” theory does not need this approximation; instead, they calculate the “theoretical” mode spectrum from the Debye model. A PAH molecule containing C atoms and H atoms is treated by Draine & Li (2001) as having 5 different types of vibration: (1) () out-of-plane C–C modes at given by a two-dimensional Debye model with a Debye temperature , where is the Boltzmann constant, (2) in-plane C–C modes at given by a two-dimensional Debye model with a Debye temperature , (3) out-of-plane C–H bending modes at , (4) in-plane C–H bending modes at , and (5) C–H stretching modes at . The “synthetic” mode spectrum for C24H12 is in excellent agreement with the actual mode spectrum of coronene (see Fig. 1 of Draine & Li 2001). Similarly, a silicate grain containing atoms is treated as having vibrational modes distributed according to a two-dimensional Debye model with a Debye temperature , and modes described by a three-dimensional Debye model with .
From the “synthetic” model mode spectrum we can obtain the vibrational density of states and hence the “degeneracy” , the number of distinct quantum states included in bin . We note that the densities of states computed for C24H12, using both the actual normal mode spectrum for coronene and the model normal mode spectrum for C24H12 (see Fig. 1 of Draine & Li 2001) are essentially identical for (see Fig. 4 of Draine & Li 2001). With derived from the model mode spectrum, and the () excitation rates calculated from a known radiation field with energy density , we can determine the () de-excitation transition rates . Solving the steady-state state probability evolution equation for , we are able to obtain the steady-state energy probability distribution and calculate the resulting IR emission spectrum.
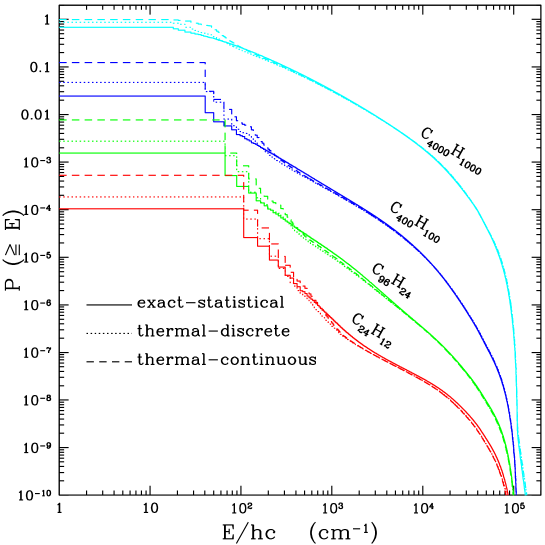
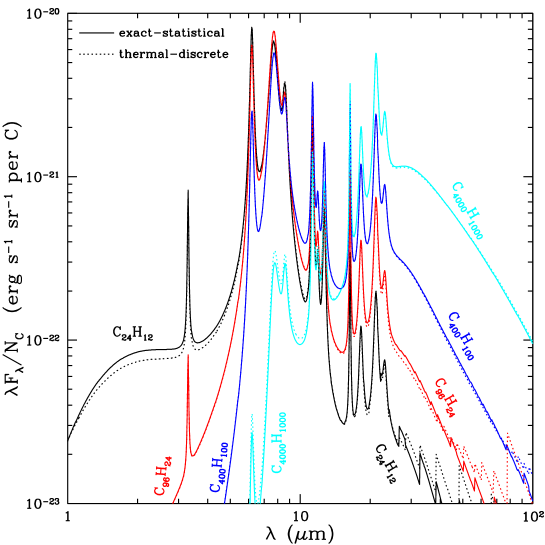
In Figure 4 we present the cumulative energy probability distributions for selected PAHs excited by the general solar neighbourhood interstellar starlight radiation field (ISRF) of Mathis, Mezger & Panagia (1983, hereafter MMP) obtained from the “exact-statistical” model. It is seen in Figure 4 that the probability of being in the ground state is very large for small grains: for example, for the MMP radiation field, grains with spend most of their time at . The sharp drop at 13.6 eV ( cm-1) is due to the radiation field cutoff at 912 Å and to the fact that multiphoton events are rare. The resulting IR emission spectra are displayed in Figure 5. The sawtooth features seen at long wavelengths are due to our treatment of transitions from the lower excited energy bins to the ground state and first few excited states (see §5.1 and Appendix B of Draine & Li 2001).
3.3. “Thermal” Approach
Given (1) the Debye model assumption about the vibrational mode spectrum, (2) the assumption that the absorption cross section depends only on the photon energy, and (3) the assumption of rapid internal vibrational redistribution, the “statistical” approach described in §3.2 is “exact”. It is often desirable, however, to use an alternative “thermal” approximation which is less computationally demanding, since the vibrational density of states is a steeply-increasing function of the vibrational energy (see Fig. 4 of Draine & Li 2001), and for large molecules the number of states is often too large to be tractable even when is small.
The only difference between the “thermal” approach and the “statistical” approach concerns the calculation of the downward transition rates which, in contrast to the “exact-statistical” treatment (see §3.2), uses the notion of “grain temperature”: instead of using degeneracies and , the thermal approach replaces by , where is the “temperature” of the upper level ; i.e., the thermal approach assumes that the emission from a molecule with vibrational energy and atoms can be approximated by the average emission of a system containing vibrating harmonic oscillators, each with a fundamental frequency , connected to a heat bath with temperature such that the expectation value of the energy of the vibrational system would be . When the number of modes is large, this summation contains many terms. Therefore, we take the Debye model discussed in §3.2 for silicate grains and the C–C modes of PAHs to estimate the grain “temperature” associated with internal energy .
So far, the grains are assumed to undergo “discrete cooling”; i.e., the grains make discrete transitions to energy levels by emission of single photons. There are substantial computational advantages (Guhathakurta & Draine 1989; Draine & Li 2001) if the cooling of the grains is approximated as continuous rather than discrete, so that the only downward transition from a level is to the adjacent level (i.e. for ). We refer to this as the “thermal continuous” cooling approximation.
In Figure 4 we also plot the cumulative energy probability distributions for selected PAHs excited by the MMP ISRF obtained from the thermal-discrete model, and the thermal-continuous model. It is seen that the energy distributions found using the thermal-discrete model and the thermal-continuous model are both in good overall agreement with the results of the exact-statistical calculation. The IR emission spectra obtained from the thermal-discrete model, as shown in Figure 5, are almost identical to those of the exact-statistical model. The thermal-continuous cooling model also results in spectra which are very close to those computed using the exact-statistical model (not shown here; see Figs. 14,15 of Draine & Li 2001).
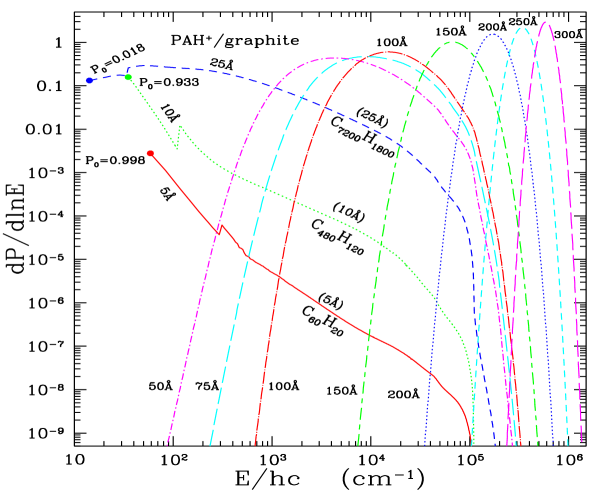
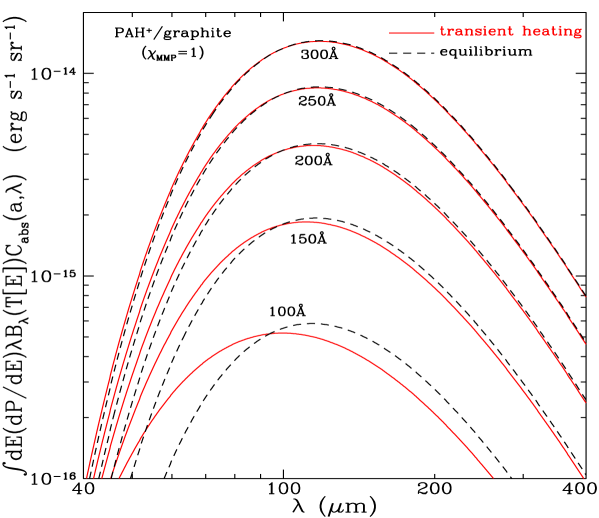
Figure 6 shows the energy probability distribution functions found for PAHs with radii Å illuminated by the general ISRF. It is seen that very small grains () have a very broad , and the smallest grains () have an appreciable probability of being found in the vibrational ground state . As the grain size increases, becomes narrower, so that it can be approximated by a delta function for . However, for radii as large as =, grains have energy distribution functions which are broad enough that the emission spectrum deviates noticeably from the emission spectrum for grains at a single “steady-state” temperature , as shown in Figure 7. For accurate computation of IR emission spectra it is therefore important to properly calculate the energy distribution function , including grain sizes which are large enough that the average thermal energy content exceeds a few eV.
4. Excitation of Photoluminescence
Many materials are capable of emitting visible luminescence when subjected to some form of excitation such as UV light (photoluminescence), nuclear radiation such as rays and and particles (scintillation), mechanical shock (triboluminescence), heat (thermoluminescence), chemical reactions (chemiluminescence), and electric fields (electroluminescence). In this section we will restrict our attention to photoluminescence, since the interstellar dust luminescence, as manifested by the Extended Red Emission ubiquitously seen in interstellar environments, is believed to be a photon-driven process (Witt & Schild 1985; Duley 1985; Smith & Witt 2001; Witt & Vijh 2004).
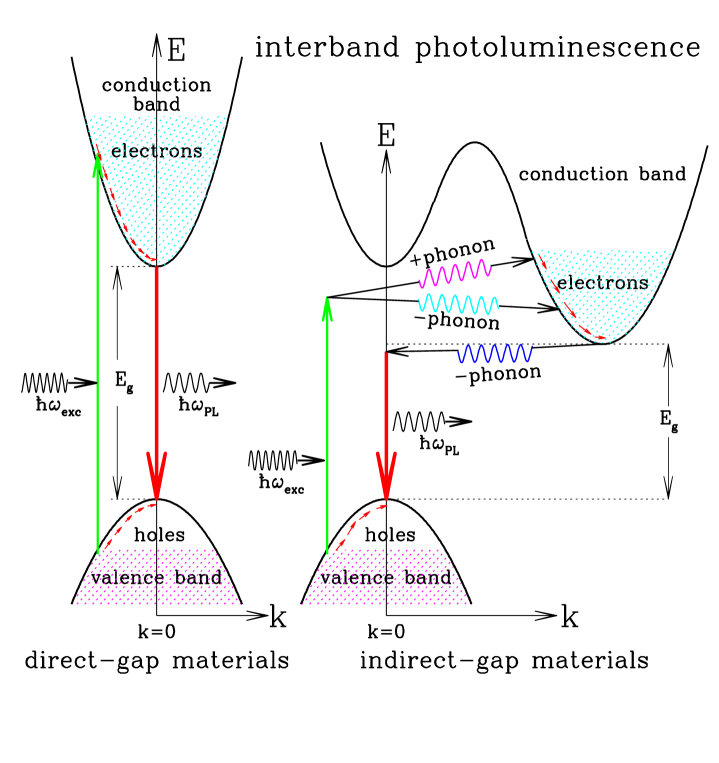
There are two pre-requisites for luminescence: (1) the luminescent material must have a semiconductor structure with a nonzero band gap (e.g. metals do not luminesce since they have no band gap); (2) energy must be imparted to this material before luminescence can take place. The mechanism of photoluminescence in semiconductors is schematically illustrated in Figure 8, which plots the – diagrams for a direct band gap material (left) and an indirect gap material (right), where and are respectively the kinetic energy and wave vector (or “momentum vector”) of the electron or hole (, where is the Planck constant divided by 2, and is the electron or hole effective mass). The direct and indirect gap materials are distinguished by their relative positions of the conduction band minimum and the valence band maximum in the Brillouin zone (the volume of space containing all the values of up to where is the unit lattice cell dimension). In a direct gap material, both the conduction band minimum and the valence band maximum occur at the zone center where . In an indirect gap material, however, the conduction band minimum does not occur at , but rather at some other values of which is usually at the zone edge or close to it (see Fox 2001).
Upon absorption of an UV or visible photon with an energy exceeding the band gap (the gap in energy between the valence band and the conduction band) of the material, an electron-hole pair is created and the electron (hole) is excited to states high up in the conduction (valence) band (see Fig. 8).
During a photon absorption process in semiconductors, we must conserve both energy and momentum. In a direct band gap material, the conduction band minimum and the valence band maximum have the same values (i.e., , where and are respectively the wave vectors of the initial and final electron states; this implies that the electron wave vector should not change significantly during a photon absorption process), conservation of momentum is guaranteed for the photoexcitation of the electron which only involves a UV or visible photon: , since , the wave vector of the absorbed photon (which is in the order of ), is negligible compared to the electron wave vector (which is related to the size of the Brillouin zone , where the unit cell dimension is in the order of a few angstroms). This implies that in a direct band gap material, the electron wave vector does not change significantly during a photon absorption process. We therefore represent photon absorption processes by vertical arrows in the – diagrams (see Fig. 8).
In contrast, for an indirect band gap material of which the conduction band minimum and the valence band maximum have different values (see Fig. 8), conservation of momentum implies that the photon absorption process must be assisted by either absorbing or emitting a phonon (a quantum of lattice vibration), because the electron wave vector must change significantly in jumping from the valence band in state (,) to a state (,) in the conduction band, and the absorption of a photon alone can not provide the required momentum change since .
The excited electron and hole will not remain in their initial excited states for very long; instead, they will relax very rapidly () to the lowest energy states within their respective bands by emitting phonons. When the electron (hole) finally arrives at the bottom (top) of the conduction (valence) band, the electron-hole pair can recombine radiatively with the emission of a photon (luminescence), or nonradiatively by transferring the electron’s energy to impurities or defects in the material or dangling bonds at the surface.
Just like the photon absorption process discussed above, the electron-hole recombination in a direct band gap material does not involve any phonons since there is no need for momentum change for the electron. In contrast, in an indirect gap material, the excited electron located in the conduction band needs to undergo a change in momentum state before it can recombine with a hole in the valence band; conservation of momentum demands that the electron-hole recombination must be accompanied by the emission of a phonon, since it is not possible to make this recombination by the emission of a photon alone. Compared to the photon absorption process in an indirect gap material for which conservation of momentum can be fulfilled by either absorption or emission of a phonon, in the electron-hole recombination process phonon absorption becomes negligible, whereas phonon emission becomes the dominant momentum conservation mediator because (1) the number of phonons available for absorption is small and is rapidly decreasing at lower temperatures, whereas the emission of phonons by electrons which are already at a high-energy state is very probable; and (2) an optical transition assisted by phonon emission occurs at a lower photon energy than the gap energy, whereas phonon absorption results in a higher photon energy of at least , which can be more readily re-absorbed by the semiconductor nanoparticle. But we note that the energy of a phonon () is just in the order of , much smaller than the energy of the electron-hole recombination luminescence photon. Also because prior to the recombination, the electrons and holes respectively accumulate at the bottom of the conduction band and the top of the valence band, the energy separation between the electrons and the holes approximately equals to the energy of the band gap. Therefore, the luminescence emitted by both types of semiconductors occurs at an energy close to the band gap .
The PL efficiency is determined by the competition between radiative and nonradiative recombination. For an indirect gap material, the PL process, which requires a change in both energy and momentum for the excited electron and hence involves both a photon and a phonon, is a second-order process with a long radiative lifetime (), and therefore a relatively small efficiency because of the competition with nonradiative combination. In contrast, in a direct gap material, the emission of a PL photon does not need the assistance of a phonon to conserve momentum. Therefore, the PL process in a direct gap material is a first-order process with a much shorter radiative lifetime () and a much higher PL efficiency in comparison with an indirect gap material.
However, for particles in the nanometer size domain, we would expect substantial changes in both the efficiency and the peak energy of the photoluminescence due to the quantum confinement effect. This can be understood in terms of the Heisenberg uncertainty principle. Unlike in bulk materials the electrons and holes are free to move within their respective bands in all three directions, in nanoparticles the electrons and holes are spatially confined and hence their motion is quantized in all three dimensions. The spatial confinement of a particle of mass to a region in a given direction (say, along the axis) of length would introduce an uncertainty in its momentum and increase its kinetic energy by an amount . A simple particle-in-a-box analysis, using the Schrödinger’s equation and the effective mass approximation, shows that the ground state quantum confinement energy would be , where is the reduced effective mass of the electron-hole pair ( and are respectively the effective mass of the electron and hole) (Fox 2001). For nano-sized particles, the quantum confinement effect becomes significant since the confinement energy would be comparable to or greater than their thermal energy at the temperature range expected for nanoparticles in the diffuse ISM (see Figs. 7,8 of Draine & Li 2001 and Fig. 3 of Li & Draine 2002a). For example, a silicon grain with and ( is the free electron mass) smaller than 8 would exhibit quantum effects at a temperature 100 (which is expected for nano-sized silicon dust in the diffuse ISM; see Fig. 3 of Li & Draine 2002a) with . More detailed studies show that silicon nanocrystals exhibit an gap-size dependence: , where is the bulk silicon band gap (Delerue, Allan, & Lannoo 1993). For nanodiamonds, an gap-size dependence was derived from the X-ray absorption spectrum measurements (Chang et al. 1999; also see Raty et al. 2003): , where is the bulk diamond band gap.
It is apparent, therefore, the quantum confinement effect would lead to a progressive widening of the band gap of a nano-sized semiconductor as its size is reduced, along with a broadening of the electron-hole pair state in momentum space (i.e. an increased overlap between the electron and hole wavefunctions), and a decreasing probability for the pair to find a nonradiative recombination center, provided that the surface dangling bonds are passivated which would otherwise act as traps for the carriers and quench the PL. While the former would shift the PL peak to higher energies, the latter two effects would greatly enhance the electron-hole radiative recombination probability and result in a higher PL efficiency. This is one of the main reasons why silicon nanocrystals are proposed recently by Witt and his coworkers (Witt et al. 1998, Smith & Witt 2001) and by Ledoux et al. (1998, 2001) as the ERE carrier since they are capable of luminescing very efficiently (with essentially 100% quantum efficiency) in the energy range (1.4–2.4) over which the ERE has been observed in astronomical sources, while bulk silicon, an indirect gap semiconductor with a band gap of 1.17 at , does not luminesce.
5. An Overview of Interstellar Nanoparticle Species
5.1. Nano Carbon Grains: Polycyclic Aromatic Hydrocarbon Dust
As the most abundant interstellar nanoparticle species, nano carbon grains (mainly PAHs), containing 15% of the interstellar C abundance (Li & Draine 2001b), reveal their presence in the ISM by emitting a prominent set of “UIR” bands at 3.3, 6.2, 7.7, 8.6, and 11.3 (see §1 and §2). Modern research on astrophysical PAHs started in the mid 1980s with the seminal studies of Léger & Puget (1984) and Allamandola et al. (1985) who by the first time explicitly proposed PAH molecules as the “UIR” band carrier. The PAH model is now gaining increasing acceptance because of (1) the close resemblance of the “UIR” spectra (frequencies and relative intensities) to the vibrational spectra of PAH molecules (see Allamandola & Hudgins 2003 for a recent review); (2) the ability of a PAH molecule to emit efficiently in the “UIR” wavelength range following single photon heating (Léger & Puget 1984; Allamandola et al. 1985, 1989; Draine & Li 2001; also see §3); and (3) the success of the PAH model in quantitatively reproducing the observed mid-IR spectra of the Milky Way diffuse ISM (Li & Draine 2001b), the quiescent molecular cloud SMC B1#1 in the Small Magellanic Cloud (Li & Draine 2002c), and the “UIR” band ratios for a wide range of environments ranging from reflection nebulae, HII regions, photodissociation regions, molecular clouds in the Milky Galaxy to normal galaxies, starburst galaxies, and a Seyfert 2 galaxy (Draine & Li 2001).
Recently, the PAH model further gained its strength from a close fit to the observed “UIR” bands of , a UV-poor reflection nebula, which was considered as one of the major challenges to identification of the “UIR” bands with PAH molecules (see Uchida, Sellgren, & Werner 1998), since small, neutral PAH molecules have little or no absorption at visible wavelengths and therefore require UV photons for excitation. Li & Draine (2002b) have shown that the “astronomical” PAH model, incorporating the experimental result that the visual absorption edge shifts to longer wavelength upon ionization and/or as the PAH size increases (see Appendix A2 of Li & Draine 2002b and references therein), can closely reproduce the observed IR emission bands of this reflection nebula, and is also able to account for the observed dependence of the 12 IRAS emission on the effective temperature of the illuminating star (Sellgren, Luan, & Werner 1990).
Henning & Schnaiter (1998) suggested that nano-sized hydrogenated carbon grains may be responsible for the 2175 extinction hump as well as the 3.4 C–H absorption feature. But this seems to be in conflict with the detection of the 3.4 feature in regions where the 2175 hump is not seen, e.g., along the sightline toward HD 204827 (Valencic et al. 2003) and the Taurus cloud (Whittet et al. 2003).
Kroto et al. (1985) first proposed that C60 could be present in the ISM with a considerable quantity. This molecule and its related species have later been proposed as the carriers of the 2175 extinction hump, the diffuse interstellar bands (DIBs), the “UIR” bands, and the ERE (see Webster 1993 and references therein). Foing & Ehrenfreund (1994) attributed the two DIBs at 9577 and 9632 to C. However, attempts to search for these molecules in the UV and IR were unsuccessful (Snow & Seab 1989; Somerville & Bellis 1989; Moutou et al. 1999; Herbig 2000). These molecules were estimated to consume at most 0.7 carbon (Moutou et al. 1999). Therefore, C60 is at most a minor component of the interstellar dust family.
5.2. Nano Silicate Grains
If nano silicate grains are present in the ISM, single-photon heating by starlight (see §3) will cause these grains to radiate in the 10 feature (see, e.g., Draine & Anderson 1985, Li & Draine 2001a). The absence of a 10 emission feature in IRAS spectra led Désert et al. (1986) to conclude that not more than 1% of Si could be in silicate grains, and on this basis recent grain models (see Li & Draine 2001a and references therein) have excluded silicate nanoparticles as a significant grain component. Nondetection of the 10 silicate emission feature in the diffuse ISM by ISO (Mattila et al. 1996) and the IRTS (Onaka et al. 1996) appeared to confirm this conclusion.
However, the presence of nano silicate grains can not be ruled out since the 10 silicate emission feature may be hidden by the dominant PAH features. Li & Draine (2001a) have placed quantitative upper limits on the abundances of both amorphous and crystalline silicate nanoparticles by calculating spectra for such tiny grains heated by starlight, and comparing to measurements of the IR emission of the diffuse ISM by IRTS (Onaka et al. 1996) and by the DIRBE instrument on the COBE satellite. The interstellar extinction curve and the 10 silicate absorption profile are also invoked to provide further constraints. It was found that, contrary to previous work, as much as 10% of interstellar Si could be in silicate grains without violating observational constraints, and not more than 5% of the Si can be in crystalline silicates (of any size).
5.3. Nano Silicon Grains
The presence of a population of silicon nanoparticles containing of the total interstellar dust mass (with Si/H ) in the ISM was proposed by Witt and his coworkers (Witt et al. 1998, Smith & Witt 2002) and Ledoux et al. (1998) to account for the ERE phenomenon. Witt et al. (1998) suggested that the formation of interstellar SNPs could occur as a result of the nucleation of SiO molecules in oxygen-rich stellar outflows, followed by annealing and phase separation into an elemental silicon phase in the core and a passivating mantle of SiO2. The SiO2 mantle is crucial for the SNP model since SNPs luminesce efficiently only when their surface dangling Si bonds are passivated.
The SNP model is recently receiving much attention because (1) as a consequence of quantum confinement (see §4), the SNP photoluminescence provides so far the best match to the observed ERE in both spectral profile (i.e. peak position and width) and the required extremely high quantum efficiency; (2) as shown by Smith & Witt (2002) in terms of a SNP photoionization and photofragmentation theory together with the experimentally established fact that photoionization quenches the PL of SNPs, this model successfully reproduces the observed dependences of the ERE intensity, the ERE quantum efficiency, and the ERE peak wavelength on the intensity and hardness of the UV/visible radiation fields of a wide variety of dusty environments; (3) as already mentioned in §2, other candidate materials all fail to simultaneously satisfy the ERE spectral characteristics and the high quantum efficiency requirement; it is worth noting that HAC, the long-thought ERE candidate, also falls in this category: HAC luminesces efficiently only in the near UV (quantum efficiencies as high as 10% have been reported; see Rusli, Robertson, & Amaratunga 1996 and references therein) when it has a higher degree of hydrogenation (indicating a larger band gap), dehydrogenation is expected to reduce the band gap and thus can redshift the PL peak into the wavelength range where the ERE is observed, but this results in an exponential drop in its PL efficiency by a factor of .
As already mentioned in §2, although the SNP model seems very attractive, it also has some weakness: it has been shown by Li & Draine (2002a) that SNPs with oxide coatings, if they are free-flying in the ISM, would emit strongly in the 20 O-Si-O bending band. Existing COBE-DIRBE 25 photometry appears to already rule out such high abundances of SNPs. If SNPs are responsible for the ERE from the diffuse ISM, they must either be in clusters, or attached to larger “host” grains. This problem can not be resolved by invoking hydrogen passivation of SNPs because H-passivated SNPs luminesce at blue and near-UV wavelengths (Zhou, Brus, & Friesner 2003) while blue PL is not observed under interstellar conditions (Rush & Witt 1975; Vijh, Witt, & Gordon 2003). Very recently, Witt & Vijh (2004) argued that Fe- or C-passivated SNPs could overcome this problem. It would be very helpful to perform detailed calculations of the 11.3 Si–C emission feature of C-passivated SNPs and compare with the upcoming SIRTF (Space Infrared Telescope Facility) high resolution spectra of the diffuse ISM. Previously, Whittet, Duley, & Martin (1990) deduced that the abundance of Si in SiC dust is no more than 5% of that in silicates, through an analysis of the 7.5–13.5 absorption spectra of 10 Galactic Center sources. It would also be very useful to investigate the IR emission properties of Fe-passivated SNPs which luminesce even more efficiently than O-passivated SNPs in the wavelength range over which the ERE is observed (Mavi et al. 2003).
5.4. Nano Diamond Grains
Cosmic nanodiamonds were first detected in primitive carbonaceous meteorites and identified as presolar in origin based on their isotopic anomalies (Lewis et al. 1987), although their presence in the ISM was proposed almost two decades earlier by Saslaw & Gaustad (1969) to explain the interstellar UV extinction curve. Five years later, Allamandola et al. (1992) attributed the 3.47 absorption band seen toward a large number of protostars to the tertiary C–H stretching mode in diamond-like carbonaceous materials. Jones & d’Hendecourt (2000) further suggested that surface-reconstructed (to -bonded carbon) nanodiamonds could be responsible for the “UIR” emission features, the 2175 extinction hump (also see Sandford 1996), and a part of the far-UV extinction at . More recently, circumstellar nanodiamonds were identified in the dust disks or envelopes surrounding two Herbig Ae/Be stars HD 97048 and Elias 1 and one post-asymptotic giant branch (AGB) star HR 4049, based on the 3.43 and 3.53 C–H stretching emission features expected for surface-hydrogenated nanodiamonds (Guillois, Ledoux, & Reynaud 1999; van Kerckhoven, Tielens, & Waelkens 2002).
Presolar meteoritic nanodiamonds were found to have a log-normal size distribution with a median radius 1.3 (Lewis, Anders, & Draine 1989) and an abundance as much as 0.1% of the total mass in some primitive meteorites, more abundant than any other presolar grains by over two orders of magnitude. However, it is important to recognize that this abundance may not be representative of its original ISM proportion but rather its durability (see Draine 2003a). Indeed, Lewis et al. (1989) found that in interstellar space, as much as 10% of the interstellar carbon (36) could be in the form of nanodiamonds without violating the constraints placed by the interstellar extinction curve. However, a much more stringent upper limit of 0.1 was derived by Tielens et al. (2000) based on nondetection of the characteristic 3.43 and 3.53 C–H stretching emission features in the ISM. Of course, interstellar nanodiamonds could be more abundant if the bulk of them are not hydrogenated.
5.5. Nano Titanium Carbide Grains
Presolar titanium carbide (TiC) grains were first identified in primitive meteorites as nano-sized inclusions embedded in micrometer-sized presolar graphite grains (Bernatowicz et al. 1996). Very recently, von Helden et al. (2000) proposed that TiC nanocrystals could be responsible for the prominent 21 emission feature detected in over a dozen carbon-rich post-AGB stars. This mysterious 21 feature still remains unidentified since its first detection in the IRAS LRS (Low Resolution Spectrometer) spectra of four post-AGB stars (Kwok, Volk, & Hrivnak 1989). While bulk TiC samples show no resonance around 21 (Henning & Mutschke 2001), laboratory absorption spectra of TiC nanocrystal clusters exhibit a strong 21 feature, closely resembling the observed 21 feature both in position, width and in spectral detail (von Helden et al. 2000).
We have examined the nano-TiC proposal by comparing the maximum available with the minimum required TiC dust mass inferred from the nano-TiC model (see Li 2003). It is found that if the UV/visible absorption properties of TiC nanograins are like their bulk counterparts, the model-required TiC dust mass would exceed the maximum available TiC mass by over two orders of magnitude (also see Chigai et al. 2003; Hony et al. 2003). One may argue that nano TiC might have a much higher UV/visible absorptivity so that the available TiC mass may be sufficient to account for the observed 21 emission feature. However, the Kramers-Kronig dispersion relations, which relate the wavelength-integrated extinction cross sections to the total dust mass (Purcell 1969; Draine 2003b), would impose a lower bound on the TiC mass. We have shown that this Kramers-Kronig lower limit exceeds the maximum available TiC mass by a factor of at least 50 (see Li 2003 for details). Therefore, it is unlikely that TiC nanoparticles are responsible for the 21 emission feature of post-AGB stars.
6. Concluding Remarks
Interstellar nanoparticles are important as emitters of near and mid IR radiation, as absorbers of far-UV radiation, as heating agents of the interstellar gas, and possibly as luminescing agents of red light. Our understanding of interstellar nanoparticles obviously remains incomplete. Besides the long-standing problems regarding the carriers of the 2175 extinction hump and the ERE, there are many unanswered questions which will be demanding close attention in the future:
-
•
The origin and evolution of interstellar PAHs are not very clear. Suggested sources for interstellar PAHs include (1) injection (into the ISM) of PAHs formed in carbon star outflows (Latter 1991); (2) shattering of carbonaceous interstellar dust or of photoprocessed interstellar dust organic mantles (Greenberg et al. 2000) by grain-grain collisions in interstellar shocks (Jones, Tielens, & Hollenbach 1996); (3) in-situ formation through ion-molecule reactions (Herbst 1991). Although interstellar PAHs containing more than 20–30 carbon atoms can survive the UV radiation field (Guhathakurta & Draine 1989; Jochims et al. 1994; Allain, Leach, & Sedlmayr 1996; Le Page, Snow, & Bierbaum 2003), they are still subject to destruction by sputtering in interstellar shock waves (but also see Tielens et al. [2000] who argued that destruction of PAHs by sputtering is unimportant, except in extreme environments such as very young supernova remnants with 200 shocks, because they couple very well dynamically to the gas which cools down rapidly), chemical attack by atomic oxygen, and coagulation in dense regions (Draine 1994). Clearly, a detailed study of the evolution of interstellar PAHs would be very valuable.
-
•
The physics and astrophysics of the radiative electronic transitions of interstellar PAHs are not fully understood.
Small neutral PAHs with 40 C atoms are expected to emit near-UV and blue photons through fluorescence, phosphorescence, and perhaps also through the recurrent Poincaré fluorescence. Laboratory studies show that the fluorescence quantum yield can be quite high for isolated molecules (e.g., fluorescence quantum yields in the range of 10%–45% have been measured for gas-phase, collision-free naphthalene C10H8 [Reylé & Bréchignac 2000]). However, no PL shortward of = has been seen in the ISM (Rush & Witt 1975; Vijh, Witt, & Gordon 2003). Although PAH ions do not exhibit strong ordinary fluorescence or phosphorescence (see the caption of Fig. 2), they can undergo Poincaré fluorescence which may have a quantum yield larger than one. Therefore, it is difficult to explain nondetection of blue PL in the ISM in terms of PAH photoionization. Moreover, for PAHs containing 40 C atoms in the diffuse ISM, the probability of finding them in a nonzero charge state is smaller than 30% (see Fig. 7 of Li & Draine 2001b). One may argue that interstellar PAHs are larger (which is true, as shown in Li & Draine 2001b, the average [diffuse ISM] PAH size is 6, corresponding to 100 C atoms) so that their fluorescence mainly occurs at longer wavelengths, say, in the wavelength range over which the ERE is observed.
However, if interstellar PAHs indeed luminesce in the ERE band with the required quantum efficiency (100%; see §2), the “UIR” emission bands expected for these luminescing PAHs would be strongly suppressed because a considerable fraction of the excitation energy is released in the form of PL photons (e.g., in the diffuse ISM with a mean energy 2.1 for ERE photons [Szomoru & Guhathakurta 1998], only 60% of the original excitation energy is available as heat for PAHs which have a mean absorbed photon energy 5.2 [Draine & Li 2001]; this could be even worse since the Poincaré fluorescence may have a quantum yield higher than one). One consequence of this would be that even more carbon atoms in the form of PAHs would be needed to explain the intensity of the “UIR” bands, deteriorating the already tightened carbon budget “crisis” (Snow & Witt 1996).
-
•
It is unclear how different the optical and thermal properties of nanometer-sized materials are compared with their bulk counterparts, although it is generally believed that they may be very different.
-
–
For a small metallic grain, the imaginary part of its dielectric function is expected to be larger compared to that of its bulk counterpart, as a consequence of the so-called electron mean free path limitation effect (e.g. see Bohren & Huffman 1983). This is easier to understand if we decompose into two components and , contributed by bound charges (“interband transitions”) and free electrons, respectively. The free electron component is well described by the Drude theory with an imaginary part , where the plasma frequency is related to the free electron density : , the damping constant is related to the average time between collisions: =. In bulk materials, is mainly determined by the scattering of the electrons with phonons (lattice vibrations), and to a lesser degree, with electrons, lattice defects, or impurities. However, for particles in the nanometer size domain, is increased because of the additional collisions of the conducting electrons with the grain boundary: , where is the bulk metal damping constant, is the electron velocity at the Fermi surface, is a dimensionless constant of order unity which depends on the character of the scattering at the boundary: =1 for classic isotropic scattering, =4/3 for classic diffusive scattering, =1.16 or =1.33 for scattering based on the quantum particle-in-a-box model (see Coronado & Schatz 2003 and references therein). Since in metals near the plasma frequency, can be written as . Clearly, for a metallic grain increases as the grain becomes smaller.
In contrast, our knowledge regarding the size dependence of the dielectric function of dielectric materials is controversial. For example, some theoretical and experimental studies have concluded that the dielectric function of Si nanoparticles is significantly reduced relative to the bulk value (Koshida et al. 1993; Wang & Zunger 1994; Tsu, Babic, & Ioriatti 1997; Amans et al. 2003), which is generally attributed to the quantum confinement effect. But we find that the absorption and reflectivity measurements for porous silicon appear to be consistent with bulk Si together with voids and SiO2 (see Li & Draine 2002a for details). -
–
It has been reported that the specific heat of small metal particles is strongly enhanced over the bulk value (see Halperin 1986, Meyer et al. 2003 and references therein). For example, a progressive decreasing of Debye temperature with the decrease of grain size has been observed for palladium (Pd): for bulk Pd and Pd particles of radius , respectively (Chen et al. 1995 and references therein). This has been attributed to quantum effects on the vibrational spectrum in small particles: as a grain becomes smaller, a larger fraction of atoms occupy surface sites which are weakly bound to the grain; therefore, small grains are expected to have a larger low-frequency mode density due to the weaker bonds of the surface atoms.
However, although an enhancement of the vibrational specific heat is also expected for dielectric grains, the degree of enhancement is unclear due to the differences between the binding and structural properties of dielectrics with metals. For example, based on a lattice dynamical calculation, Hu et al. (2001) have shown that the difference in vibrational specific heat between Si nanocrystals and the bulk is just about a few per cent. The specific heat of nanocrystalline diamond measured by Moelle et al. (1998) shows a close agreement with that of bulk diamond. It is worth noting that the heat capacity of PAHs can be well described by the two 2-dimensional Debye models of bulk graphite (together with contributions from the C–H vibrational modes) (see Fig. 2 of Draine & Li 2001). Clearly, laboratory studies of the optical and thermal properties of interstellar nanoparticle analogues would be very valuable.
-
–
Acknowledgments.
I am extremely grateful to B.T. Draine and A.N. Witt for their invaluable advices, comments, and suggestions. I thank the anonymous referee for his/her very helpful comments and suggestions. I also thank A.N. Witt for the great efforts he has put into making the “Astrophysics of Dust Symposium” a real success.
References
Allain, T., Leach, S., & Sedlmayr, E. 1996, A&A, 305, 602
Allamandola, L.J., & Hudgins, D.M. 2003, in Solid State Astrochemistry, ed. V. Pirronello, & J. Krelowski (Dordrecht: Kluwer), in press
Allamandola, L.J., Tielens, A.G.G.M., & Barker, J.R. 1985, ApJ, 290, L25
Allamandola, L.J., Tielens, A.G.G.M., & Barker, J.R. 1989, ApJS, 71, 733
Allamandola, L.J., Hudgins, D.M., & Sandford, S.A. 1999, ApJ, 511, L115
Allamandola, L.J., Sandford, S.A., Tielens, A.G.G.M., & Herbst, T.M. 1992, ApJ, 399, 134
Amans, D., et al. 2003, J. Appl. Phys., 93, 4173
Andriesse, C.D. 1978, A&A, 66, 169
Arendt, R.G., et al. 1998, ApJ, 508, 74
Bakes, E.L.O., & Tielens, A.G.G.M. 1994, ApJ, 427, 822
Barker, J.R., & Cherchneff, I. 1989, in Interstellar Dust, IAU Symp. 135, ed. L.J. Allamandola, & A.G.G.M. Tielens (Dordrecht: Kluwer), 197
Bernatowicz, T.J., et al. 1996, ApJ, 472, 76
Beyer, T., & Swinehart, D.F. 1973, Comm. Ass. Com. Mach., 16, 379
Birks, J.B. 1970, Photophysics of Aromatic Molecules (New York: Wiley)
Bless, R.C., & Savage, B.D. 1972, ApJ, 171, 293
Boggess, A., & Borgman, J. 1964, ApJ, 140, 1636
Bohren, C.F., & Huffman, D.R. 1983, Absorption and Scattering of Light by Small Particles (New York: Wiley)
Borghesi, A., Bussoletti, E., & Colangeli, L. 1987, ApJ, 314, 422
Boulanger, F., & Pérault, M. 1988, ApJ, 330, 964
Cayrel, R., & Schatzman, E. 1954, Ann. d’Ap., 17, 555
Chang, Y.K., et al. 1999, Phys. Rev. Lett., 82, 5377
Chen, Y.Y., et al. 1995, Phys. Rev. B, 52, 9364
Chigai, T., Yamamoto, T., Kaito C., & Kimura, Y. 2003, ApJ, 587, 771
Chlewicki, G., & Laureijs, R.J. 1988, A&A, 207, L11
Clayton, G.C., et al. 2003, ApJ, 588, 871
Cook, D.J., & Saykally, R.J. 1998, ApJ, 493, 793
Coronado, E.A., & Schatz, G.C. 2003, J. Chem. Phys., 119, 3926
Danielson, R.E., Woolf, N.J., & Gaustad, J.E. 1965, ApJ, 141, 116
Darbon, S., Perrin, J.-M., & Sivan, J.-P. 1999, A&A, 348, 990
Delerue, C., Allan, G., & Lannoo, M. 1993, Phys. Rev. B, 48, 11024
Désert, F.X., Boulanger, F., Léger, A., Puget, J.L., & Sellgren, K. 1986, A&A, 159, 328
Désert, F.X., Boulanger, F., & Puget, J.L. 1990, A&A, 237, 215
d’Hendecourt, L.B., Léger, A., Boissel, P., & Désert, F.X. 1989, in Interstellar Dust, IAU Symp. 135, ed. L.J. Allamandola, & A.G.G.M. Tielens (Dordrecht: Kluwer), 207
d’Hendecourt, L.B., Léger, A., Olofson, G., & Schmidt, W. 1986, A&A, 170, 91
Donn, B. 1968, ApJ, 152, L129
Draine, B.T. 1989, in IAU Symp. 135, Interstellar Dust, ed. L.J. Allamandola, & A.G.G.M. Tielens (Dordrecht: Kluwer), 313
Draine, B.T. 1994, in ASP Conf. Ser. 58, The First Symposium on the Infrared Cirrus and Diffuse Interstellar Medium, ed. M. Cutri, & B. Latter (San Francisco: ASP), 227
Draine, B.T. 1999, in Proc. of the EC-TMR Conf. on 3K Cosmology, ed. L. Maiani, F. Melchiorri, & N. Vittorio (Woodbury: AIP), 283
Draine, B.T. 2003a, ARA&A, 41, 241
Draine, B.T. 2003b, in The Cold Universe, Saas-Fee Advanced Course Vol. 32, ed. D. Pfenniger (Berlin: Springer-Verlag), in press
Draine, B.T. 2004, in ASP Conf. Ser. 000, Astrophysics of Dust, ed. A.N. Witt, G.C. Clayton, & B.T. Draine (San Francisco: ASP), in press
Draine, B.T., & Anderson, N. 1985, ApJ, 292, 494
Draine, B.T., & Lazarian, A. 1998a, ApJ, 494, L19
Draine, B.T., & Lazarian, A. 1998b, ApJ, 508, 157
Draine, B.T., & Lee, H.M. 1984, ApJ, 285, 89
Draine, B.T., & Li, A. 2001, ApJ, 551, 807
Draine, B.T., & Li, A. 2003, in preparation
Duley, W.W. 1985, MNRAS, 215, 259
Duley, W.W., & Williams, D.A. 1981, MNRAS, 196, 269
Duley, W.W., Jones, A.P., & Williams, D.A. 1989, MNRAS, 236, 709
Dwek, E., Zubko, V.G., Arendt, R.G., & Smith, R.K. 2004, in ASP Conf. Ser. 000, Astrophysics of Dust, ed. A.N. Witt, G.C. Clayton, & B.T. Draine (San Francisco: ASP), in press
Dwek, E., et al. 1997, ApJ, 475, 565
Ehrenfreund, P., & Foing, B.H. 1997, Adv. Space Res., 19, 1033
Foing, B.H., & Ehrenfreund, P. 1994, Nature, 369, 296
Fox, M. 2001, Optical Properties of Solids (New York: Oxford Univ. Press)
Gillett, F.C., & Forrest, W.J. 1973, ApJ, 179, 483
Gillett, F.C., Forrest, W.J., & Merrill, K.M. 1973, ApJ, 184, L93
Gilman, R.C. 1969, ApJ, 155, L185
Gordon, K.D., Witt, A.N., & Friedmann, B.C. 1998, ApJ, 498, 522
Gordon, K.D., et al. 2000, ApJ, 544, 859
Greenberg, J.M. 1968, in Stars and Stellar Systems, Vol. VII, ed. B.M. Middlehurst, & L.H. Aller, (Chicago: Univ. of Chicago Press), 221
Greenberg, J.M. 1971, A&A, 12, 240
Greenberg, J.M. 1973, in IAU Symp. 52, Interstellar Dust and Related Topics, ed. J.M. Greenberg, & H.C. van de Hulst (Dordrecht: Reidel), 3
Greenberg, J.M. 1978, in Cosmic Dust, ed. J.A.M. McDonnell (New York: Wiley), 187
Greenberg, J.M., & Li, A. 1999, Adv. Space Res., 24, 497
Greenberg, J.M., Yencha, A.J., Corbett, J.W., & Frisch, H.L. 1972, Mém. Soc. Roy. Sci. Liège, 6e série III, 425
Greenberg, J.M., et al. 2000, ApJ, 531, L71
Greenstein, J.L. 1938, Harvard Obs. Circ., No. 422
Guhathakurta, P., & Draine, B.T. 1989, ApJ, 345, 230
Guillois, O., Ledoux, G., & Reynaud, C. 1999, ApJ, 521, L133
Hackwell, J.A., Gehrz, R.D., & Woolf, N.J. 1970, Nature, 227, 822
Hall, J.S. 1937, ApJ, 85, 145
Hall, J.S. 1949, Science, 109, 166
Halperin, W.P. 1986, Rev. Mod. Phys., 58, 533
Henning, Th., & Mutschke, H. 2001, Spectrochim. Acta, 57, 815
Henning, Th., & Schnaiter, M. 1998, Earth, Moon, & Planets, 80, 179
Herbig, G.H. 2000, 542, 334
Herbst, E. 1991, ApJ, 366, 133
Hiltner, W.A. 1949, Science, 109, 165
Hony, S., Tielens, A.G.G.M., Waters, L.B.F.M., & de Koter, A. 2003, A&A, 402, 211
Hoyle, F., & Wickramasinghe, N.C. 1962, MNRAS, 124, 417
Hu, X., et al. 2001, J. Phys.: Condens. Matter, 13, L835
Jochims, H.W., Rühl, E., Baumgärtel, H., Tobita, S., & Leach, S. 1994, ApJ, 420, 307
Jones, A.P., & d’Hendecourt, L.B. 2000, A&A, 355, 1191
Jones, A.P., Tielens, A.G.G.M., & Hollenbach, D.J. 1996, ApJ, 469, 740
Kamijo, F. 1963, PASJ, 15, 440
Kim, S.H., Martin, P.G., & Hendry, P.D. 1994, ApJ, 422, 164
Knacke, R.F., Cudaback, D.D., & Gaustad, J.E. 1969, ApJ, 158, 151
Koike, K., Nakagawa, M., Koike, C., Okada, M., & Chihara, H. 2002, A&A, 390, 1133
Koshida, N., et al. 1993, Appl. Phys. Lett., 63, 2774
Kroto, H.W., et al. 1985, Nature, 318, 162
Krügel, E. 2003, The Physics of Interstellar Dust (Bristol: IOP)
Kwok, S., Volk, K., & Hrivnak, B.J. 1989, ApJ, 345, L51
Latter, W.B. 1991, ApJ, 377, 187
Leach, S. 1987, in Polycyclic Aromatic Hydrocarbons and Astrophysics, ed. A. Léger, L.B. d’Hendecourt, & N. Boccara (Dordrecht: Reidel), 99
Ledoux, G., et al. 1998, A&A, 333, L39
Ledoux, G., et al. 2001, A&A, 377, 707
Léger, A., & Puget, J.L. 1984, A&A, 137, L5
Léger, A., Boissel, & d’Hendecourt, L.B. 1988, Phys. Rev. Lett., 60, 921
Léger, A., d’Hendecourt, L.B., & Défourneau, D. 1989, A&A, 216, 148
Le Page, V., Snow, T.P., & Bierbaum, V.M. 2003, ApJ, 584, 316
Lewis, R.S., Anders, E., & Draine, B.T. 1989, Nature, 339, 117
Lewis, R.S., Tang, M., Wacker, J.F., Anders, E., & Steel, E. 1987, Nature, 326, 16
Li, A. 2003, ApJ, in press
Li, A., & Draine, B.T. 2001a, ApJ, 550, L213
Li, A., & Draine, B.T. 2001b, ApJ, 554, 778
Li, A., & Draine, B.T. 2002a, ApJ, 564, 803
Li, A., & Draine, B.T. 2002b, ApJ, 572, 232
Li, A., & Draine, B.T. 2002c, ApJ, 576, 762
Li, A., & Greenberg, J.M. 1997, A&A, 323, 566
Li, A., & Greenberg, J.M. 1998, A&A, 339, 591
Li, A., & Greenberg, J.M. 2002, ApJ, 577, 789
Li, A., & Greenberg, J.M. 2003, in Solid State Astrochemistry, ed. V. Pirronello, & J. Krelowski (Dordrecht: Kluwer), in press
Lindblad, B. 1935, Nature, 135, 133
Mathis, J.S. 1996, ApJ, 472, 643
Mathis, J.S., & Whiffen, G. 1989, ApJ, 341, 808
Mathis, J.S., Mezger, P.G., & Panagia, N. 1983, A&A, 128, 212
Mathis, J.S., Rumpl, W., & Nordsieck, K.H. 1977, ApJ, 217, 425
Mattila, K., et al. 1996, A&A, 315, L353
Mavi, H.S., et al. 2003, Mat. Sci. Eng. B, 97, 239
Meyer, R., Lewis, L.J., Prakash, S., & Entel, P. 2003, Phys. Rev. B, 68, 104303
Moelle, C., et al. 1998, Diamond Relat. Mater., 7, 499
Moutou, C., Sellgren, K., Verstraete, L., & Léger, A. 1999, A&A, 347, 949
Onaka, T., Yamamura, I., Tanabe, T., Roellig, T.L., & Yuen, L. 1996, PASJ, 48, L59
Oort, J.H., & van de Hulst, H.C. 1946, Bull. Astron. Inst. Netherlands, 10, 187
Platt, J.R. 1956, ApJ, 123, 486
Papoular, R., et al. 1996, A&A, 315, 222
Pendleton, Y.J. 2004, in ASP Conf. Ser. 000, Astrophysics of Dust, ed. A.N. Witt, G.C. Clayton, & B.T. Draine (San Francisco: ASP), in press
Purcell, E.M. 1969, ApJ, 158, 433
Raty, J.-Y., et al. 2003, Phys. Rev. Lett., 90, 7401
Reylé, C., & Bréchignac, P. 2000, Eur. Phys. J., D8, 205
Rusli, R., Robertson, J., & Amaratunga, G.A.J. 1996, J. Appl. Phys., 80, 2998
Rowan-Robinson, M. 1992, MNRAS, 258, 787
Rush, W.F., & Witt, A.N. 1975, AJ, 80, 31
Sakata, A., et al. 1992, ApJ, 393, L83
Sandford, S.A. 1996, Meteorit. Planet. Sci., 31, 449
Saslaw, W.C., & Gaustad, J.E. 1969, Nature, 221, 160
Schalén, C. 1936, Medd. Uppsala Astron. Obs., No. 64
Schmidt, G.D., Cohen, M., & Margon, B. 1980, ApJ, 239, L133
Schutte, W.A., Tielens, A.G.G.M., & Allamandola, L.J. 1993, ApJ, 415, 397
Seahra, S.S., & Duley, W.W. 1999, ApJ, 520, 719
Sellgren, K. 1984, ApJ, 277, 623
Sellgren, K., Werner, M.W., & Dinerstein, H.L. 1983, ApJ, 271, L13
Sellgren, K., Luan, L., & Werner, M.W. 1990, ApJ, 359, 384
Siebenmorgen, R., & Krügel, E. 1992, A&A, 259, 614
Smith, T.L., & Witt, A.N. 2002, ApJ, 565, 304
Snow, T.P., & Seab, C.G. 1989, A&A, 213, 291
Snow, T.P., & Witt, A.N. 1996, ApJ, 468, L65
Somerville, W.B., & Bellis, J.G. 1989, MNRAS, 240, 41P
Sorrell, W.H. 1990, MNRAS, 243, 570
Stebbins, J., Huffer, C.M., & Whitford, A.E. 1939, ApJ, 90, 209
Stecher, T.P. 1965, ApJ, 142, 1683
Stecher, T.P., & Donn, B. 1965, ApJ, 142, 1681
Stein, S.E., & Rabinovitch, B.S. 1973, J. Chem. Phys., 58, 2438
Stein, W.A., & Gillett, F.C. 1969, ApJ, 155, L197
Szomoru, A., & Guhathakurta, P. 1998, ApJ, 494, L93
Tanaka, M., et al. 1996, PASJ, 48, L53
Tielens, A.G.G.M., & Peeters, E. 2002, in EAS Publ. Ser., Vol. 4, Infrared and Submillimeter Space Astronomy, ed. M. Giard, J.P. Bernard, A. Klotz, & I. Ristorcelli (Paris: EDP Sciences), 43
Tielens, A.G.G.M., van Kerckhoven, C., Peeters, E., & Hony, S. 2000, in IAU Symp. 197, Astrochemistry: From Molecular Clouds to Planetary Systems, ed. Y.C. Minh, & E.F. van Dishoeck (Dordrecht: Kluwer), 349
Trumpler, R.J. 1930, PASP, 42, 214
Tsu, R., Babic, D., & Ioriatti, L., Jr. 1997, J. Appl. Phys., 82, 1327
Uchida, K.I., Sellgren, K., & Werner, M.W. 1998, ApJ, 493, L109
Valencic, L.A., Clayton, G.C., Gordon, K.D., & Smith, T.L. 2003, ApJ, in press
van de Hulst, H.C. 1949, Rech. Astron. Obs. Utrecht, 11, No. 2
van Kerckhoven, C., Tielens, A.G.G.M., & Waelkens, C. 2002, A&A, 384, 568
Vijh, U., Witt, A.N., & Gordon, K.D. 2003, in preparation
von Helden, G., et al. 2000, Science, 288, 313
Wang, L.W., & Zunger, A. 1994, Phys. Rev. Lett., 73, 1039
Webster, A. 1993, MNRAS, 264, 121
Weiland, J.L., et al. 1986, ApJ, 306, L101
Weingartner, J.C., & Draine, B.T. 2001a, ApJ, 548, 296
Weingartner, J.C., & Draine, B.T. 2001b, ApJS, 134, 263
Whitten, G.Z., & Rabinovitch, B.S. 1963, J. Chem. Phys., 38, 2466
Whittet, D.C.B. 2003, Dust in the Galactic Environment (2nd ed; Bristol: IOP)
Whittet, D.C.B., Duley, W.W., & Martin, P.G. 1990, MNRAS, 244, 427
Whittet, D.C.B., et al. 2003, in preparation
Witt, A.N. 1973, in IAU Symp. 52, Interstellar Dust and Related Topics, ed. J.M. Greenberg, & H.C. van de Hulst (Dordrecht: Reidel), 53
Witt, A.N. 2000, J. Geophys. Res., 105, 10299
Witt, A.N., & Lillie, C.F. 1973, A&A, 25, 397
Witt, A.N., & Schild, R. 1985, ApJ, 294, 225
Witt, A.N., & Schild, R. 1988, ApJ, 325, 837
Witt, A.N., & Vijh, U.P. 2004, in ASP Conf. Ser. 000, Astrophysics of Dust, ed. A.N. Witt, G.C. Clayton, & B.T. Draine (San Francisco: ASP), in press
Witt, A.N., Gordon, K.D., & Furton, D.G. 1998, ApJ, 501, L111
Wright, E.L. 1987, ApJ, 320, 818
York, D.G., et al. 1973, ApJ, 182, L1
Zhou, Z., Brus, L., & Friesner, R. 2003, Nano Lett., 3, 163
Zubko, V.G. 1999a, in Formation and Evolution of Solids in Space, ed. J.M. Greenberg, & A. Li (Dordrecht: Kluwer), 85
Zubko, V.G. 1999b, ApJ, 513, L29
Zubko, V.G., Dwek, E., & Arendt, R.G. 2003, ApJ, in press