11email: m.a.thompson@kent.ac.uk
A Compact Array imaging survey of southern bright-rimmed clouds††thanks: Full versions of Figs. 1 and 2 may be found in the on-line supplement.
We have carried out a radio-wavelength imaging survey of 45 bright-rimmed clouds (BRCs), using the Australia Telescope Compact Array to characterise the physical properties in their ionised boundary layers. We detected radio emission from a total of 25 clouds and using a combination of Digitised Sky Survey and mid-infrared MSX 8m images classified the emission into that associated with the ionised cloud rims, that associated with embedded possible massive YSOs and that unlikely to be associated with the clouds at all. A total of 18 clouds display radio emission clearly associated with the cloud rim and we determine the ionising photon flux illuminating these clouds and the electron density and pressure of their ionised boundary layers. Using a global estimate for the interior molecular pressure of these clouds we show that the majority are likely to be in pressure equilibrium and hence are currently being shocked by photoionisation-induced shocks. We identify those clouds where the predicted ionising photon flux is inconsistent with that derived from the observations and show that either the spectral types of the stars illuminating the BRCs are earlier than previously thought or that there must be additional ionising sources within the HII regions. Finally, we identify the radio sources embedded within the clouds with infrared stellar clusters and show that they contain late O and early B-type stars, demonstrating that a number of BRCs are intimately involved with high to intermediate-mass star formation.
Key Words.:
¡Stars: formation – ISM: HII regions – ISM: Clouds – Radio continuum: ISM¿1 Introduction
Bright rimmed clouds (BRCs) are found at the edges of HII regions and are the result of the interaction of OB stars with their environment. The surface layers of BRCs are photoionised and excited by nearby OB star(s), resulting in a bright optical rim located on the side of the cloud facing the OB star. The cloud material is often swept into a cometary morphology by the radiation pressure (e.g. Bertoldi bertoldi (1989); Lefloch & Lazareff ll94 (1994)). Dense cores found at the head of the clouds may shield the remaining cloud material from the UV radiation, resulting in a column or finger structure similar to that observed in the Eagle Nebula (Hester et al. hester96 (1996); White et al. whiteeagle (1999)). These phenomena lead to the other common names for bright-rimmed clouds such as elephant trunk nebulae, cometary globules or speck globules (Bertoldi bertoldi (1989)).
The photoionisation of the cloud surface has been linked to induced star formation within the clouds (e.g. Elmegreen e91 (1991); Sugitani et al. sfo (1991); Sugitani et al. sfmo89 (1989)). In a process known as Radiative-driven Implosion (or RDI) shocks driven into the cloud by the photoionisation of its outer layers compress the molecular gas, forming dense cores at the head of the cloud and possibly triggering their collapse. The physical processes behind RDI are relatively well-understood and have been the subject of recent theoretical studies (Bertoldi bertoldi (1989); Bertoldi & McKee bk90 (1990); Lefloch & Lazareff ll94 (1994), ll95 (1995)). The radiative-driven implosion of molecular clouds at the periphery of HII regions may amount to a cumulative total of some several hundred stars per HII region (Ogura et al. osp02 (2002)) and perhaps 15% or more of the low-to-intermediate mass stellar mass function (Sugitani et al. sfo (1991)).
One of the key diagnostic indicators in the RDI models is the ratio of external to internal pressure. As the surface layers of the BRC become ionised a recombination layer known as the ionised boundary layer (or IBL) develops on the side of the cloud facing the ionising star. If the conditions within the IBL are such that the pressure within the ionised exterior gas is greater than or equal to the interior neutral cloud pressure, photoionisation-induced shocks and a D-critical ionisation front propagate into the cloud interior, compressing and heating the molecular gas (Bertoldi bertoldi (1989); Lefloch & Lazareff ll94 (1994)). On the other hand, if the BRC is overpressured with respect to the ionised boundary layer then the ionisation front stalls at the cloud surface until the increasing recombination within the IBL raises the ionised gas pressure to equilibrium with the interior cloud pressure (Lefloch & Lazareff ll94 (1994)). As equilibrium is reached the evolution of the cloud follows the same path as the initially underpressured case.
The RDI models show that the evolution of a BRC critically depends upon the duration of its UV illumination. The pressure balance between the interior and exterior of the BRC thus allows us to discriminate between clouds that are currently affected by photoionisation-induced shocks and those clouds that are as yet relatively unaffected. The physical conditions in the ionised boundary layer are crucial to understand the RDI process and any subsequent star formation, as it is the ionised boundary layer which traces the interaction between the UV radiation from the OB star(s) and the molecular gas of the bright-rimmed cloud. However, although at least 89 BRCs have been identified as potential star-forming regions via IRAS searches (Sugitani et al. sfo (1991); Sugitani & Ogura so94 (1994)) only a handful of clouds have had the conditions in their ionised boundary layers determined or their pressure balance investigated (Thompson et al. 2003a ; White et al. whiteeagle (1999); Megeath & Wilson mw97 (1997); Lefloch et al. llc97 (1997)).
Radio continuum observations are a valuable probe of the conditions within the ionised boundary layer. From the radio free-free emission we can determine the ionised gas pressure, the ionising photon flux impinging upon the cloud and the electron density of the ionised boundary layer (Thompson et al. 2003a ; Lefloch et al. llc97 (1997)). Data from the NRAO VLA Sky Survey (NVSS; Condon et al. nvss (1998)) may be used for BRCs north of ° (e.g. Thompson et al. 2003a ) but no such resource111The Sydney University Molonglo Sky Survey (SUMSS; Bock et al. bls99 (1999)) has comparable resolution and sensitivity to NVSS for ° but does not yet cover a substantial portion of the southern galactic plane. currently exists for the BRCs in the southern hemisphere survey of Sugitani & Ogura (so94 (1994)). As a first step toward establishing the physical conditions in the ionised boundary layers and pressure balances for a wide sample of BRCs we present an Australia Telescope Compact Array222The Australia Telescope Compact Array is funded by the Commonwealth of Australia for operation as a National Facility managed by CSIRO. (ATCA) radio imaging survey of the BRCs from the Sugitani & Ogura (so94 (1994)) catalogue.
The observations and data reduction procedure are described in Sect. 2. The data from the survey are presented and analysed in Sect. 3, with particular reference to the likely nature of the detected emission (i.e. does the emission emanate from the ionised boundary layer or from embedded sources?). In Sect. 4 we discuss the implications of the survey and estimate the likely ratio between external and internal pressure of the BRCs detected in the survey, using assumptions for the internal molecular gas pressure. Finally in Sect. 5 we present a summary of our results and conclusions.
2 Observations and data reduction
We obtained radio images of the 45 BRCs from the southern hemisphere survey of Sugitani & Ogura (so94 (1994)) using the Australia Telescope Compact Array (ATCA), which is located at the Paul Wild Observatory, Narrabri, New South Wales, Australia. The observations were carried out on the 9th January, the 16th January and the 29th June 2002. The ATCA is a east-west array comprising 6 22 m antennas which may be positioned in several configurations along a railway track. The sixth antenna is located three kilometres further west of the remaining five antennas. Each antenna is fitted with a dual feedhorn system allowing simultaneous dual-frequency observations at either 20/13 cm or 6/3 cm.
| Cloud ID | Primary beam centre | Image rms | ||
|---|---|---|---|---|
| (2000) | (2000) | (cm) | (mJy/beam) | |
| SFO 45 | 07:18:23.7 | -22:06:13 | 20/13 | 1.72/0.73 |
| SFO 46 | 07:19:25.8 | -44:35:01 | 20/13 | 1.45 /0.24 |
| SFO 47 | 07:31:48.9 | -19:27:33 | 20/13 | 1.10/0.60 |
| SFO 48 | 07:34:24.9 | -46:54:12 | 20/13 | 0.86/0.57 |
| SFO 49 | 07:35:41.0 | -18:48:59 | 20/13 | 1.42/1.62 |
| SFO 50 | 07:40:28.5 | -43:06:20 | 20/13 | 1.2/0.50 |
| SFO 51 | 08:09:32.8 | -36:05:00 | 20/13 | 0.94/0.28 |
| SFO 52 | 08:25:43.9 | -51:00:37 | 20/13 | 3.15/1.05 |
| SFO 53 | 08:26:31.7 | -50:40:30 | 20/13 | 3.20/3.60 |
| SFO 54 | 08:35:31.7 | -40:38:28 | 20/13 | 1.70/0.53 |
| SFO 55 | 08:41:13.0 | -40:52:03 | 20/13 | 0.50/0.50 |
| SFO 56 | 08:42:59.6 | -39:59:56 | 20/13 | 1.20/0.30 |
| SFO 57 | 08:44:07.7 | -41:16:14 | 6/3 | 0.67/0.33 |
| SFO 58 | 08:45:25.4 | -41:16:02 | 20/13 | 0.61/0.33 |
| SFO 59 | 08:58:04.2 | -47:22:57 | 20/13 | 83.40/101.58 |
| SFO 60 | 09:00:01.2 | -47:31:37 | 20/13 | 120/200 |
| SFO 61 | 11:00:13.5 | -59:36:09 | 6/3 | 0.50/0.18 |
| SFO 62 | 11:01:15.8 | -59:51:01 | 6/3 | 0.40/0.21 |
| SFO 63 | 11:03:18.8 | -59:48:01 | 6/3 | 0.68/0.34 |
| SFO 64 | 11:12:18.1 | -58:46:20 | 20/13 | 1.00/0.52 |
| SFO 65 | 11:32:55.3 | -63:27:59 | 20/13 | 3.10/1.30 |
| SFO 66 | 11:33:49.5 | -63:16:20 | 6/3 | 0.67/0.32 |
| SFO 67 | 11:34:00.7 | -63:11:19 | 6/3 | 0.67/0.32 |
| SFO 68 | 11:35:31.9 | -63:14:51 | 6/3 | 0.80/0.33 |
| SFO 69 | 11:41:11.2 | -63:23:13 | 20/13 | 4.98/5.00 |
| SFO 70 | 11:42:11.2 | -63:07:50 | 6/3 | 0.51/0.33 |
| SFO 71 | 13:08:12.7 | -62:10:27 | 20/13 | 7.10/4.10 |
| SFO 72 | 13:19:07.7 | -62:33:44 | 20/13 | 3.60/1.80 |
| SFO 73 | 13:20:05.7 | -62:24:03 | 20/13 | 1.00/6.02 |
| SFO 74 | 14:19:42.1 | -61:25:17 | 20/13 | 1.67/0.6 |
| SFO 75 | 15:55:50.4 | -54:38:58 | 20/13 | 41.00/9.00 |
| SFO 76 | 16:10:38.6 | -49:05:52 | 6/3 | 0.32/1.02 |
| SFO 77 | 16:19:53.9 | -25:33:39 | 6/3 | 0.67/0.22 |
| SFO 78 | 16:20:52.9 | -25:08:07 | 6/3 | 0.53/0.23 |
| SFO 79 | 16:40:00.1 | -48:51:45 | 6/3 | 43.33/41.02 |
| SFO 80 | 16:40:16.8 | -48:42:25 | 20/13 | 10.03/8.62 |
| SFO 81 | 16:41:08.8 | -49:17:45 | 20/13 | 6.59/2.30 |
| SFO 82 | 16:46:50.2 | -41:13:54 | 20/13 | 0.50/0.42 |
| SFO 83 | 16:52:12.0 | -40:48:09 | 6/3 | 0.51/0.27 |
| SFO 84 | 16:53:45.1 | -40:07:22 | 20/13 | 3.99/1.00 |
| SFO 85 | 16:59:06.4 | -42:42:04 | 20/13 | 13.00/67.00 |
| SFO 86 | 17:49:36.1 | -31:29:13 | 20/13 | 3.52/1.00 |
| SFO 87 | 18:02:51.6 | -24:22:08 | 20/13 | 42.01/57.11 |
| SFO 88 | 18:04:16.8 | -24:06:59 | 20/13 | 26.50/12.1 |
| SFO 89 | 18:09:54.3 | -24:04:56 | 20/13 | 5.12/1.54 |
| Observing dates | 9th Jan | 16th Jan | 29th Jun |
|---|---|---|---|
| Configuration | 750A | 750A | EW214 |
| Wavelength | 20/13 cm | 20/13 cm | 6/3 cm |
| Bandwidth | 128 MHz | 128 MHz | 128 MHz |
| Time per source | 30 min | 30 min | 30 min |
| Phase calibrators | 110956 | 064775 | 090647 |
| 135263 | 0733174 | 110956 | |
| 1613586 | 0826373 | 1622297 | |
| 164650 | 090647 | 164650 | |
| 1748253 |
One of our main considerations in planning the survey observations was to maximise the largest angular scale present in the final images. Interferometers act as a high pass filter removing Fourier components that are less than the minimum antenna spacing. In order to maximise the largest angular scale present in the image one should ideally observe with the most compact array possible, at the longest possible wavelength and over a full track in the plane. Practical considerations usually enforce a compromise in one or more of these conditions. The optical diameters of the bright-rimmed clouds are typically 4–5′ as measured from POSS-II optical plates by Sugitani & Fukui (so94 (1994)) and so we required a largest angular scale of at least this size.
At the start of the survey the most compact suitable configuration was the 750 m array, which for a series of cuts through the -plane yields a largest angular scale of 36 at a wavelength of 13 cm and 56 at a wavelength of 20 cm. Thus, in order to maintain the necessary largest scale we begun the survey using the simultaneous 20/13 cm mode of the ATCA. The shorter 6/3 cm mode is preferable to avoid significant contamination by steep-spectrum background sources, but even with the more compact 367 m array the resulting largest angular scale is smaller than the typical BRC size (as estimated from the Digitised Sky Survey images). A total of 32 clouds were observed at 20/13 cm using the 750 m array configuration. However, mid-way through the radio imaging survey a new, more compact 214 m array was successfully trialed and the remaining 13 clouds were observed at 6/3 cm using this configuration.
Each cloud from the Sugitani & Ogura (so94 (1994)) survey was observed with a single pointing with the primary beam centre pointed toward the IRAS point source position. Table 1 shows the clouds, their positions and the wavelengths that were observed. To maximise the coverage the integration time for each cloud was split into a series of 6 5 minute “cuts” which were spread over a wide range of hour angles. The resulting theoretical r.m.s. sensitivities for this integration time are 0.15, 0.2, 0.15 and 0.2 mJy/beam for 20, 13, 6 and 3 cm respectively (assuming natural weighting). Sidelobes from strong confusing sources in the primary beam may raise this considerably as can be seen in Table 1. We will elaborate upon this issue further in in Sect. 3. The full receiver bandwidth of 128 MHz was used for both frequency pairs, split into 32 channels. Phase calibrators were observed for a few minutes approximately once every hour and the primary ATCA flux calibrator 1934638 was observed at least once per observing session. The observing parameters of the survey are summarised in Table 2
The data were reduced and calibrated using the synthesis reduction package Miriad (Sault et al. miriad (1995)) and following standard ATCA procedures. The images were CLEANed using a robust weighting of 0 to simultaneously minimise the r.m.s. noise in the images and maximise their sensitivity to large angular scales. The long (in excess of 3 km) baselines from the 6th antenna were found to significantly worsen the resulting images and data from this antenna were excluded from the final cleaned images to improve the large-scale sensitivity. The resulting synthesised beamwidths are typically 90″ for the 20 and 6 cm images and 60″ for the 13 and 3 cm images. The synthesised beamwidths are a strong function of the declination – images taken close to the celestial equator possess elliptical synthesised beams, in some cases with a semi-major FWHM of up to 150″ for images at a wavelength of 20 cm.
3 Results and analysis
3.1 Source identification and classification
| Peak flux (mJy/beam) | Integrated flux (mJy) | ||||||
| Source ID | (2000) | (2000) | 3 cm | 6 cm | 3 cm | 6 cm | Type |
| SFO 57 | 08:44:11.4 | -41:16:17 | 8.0 | 30.7 | 33.4 | 76.4 | 1 |
| SFO 61a | 11:00:08.0 | -59:36:06 | 1.9 | 7.1aafootnotemark: a | 2.1 | 16.2aafootnotemark: a | 1 |
| SFO 61b | 11:00:08.0 | -59:37:48 | 1.5 | … | 1.7 | … | 4 |
| SFO 62 | 11:01:16.6 | -59:50:40 | 68.2 | 126 | 112 | 197 | 2 |
| SFO 63 | 11:03:24.8 | -59:48:55 | 11.5 | 33.6 | 19.0 | 72.9 | 1 |
| SFO 66a | 11:33:51.2 | -63:15:56 | 3.4 | 4.3bbfootnotemark: b | 3.4 | 4.3bbfootnotemark: b | 1 |
| SFO 66b | 11:33:36.1 | -63:16:32 | 1.7bbfootnotemark: b | 9.6 | 1.7bbfootnotemark: b | 9.6aafootnotemark: a | 4 |
| SFO 66c | 11:33:15.6 | -63:17:26 | 54.7 | 111 | 56.3 | 105 | 4 |
| SFO 66d | 11:33:07.3 | -63:13:14 | 2.4 | 1.1bbfootnotemark: b | 3.4 | 1.1bbfootnotemark: b | 4 |
| SFO 67a | 11:34:04.1 | -63:12:11 | 0.9 | 16.3 | 0.9 | 52.4 | 1 |
| SFO 67b | 11:34:07.3 | -63:18:56 | 0.9 | 10.9 | 0.9 | 8.0 | 4 |
| SFO 68 | 11:35:32.4 | -63:15:33 | 16.6 | 45.6 | 32.4 | 149 | 1 |
| SFO 70 | 11:42:04.1 | -63:08:11 | 2.3 | 4.8 | 7.0 | 5.6 | 1 |
| SFO 76 | 16:10:37.6 | -49:05:46 | 62.5 | 141.5 | 130.4 | 400.0 | 1 |
| SFO 77 | 16:19:56.5 | -25:33:51 | 15.1 | 42.7 | 40.5 | 91.5 | 1 |
| SFO 78 | 16:20:44.9 | -25:04:40 | 2.3 | 0.7 | 12.7 | 0.7 | 4 |
| SFO 79 | 16:39:59.8 | -48:51:42 | 4100 | 6000bbfootnotemark: b | 4800 | 6000bbfootnotemark: b | 3 |
| SFO 83 | 16:52:13.5 | -40:48:30 | 4.5 | 14.2 | 6.6 | 23.4 | 1 |
| Peak flux (mJy/beam) | Integrated flux (mJy) | ||||||
| Source ID | (2000) | (2000) | 13 cm | 20 cm | 13 cm | 20 cm | Type |
| SFO 47a | 07:32:10.0 | -19:28:48 | 11.7 | 14.4 | 15.0 | 24.9 | 4 |
| SFO 47b | 07:31:49.0 | -19:24:38 | 28.8 | 13.5 | 93.8 | 186 | 4 |
| SFO 49a | 07:36:02.5 | -18:53:16 | 242 | 316 | 274 | 357 | 4 |
| SFO 49b | 07:35:34.5 | -18:45:32 | 194 | 294.2 | 463 | 568 | 4 |
| SFO 56 | 08:42:57.0 | -40:00:26 | 3.6 | 5.2aafootnotemark: a | 3.6 | 5.2aafootnotemark: a | 4 |
| SFO 58a | 08:45:15.8 | -41:13:33 | 2.7 | 1.0 | 2.7 | 1.0 | 4 |
| SFO 58b | 08:45:19.5 | -41:15:13 | 6.9 | 1.0 | 8.7 | 1.0 | 1 |
| SFO 59 | 08:58:9.1 | -47:21:51 | 3100 | 305 | 10400 | 305 | 3 |
| SFO 64 | 11:12:13.7 | -58:46:45 | 14.4 | 45.6 | 117 | 236 | 1 |
| SFO 69 | 11:41:04.9 | -63:22:05 | 25.4 | 15.0 | 133 | 15.0 | 4 |
| SFO 74 | 14:19:40.9 | -61:25:17 | 9.9 | 25.0 | 26.3 | 37.3 | 3 |
| SFO 75 | 15:55:43.4 | -54:39:07 | 115.0 | 443 | 247 | 479 | 1 |
| SFO 82a | 16:47:22.1 | -41:13:06 | 3.0aafootnotemark: a | 12.3 | 3.0aafootnotemark: a | 36.7 | 1 |
| SFO 82b | 16:47:19.4 | -41:15:43 | 5.1 | 23.2 | 6.7 | 63.6 | 1 |
| SFO 84 | 16:53:51.9 | -40:08:09 | …bbfootnotemark: b | 11.7 | …bbfootnotemark: b | 28.6 | 1 |
| SFO 85a | 16:59:04.0 | -42:41:46 | 40.3bbfootnotemark: b | 201 | 40.3aafootnotemark: a | 201 | 3 |
| SFO 85b | 16:59:12.0 | -42:43:15 | 67.4 | 201 | 97.2 | 201 | 4 |
| SFO 89 | 18:09:48.9 | -24:04:56 | 63.2 | 102 | 28.6 | 369 | 1 |
We have mapped the radio emission around 45 bright-rimmed clouds from the survey of Sugitani & Ogura (so94 (1994)). For the purposes of our survey we focus solely upon the radio emission that is associated with each bright-rimmed cloud, rather than the many unassociated and potentially background point sources that are predominantly found in the 20 cm images. We identified radio sources in each of the final cleaned images as features with peak fluxes greater than 3 times the r.m.s. noise in the image (i.e. ) and positionally associated with the optical clouds seen in the Digitised Sky Survey images of Sugitani & Ogura (so94 (1994)).
We detected no radio emission to a level of 3 times the r.m.s. noise associated with the rims of the clouds SFO 45, 46, 48, 50–55, 60, 71–73, 80, 81, 83, or 86–88. We calculate upper limits for the ionising flux illuminating these clouds in Sect. 3.3. A total of 36 radio sources positionally associated with the bright-rimmed clouds were detected. The coordinates, peak fluxes and integrated flux densities of the 36 identified radio sources are found in Tables 3 and 4. The peak and integrated flux densities were measured from the final cleaned images using the visualisation package kview (Gooch et al. kview (1995))
Given the large density of extragalactic radio sources on the sky at 20 cm, it is important to consider the likelihood that the emission we detect positionally coincident with the clouds may originate from background extragalactic sources. Using the source counts from the NVSS (Condon et al. nvss (1998)), which has a similar synthesised beamwidth and sensitivity limit to our observations, and assuming that the source counts are similar for both hemispheres, we estimate that no more than 4 BRC-associated sources in our survey are likely to be background extragalactic sources.
We attempted to rule out background sources by measuring the spectral index of the emission, however the ATCA is not a scaled array between the two wavelengths that were observed simultaneously and the measured spectral index is thus highly dependent upon the coverage of the observations and the quality of the “dirty beam” (Cornwell et al. cbb99 (1998)). Even a small uncertainty in the source flux at each wavelength due to the nonlinear CLEAN algorithm can result in a large uncertainty in the spectral index and we were unable to use the measured spectral indices to discriminate between the flat-spectrum emission expected for thermal free-free radiation or the steep non-thermal spectra expected from background radio galaxies.
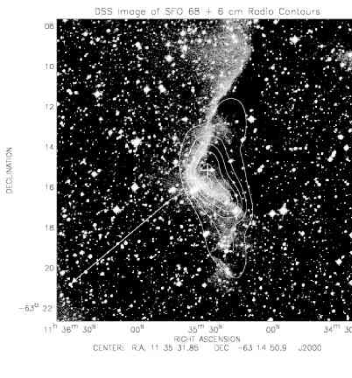
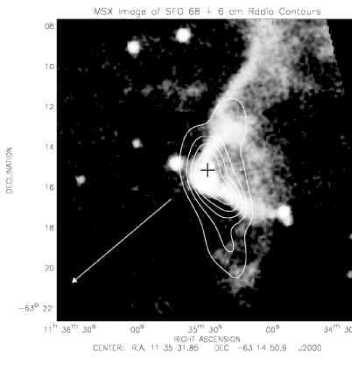
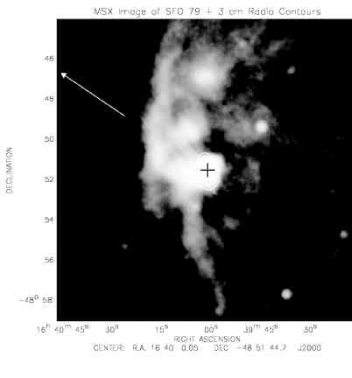
In order to aid the classification of the detected radio sources and rule out any likely chance associations with background extragalactic sources we compared the radio emission to optical DSS images and mid-infrared Midcourse Space Experiment (MSX) 8 m Band A images. The MSX satellite performed a mid-infrared survey of the Galactic plane at a spatial resolution of 18″ with simultaneous observations in four wavelength bands between 6 and 25 m (Price et al. price01 (2001)). Band A of the MSX survey spans a wavelength range of 6.8–10.8 m, which includes emission bands attributed to Polycyclic Aromatic Hydrocarbons (PAHs) at 7.7 and 8.6 m. PAH emission is known to be a good tracer of UV-irradiated photon-dominated regions (Leger & Puget leger84 (1984)) as the PAHs are transiently heated by the absorption of UV photons. Comparing the appearance of the clouds in the radio, optical and mid-infrared allows the morphology of the ionised rim and PDR in the underlying molecular cloud to be traced irrespective of visual extinction or contamination effects; discriminating between chance associations and true bright-rim emission.
The radio images reveal a variety of structures, some displaying a simple geometry with the ionised gas traced by the radio emission following the morphology of the optical rim, whereas in others the emission is concentrated around a central object offset from the optical rim. We have classified the detected radio sources according to their morphology and association with optical and MSX 8 m emission using the following scheme:
-
1.
Bright-rim emission clouds with radio and 8 m emission positionally coincident with their bright optical rims. The radio and 8 m emission also displays some degree of morphological correlation with the cloud rim. These clouds are strong candidates for clouds that are currently being photoionised by nearby OB star(s) as they display evidence for both photoionised boundary layers and photodissociation regions that follow the bright optical rim emission. A total of 18 Type 1 sources were identified in the survey. Examples of the Type 1 rim-emission sources are SFO 58a, SFO 64, SFO 68 and SFO 76.
-
2.
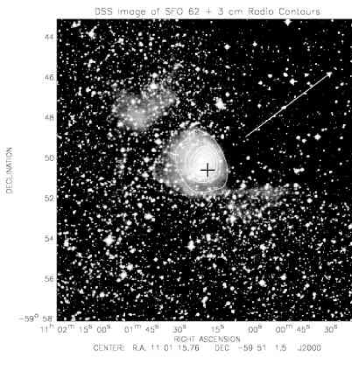
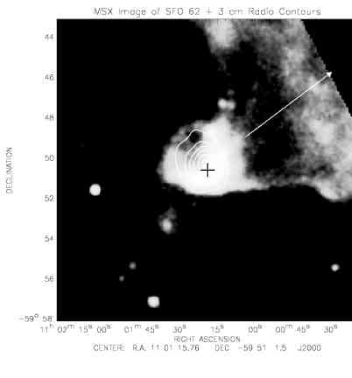
Broken-rimmed clouds, in which the radio and MSX 8m emission is positionally coincident with the rim of the cloud (as Type 1) but the rim has a reverse curvature with respect to the normal orientation, i.e. the rim is curved towards the molecular cloud, rather than the ionising star. The morphology of this cloud type resembles the well-known broken cometary globule CG4 in the Gum Nebula (Reipurth reipurth83 (1983); González-Alfonso et al. g-acr95 (1995)), although with the exception that there is a clearly defined stellar cluster responsible for disrupting the molecular gas. Only a single cloud of this type (SFO 62) was identified in the survey.
-
3.
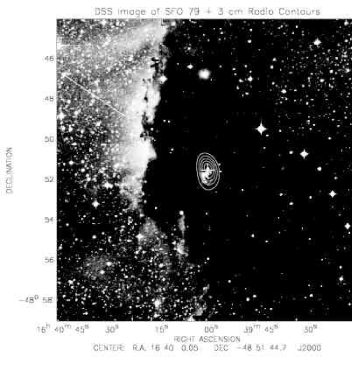
Embedded objects with compact and coincident radio and mid-infrared emission that is set back from the rim in the heart of the cloud. These objects are strong candidates for embedded compact HII regions by virtue of the strength of their radio emission and their infrared colours, which are consistent with the Wood & Churchwell (wc89 (1989)) IRAS criteria. There are 4 Type 3 sources identified in the survey, of which SFO 79 is a good example.
-
4.
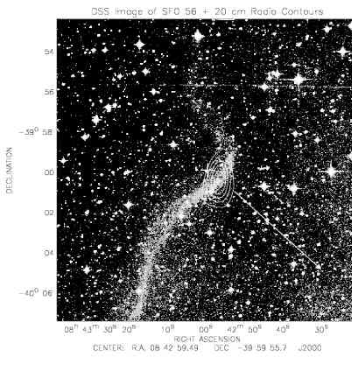
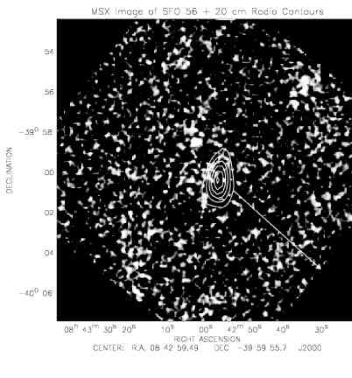
Radio emission that is uncorrelated with either the bright optical rim or MSX 8m emission. These sources display no obvious morphological or positional correlation with either the cloud rim or the MSX mid-infrared and are most likely background extragalactic objects. Twelve radio sources were found to be Type 4 objects, three times larger than the number of confusing sources predicted from the NVSS source counts. It is possible that a number of these detections may be due to free-free emission, but without observations of higher sensitivity and resolution it is impossible to classify these sources as such. An example of this is the source SFO 56, where there is an unresolved radio source positionally coincident with the cloud rim. We classify this source as Type 4 because there is no supporting evidence from the MSX 8 m emission that the cloud possesses a PDR and that the radio emission is associated with an ionised boundary layer.
MSX 8 m and Digitised Sky Survey red images of representative sources overlaid with radio contours illustrating the classification scheme can be found in Fig. 1. Images of the remaining clouds are available only in the online supplement to this paper.
3.2 Ionised boundary layers associated with BRCs
For those clouds with associated radio emission that is identified as Type 1, i.e. where the emission is highly likely to be free-free emission from the rim of the cloud, we evaluate the ionising photon flux impinging upon the cloud and the electron density and pressure of the ionised boundary layer. In order to determine these quantities we use the general equations from Lefloch et al. (llc97 (1997)). Rearranging their Equation 1, the ionising photon flux arriving at the cloud rim may be written in units of cm-2 s as
| (1) |
where is the integrated radio flux in mJy, is the effective electron temperature of the ionised gas in K, is the frequency of the free-free emission in GHz and is the angular diameter over which the emission is integrated in arcseconds.
The electron density () of the ionised boundary layer surrounding the cloud may also be derived from the integrated radio flux by subsituting for the ionising photon flux in Equation 6 of Lefloch et al. (llc97 (1997)). The electron density in cm-3 is given by:
| (2) |
where those quantities common to both Eq. (1) and (2) are in the same units, is the radius of the cloud in pc and is the effective thickness of the ionised boundary layer as a fraction of the cloud radius. Bertoldi (bertoldi (1989)) shows that the effective thickness of the IBL varies over the range 0.1–0.2 of the cloud radius and is mainly dependent upon the product of the ionising flux and the cloud curvature. Here, we assume , which implies that the derived electron density is strictly a lower limit (albeit by no more than a factor of ). As several of the clouds are unresolved by our radio observations we estimated the cloud radii () from the Digitised Sky Survey images of the cloud rims published in Sugitani & Ogura (so94 (1994)). The pressure within the ionised boundary layer may be evaluated from the electron density and temperature via:
| (3) |
As the pressure within the IBL depends upon the electron density, the pressure is again a strict lower limit to within a factor of . Values for , and were calculated using Eq. (1)–(3), assuming a boundary layer thickness of and an effective electron temperature of K. In order to derive a global average of , and for each cloud the source-integrated fluxes contained in Tables 3 and 4 were used. Where the sources were detected at more than one wavelength (i.e. 20+13 cm or 6+3 cm), separate values were calculated at each wavelength and found to agree closely (to within the measurement errors). The separate wavelength values for , and were then averaged together for each cloud and are given in Table 5.
| Cloud Radius | Measured ionising flux | Predicted ionising flux | Electron Density | Ionised gas pressure | |
| Source ID | (pc) | (108 cm-2 s-1) | (108 cm-2 s-1) | (cm-3 ) | (cm-3 K) |
| SFO 57 | 0.10 | 7.7 | 29 | 214 | 4.3 106 |
| SFO 58b | 0.18 | 1.5 | 15 | 72 | 2.8 105 |
| SFO 61a | 0.81 | 3.1 | 0.2 | 85 | 1.9 105 |
| SFO 63 | 0.57 | 2.1 | 0.2 | 147 | 2.9 106 |
| SFO 64 | 0.75 | 2.3 | 20 | 133 | 2.7 106 |
| SFO 66a | 0.16 | 2.4 | 6.4 | 93 | 1.9 106 |
| SFO 66b | 0.16 | 2.7 | 6.4 | 98 | 2.0 106 |
| SFO 67a | 0.35 | 3.0 | 22 | 72 | 1.4 106 |
| SFO 68 | 0.38 | 15 | 63 | 153 | 3.1 106 |
| SFO 75 | 0.22 | 200 | 570 | 730 | 1.5 107 |
| SFO 76 | 0.12 | 22 | 110 | 333 | 6.7 106 |
| SFO 77 | 0.002 | 9.4 | 1.6 | 1660 | 3.3 107 |
| SFO 78 | 0.002 | 1.3 | 0.5 | 533 | 1.1 107 |
| SFO 82b | 0.24 | 4.9 | 1.0 | 111 | 2.2 106 |
| SFO 83 | 0.19 | 3.7 | 1.9 | 108 | 2.2 106 |
| SFO 84 | 0.40 | 5.4 | 2.3 | 89 | 1.8 106 |
| SFO 89 | 0.10 | 16 | 19 | 303 | 6.1 106 |
It is also instructive to compare the value for the ionising flux that is derived from the measured free-free radio flux density to the value that can be predicted from the spectral type of the suspected ionising star (). Contrasting the observed ionising flux to the predicted ionising flux allows us to investigate the likelihood that the clouds are being ionised by the suspected star in question and determine whether any additional ionising sources may be present or if the suspected ionising star is located much further from the cloud than its projected distance on the sky suggests.
We identified the suspected ionising stars for the BRCs in our sample by using a combination of those identified by Yamaguchi et al. (ysmmmof99 (1999)) and a literature search carried out using the SIMBAD database of astronomical catalogues (http://simbad.u-strasbg.fr). Two BRCs are missing from the list in Yamaguchi et al. (ysmmmof99 (1999)), SFO 77 and SFO 78. For these two stars we assume that they are primarily ionised by the nearby B1 III star Sco (Sugitani & Ogura so94 (1994)), also known as HD 147165, and the B1 star CCDM J162122536AB. We also note that there is a discrepancy regarding the distance to Sco; Sugitani & Ogura (so94 (1994)) quote a distance of 1.65 kpc to Sco, whereas this star appears to be a member of the Sco OB2 complex which is at a distance of 150 pc (Eggen eggen98 (1998)). In this paper we assume a distance of 150 pc to Sco and its two associated BRCs.
| HII region | Ionising star(s) | Spectral Type | (kpc) | Associated BRCs |
|---|---|---|---|---|
| S 306 | MFJ 3 | B0 V | 3.6 | SFO 47 |
| S 307 | LSS 458 | O5 | 4.2 | SFO 49 |
| LSS 467 | O9.5 III | |||
| RCW 14 | HD 57236 | O8 V | 3.9 | SFO 45 |
| Gum Nebula | Pup | O4 If | 0.45 | SFO 46, SFO 48, SFO 50–53 |
| Vel | WC 8+O8 III | |||
| NGC 2626 | vBH 17a | B1 V | 0.95 | SFO 54 |
| RCW 27 | HD 73882 | O8 V | 1.2 | SFO 55, SFO 56 |
| RCW 32 | HD 74804 | B0 V | 0.70 | SFO 57, SFO 58 |
| RCW 38 | RCW 38 IRS 2 | O5 | 1.7 | SFO 59, SFO 60 |
| NGC 3503 | vBH 46a | B0 Ve | 2.9 | SFO 61–63 |
| HD 305938 | B1 V | |||
| BBW 347 | LSS 2231 | B0 V | 2.7 | SFO 64 |
| RCW 62 | HD 101131 | O6.5 N | 1.4 | SFO 65–70 |
| HD 101205 | O6.5 | |||
| HD 101436 | O7.5 | |||
| (Cen R 1) | vBH 59 | B6 I | 2.0 | SFO 71 |
| RCW 75 | HD 115455 | O7.5 III | 1.9 | SFO 72, SFO 73 |
| RCW 85 | HD 124314 | O6 V | 1.5 | SFO 74 |
| RCW 98 | LSS 3423 | O9.5 IV | 2.8 | SFO 75 |
| RCW 105 | HD 144918 | O7 | 1.8 | SFO 76 |
| ( Sco) | HD 147165 | B1 III | 0.15 | SFO 77, SFO 78 |
| CCDM J162122536AB | B1 | |||
| RCW 108 | HD 150136 | O5 III | 1.4 | SFO 79–81 |
| HD 150135 | O6.5 V | |||
| RCW 113/116 | HD 152233 | O6 III | 1.9 | SFO 82–85 |
| HD 326286 | B0 | |||
| HD 152245 | B0 Ib | |||
| RCW 134 | HD 161853 | O8 V | 1.6 | SFO 86 |
| M 8 | HD 164794 | O4 V | 1.9 | SFO 87, SFO 88 |
| S 29 | HD 165921 | O7.5 V | 1.9 | SFO 89 |
We estimate the predicted ionising photon flux () illuminating the Type 1 BRCs from the tables of Panagia (panagia (1973)) and the projected distance between the star(s) and each cloud. is a strict upper limit to the ionising flux illuminating the cloud, due to the fact that the projected star-cloud distance represents a lower limit to the actual distance between the ionising star and the cloud. The values of that we determined by this approach are listed in Table 5 alongside the values of derived from Eq. (1) and the measured radio flux densities. In most cases it can be seen that to within at least a factor of 10 as is expected.
Several clouds do not, however, follow this trend (notably SFO 61a, SFO 63, SFO 77, SFO 78, SFO 82b, SFO 83 and SFO 84). The most likely reason behind this is that the ionising stars we have identified are not those responsible for exciting the rims of the BRCs or that their spectral classifications are incorrect (even a misclassification by only half a spectral class can increase or decrease the predicted Lyman flux by a factor of 2). Further investigation and classification of the stars exciting the HII regions is required, perhaps including optical spectroscopy in order to determine the stellar spectral types independent of any reddening effects.
3.3 Upper limits to the ionising flux for non-detected clouds
For those clouds that do not exhibit any associated radio emission we were able to derive an upper limit () to the ionising flux illuminating their surfaces by substituting a 3 upper limit for the radio flux density into Eq. (1). The wavelength used in the derivation of the ionising flux upper limit was typically the longest of the two wavelengths at which each cloud was observed, as the larger beams of the longer wavelengths allow tighter constraints to be placed upon . Values of the 3 flux limit and the wavelength used in the derivation of the observed upper limit to the ionising flux are given in Table 7.
| Source ID | 3 flux upper limit | Cloud Radius | Max. observed ionising flux | Predicted ionising flux | |
|---|---|---|---|---|---|
| (cm) | (mJy) | (pc) | (106 cm-2 s-1) | (106 cm-2 s-1) | |
| SFO 45 | 20 | 5.16 | 0.30 | 24 | 38 |
| SFO 46 | 13 | 0.75 | 0.05 | 18 | 13 |
| SFO 48 | 20 | 2.58 | 0.01 | 20 | 15 |
| SFO 50 | 20 | 3.60 | 0.05 | 21 | 41 |
| SFO 51 | 20 | 2.82 | 0.15 | 19 | 69 |
| SFO 52 | 20 | 9.45 | 0.20 | 78 | 8.6 |
| SFO 53 | 20 | 9.60 | 0.10 | 84 | 9.0 |
| SFO 54 | 20 | 5.10 | 0.21 | 36 | 0.6 |
| SFO 55 | 20 | 1.50 | 0.48 | 11 | 23 |
| SFO 60 | 20 | 360.00 | 0.12 | 2900 | 2500 |
| SFO 71 | 13 | 4.10 | 0.61 | 140 | 0.06 |
| SFO 72 | 20 | 10.80 | 0.54 | 92 | 820 |
| SFO 73 | 13 | 3.00 | 0.27 | 100 | 190 |
| SFO 80 | 20 | 30.00 | 0.28 | 220 | 230 |
| SFO 81 | 13 | 6.90 | 0.19 | 190 | 270 |
| SFO 86 | 13 | 3.00 | 0.36 | 56 | 1600 |
| SFO 87 | 20 | 126.00 | 0.43 | 500 | 1300 |
| SFO 88 | 20 | 78.00 | 0.40 | 300 | 990 |
We again compare the upper limit to the ionising flux derived from the observations to that predicted from the spectral type and location of the suspected ionising star given by Yamaguchi et al. (ysmmmof99 (1999)). The predicted ionising flux illuminating each cloud () was evaluated following the procedure outlined in Sect. 3.2 and using the stars and spectral types contained in Table 6.
Comparing the values of to contained in Table 7 reveals that for roughly half of the clouds (8 clouds in total) the lack of detectable radio emission is fully consistent with the predicted ionising flux. For these clouds our observations show that the lack of detectable radio free-free emission from the ionised boundary layer is consistent with the ionising fluxes emitted from the suspected ionising stars identified in Table 6. The sensitivity of our observations was ultimately restricted by the relatively limited -plane coverage that we could devote to each cloud and confusing flux introduced by sidelobes from nearby bright objects. Deeper observations with better -plane coverage are required to detect any free-free emission from the ionised boundary layers in these clouds.
The remaining eleven clouds listed in Table 7 have predicted ionising fluxes that are inconsistent with the upper limits derived from our observations (i.e. ). For the majority of the clouds this is more than likely due to the differences between the true star-cloud distance and the projected distance that we measure on the sky, and/or the negligible UV absorption assumptions inherent in our calculation of the predicted ionising flux . For example, if the star-cloud vector is inclined by 60° to the line-of-sight, then the true distance between the ionising star and the bright-rimmed cloud is increased by a a factor of 15% and the predicted ionising flux will decrease by 30%.
Changes in the predicted ionising flux of a factor of a few may be plausibly explained by the projected distance between the ionising star and the bright-rimmed cloud, but there are two clouds in Table 7 (SFO 72 and SFO 86) with predicted ionising fluxes that are roughly an order of magnitude greater than the maximum ionising flux determined from the survey observations. It is unlikely that the disparity in predicted and observed ionising flux limits can be explained by geometric effects alone. We will investigate these two clouds in more detail in Sect. 4.2.
3.4 Embedded radio sources – compact HII regions?
| Source Id | IRAS PSC ID | IR Luminosity | Spectral type | Flux density | Ionising photon flux | Spectral type |
|---|---|---|---|---|---|---|
| (/) | (IR) | (mJy) | Log (Ni) | (Radio) | ||
| SFO 59 | 08563–4711 | 13000 | B0.5 | 10400 | 48.4 | O8 |
| SFO 62 | 10591–5934 | 18000 | B0–B0.5 | 126 | 47.3 | B0 |
| SFO 74 | 14159–6111 | 5500 | B1 | 26.3 | 45.5 | B1 |
| SFO 79 | 16362–2501 | (4400) | B1 | 4800 | 47.9 | O9.5 |
| SFO 85a | 16555–4237 | 18000 | B0.5 | 40.3 | 45.9 | B0.5–B1 |
Four Type 3 radio sources were detected in the survey: SFO 59, SFO 74, SFO 79 and SFO 85a. These sources are strong (with radio fluxes of several tens of mJy to over a Jy), mostly unresolved, displaced from the bright cloud rim and associated with compact MSX mid-infrared emission. The positions of the unresolved radio emission are coincident with the IRAS and MSX point source positions. The characteristics of these sources are similar to compact or ultracompact HII regions, i.e. they are infrared luminous ( 103–104 ) compact radio sources associated with molecular clouds (and possibly deeply embedded within the clouds). In addition the IRAS colours of these sources meet the criteria proposed by Wood & Churchwell (wc89 (1989)) for ultracompact HII regions, namely that and . It is possible that these sources may be compact or ultracompact HII regions embedded within the BRCs.
In order to investigate the physical nature of these sources we have calculated their far-infrared (FIR) and radio luminosities so that we may determine the spectral class of any potential embedded massive Young Stellar Objects (YSOs). The FIR luminosity from an embedded YSO is almost entirely due to the processing of absorbed stellar radiation from circumstellar dust and so the FIR luminosity can be used to estimate the bolometric luminosity and spectral class of the embedded YSO.
We assume that the FIR luminosity arises from a single embedded star and estimate the luminosity from the integrated IRAS fluxes. Given the rather coarse scale of the IRAS FWHM beam this is an unrealistic assumption and the emission may arise from an embedded cluster instead of a single object. Nevertheless, Wood & Churchwell (wc89 (1989)) showed that for a realistic initial mass function estimate the spectral type of the most massive member in a cluster is only 1.5–2 spectral classes lower than that derived for the single embedded star case. The resulting FIR luminosity was corrected following the method of Sugitani & Ogura (so94 (1994)) to take into account contributions from the flux longwards of 100 m. Distance estimates to the embedded sources were also taken from Sugitani & Ogura (so94 (1994)).
It is also possible to independently derive the spectral type from the observed radio flux. In this case the radio flux is due to free-free emission originating from an embedded compact or ultracompact HII region. If the HII region is assumed to be optically thin at radio wavelengths and in photoionisation equilibrium (i.e. the number of photons ionising new material is balanced by the recombination rate) then the integrated radio flux may be related to the total number of ionising photons emitted from the star powering the HII region (e.g. Wood & Churchwell wc89 (1989); Carpenter et al. css90 (1990)). The tables of Panagia (panagia (1973)) can then used to convert the ionising photon flux into a spectral type.
In order to derive the ionising photon flux emitted from the massive YSOs we used Eq. (7) from Carpenter et al. (css90 (1990)) relating to the radio flux density, i.e.
| (4) |
where is measured in units of photons s-1, is the integrated radio flux density of the embedded radio source in mJy, is the distance to the BRC in kpc and is the frequency at which the integrated flux density is determined. Note that we have removed the 5 GHz term from Eq. (7) of Carpenter et al. (css90 (1990)) and adjusted the equation coefficient accordingly.
The radio and infrared derived spectral types of the four Type 3 sources in our survey are listed in Table 8. To this list we also add SFO 62, which is the only Type 2 broken-rimmed cloud in the survey. We included SFO 62 as it seems likely that it is a more evolved YSO cluster on the verge of breaking free from its natal molecular cloud (see Sect. 3.1 & Fig. 1). It is useful to compare the physical properties of the cluster associated with SFO 62 to those of its presumably less evolved cousins.
As can be seen from Table 8 all of the Type 3 sources are associated with either late O-type stars or early B-type stars. It is thus highly likely that these sources are massive YSOs surrounded by compact or ultracompact HII regions and embedded within the molecular material of the bright-rimmed clouds. The infrared and radio-derived spectral types agree surprisingly well, which may indicate that the UV radiation within the embedded compact HII region is not significantly absorbed by dust within the ionised gas (Wood & Churchwell wc89 (1989)). In order to confirm this hypothesis sub-millimetre or millimetre-wave continuum observations are required to constrain the spectral energy distribution longward of 100 m and confirm our estimate of the IRAS luminosity correction factor. We will discuss the nature of the embedded sources further in Sect. 4.
4 Discussion
4.1 Are the BRCs in pressure equilibrium?
A total of 18 clouds were identified as possessing detectable radio emission from their ionised boundary layers and classified as Type 1 radio sources. In this section we will examine the physical properties of the ionised boundary layers associated with these clouds and estimate the likely pressure balance between the ionised boundary layer (IBL) and the interior molecular gas of the BRC. The pressure balance between the ionised and neutral components of BRCs has been revealed as a sensitive diagnostic of their status (Lefloch & Lazareff ll94 (1994)). The photoionisation-induced shocks that are implicated as potential star-formation triggers (e.g. Elmegreen e91 (1991); Sugitani et al. sfo (1991); Sugitani et al. sfmo89 (1989)) are restricted from propagating into the clouds if the pressure in the ionised boundary layer is less than that in the interior neutral gas of the cloud. The pressure imbalance causes the photo-ionisation shocks to stall at the surface of the cloud (Lefloch & Lazareff ll94 (1994)).
Radiative-driven implosion (RDI) modelling of BRCs shows that the evolution of the cloud is mainly dependent upon the duration of its ionisation (Lefloch & Lazareff ll94 (1994); Bertoldi bertoldi (1989)). Due to the increasing recombination in the ionised boundary layer the pressure of the layer rises over time and clouds that were initially over-pressured will eventually reach equilibrium. This feature of BRC evolution allows us to separate out those clouds that are potential regions of induced star formation for further study. If the clouds are currently overpressured with respect to their IBL then it is unlikely that photoionisation shocks are propagating (or have propagated) through the molecular gas of the clouds. It is thus doubtful that any existing star formation within these over-pressured clouds could have been caused by the photoionisation of the clouds. Conversely, if the clouds are underpressured with respect to their IBL then it is highly likely that photoionisation-induced shocks are propagating into the cloud and this raises the possibility that the star formation within the clouds could have been induced by the action of the nearby OB star or stars.
We have determined the pressure in the ionised boundary layers from our radio continuum observations for the 18 BRCs classed as Type 1 radio sources. Values for the ionised gas pressure over Boltzmann’s constant range from 2.8 105 to 3.3 107 cm-3 K, with a median value of a few 106 cm -3 K. We estimate that, due to a combination of measurement errors and uncertainities in the relative IBL thickness (), the pressure of the ionised gas in underestimated by no more than a factor of two. In order to evaluate the pressure of the neutral molecular gas in the interior of the BRCs we require molecular line data in order to constrain the velocity dispersion of the molecular gas from the width of molecular rotation lines and the density of the molecular gas from the integrated intensity of the emission.
The overall molecular pressure is comprised of both thermal and turbulent contributions, but under typical molecular cloud conditions the turbulent pressure component dominates (as evidenced by suprathermal linewidths; e.g. Larson larson81 (1981)). Neglecting the thermal pressure component, the molecular pressure may be written as , where is the velocity dispersion and is the density of the gas. The velocity dispersion can be expressed in terms of the observed FWHM linewidth as .
There are few existing molecular line observations of these clouds and currently the most comprehensive study is that of Yamaguchi et al. (ysmmmof99 (1999)), who carried out wide-field mapping of the HII regions from Sugitani & Ogura (so94 (1994)) using the NANTEN 4m telescope. We originally attempted to determine the density and velocity dispersion for each of the 18 clouds possessing measurable ionised boundary layers by using the 13CO observations of Yamaguchi et al. (ysmmmof99 (1999)). However the combination of coarse resolution and sensitivity meant that not all of the clouds in Table 5 were detected (of the 18 clouds in our sample Yamaguchi et al. (ysmmmof99 (1999)) detected only 8). The maps of these clouds have an intrinsic resolution of 4′ due to non-Nyquist sampling of the NANTEN 2.7′ beam, and so almost all of the clouds in our sample were unresolved and/or blended with nearby emission.
With the existing data it is not possible to determine the individual properties of each cloud. Nevertheless we have used the results from Yamaguchi et al. (ysmmmof99 (1999)) to derive a global mean of the density and velocity dispersion, which we apply to our entire sample of BRCs from Table 5. Whilst we cannot definitively prove that individual clouds are under- or over-pressured using this approach, we can nevertheless identify those clouds in our sample with ionised boundary layer pressures that deviate significantly from the mean molecular pressure. These clouds are then the likeliest candidates to be in pressure imbalance.
The mean FWHM linewidth of the 8 clouds detected by Yamaguchi et al. is 3.5 km s-1, which compares favourably to the linewidths of other BRCs that have been observed in 13CO or other molecular lines and which typically range between 1 and 3 km s-1 (e.g. Thompson et al. 2003a ; Codella et al. cbnst01 (2001); Lefloch et al. llc97 (1997)). The mean H2 number density of the clouds is 220 cm-3, which is about a factor of 50 less than typical star-forming regions (Evans et al. evans99 (1999)) and other bright-rimmed clouds (Thompson et al. 2003a ). Because Yamaguchi et al. only mapped the clouds in the ground state transition of 13CO (with some limited 12CO single-position spectra) it is not possible to accurately estimate the optical depth of 13CO. In addition the low critical density and dipole moment of the CO molecule mean that emission from low-density, low-temperature gas is preferentially sampled. As a result the mean density that we derive from the results of Yamaguchi et al. (ysmmmof99 (1999)) is likely to underestimate the true density within the clouds.
From the mean linewidth and density we evaluate a mean molecular pressure (over Boltzmann’s constant) for the clouds of 105 cm-3 K. Comparing this to the ionised boundary layer pressures in Table 5 reveals that the majority of the BRCs are potentially underpressured with respect to their ionised exteriors. However, as mentioned in the previous paragraph, it is possible that the mean molecular density of the clouds may be underestimated due to optical depth effects or the fact that the 13CO ground-state transition preferentially samples low-density gas. It is also possible that the 13CO at the molecular boundary of the clouds may be depleted by selective photodissociation (van Dishoeck & Black vdhb88 (1988)), leading to an underestimate of the true H2 number density of the cloud. The 13CO-derived densities have been shown to be almost an order of magnitude lower than the sub-mm continuum-derived densities for three Northern Hemisphere BRCs (Thompson et al. 2003a ), although the underlying cause of the depleted 13CO abundance is still unclear.
Taking all of these uncertainties into consideration we estimate that the mean molecular density (and hence pressure) is likely to be underestimated by no more than a factor of 15. Yamaguchi et al. (ysmmmof99 (1999)) conclude that in the worst-case scenario their column density values are within 15% of the true value and in order to account for any possible selective photodissociation of 13CO we assume a 13CO depletion factor of 10 (Thompson et al. 2003a ). Using this scaling factor we estimate that the mean molecular pressure is in reality closer to cm-3 K. This molecular pressure is close to the ionised boundary layer for the majority of our sample and we thus conclude that it is likely that most of the clouds in Table 5 are in pressure equilibrium.
If the molecular pressure of the clouds is around cm-3 K and most of the clouds are in pressure equilibrium, then those clouds with the highest and lowest ionised boundary layer pressures are the likeliest examples of clouds in pressure imbalance. SFO 58b and SFO 61 possess IBL pressures of only cm-3 K and are thus likely to be underpressured with respect to their IBLs unless they are quiescent (i.e. low turbulent velocity and small observed FWHM linewidth) or of extremely low density ( cm-3). These two clouds are thus in the initial evolutionary phase described by Lefloch & Lazareff (ll94 (1994)) where the photoionisation-induced shocks are stalled at the cloud surface until the ionised boundary layer pressure equilibrates with the internal molecular cloud pressure. Conversely SFO 75, SFO 77 and SFO 78 all possess IBL pressures in excess of 107 cm-3 and unless the molecular gas in these clouds has a high velocity dispersion or density, it is unlikely that they are overpressured with respect to their IBLs. These three clouds are the strongest candidates to possess photoionisation-induced shocks propagating into their interiors.
We must stress however, that these results are based upon a global average value for the mean cloud density derived from large-beam 13CO observations of only 8 clouds. Higher resolution molecular line observations of individual clouds in different molecular species are required to determine their molecular densities, explore the isotopomer-selective photodissociation reported by van Dishoeck & Black (vdhb88 (1988)) and investigate their pressure balance. We have begun a study of this type with the Mopra 22m and SEST 15m millimetre-wave telescopes and will report the results in forthcoming papers (Urquhart et al. urquhart2003 (2003); Thompson et al. 2003b ).
4.2 The candidate ionising stars of SFO 72 and 86
As mentioned in Sect. 3.3 the two clouds SFO 72 and SFO 86 possess predicted ionising fluxes that are largely inconsistent with our observations. It is unlikely that these inconsistencies can be explained by geometric effects alone; for SFO 86 in particular the star-cloud vector must be inclined by less than 10° to the line-of-sight to bring the predicted ionising flux into line with the observational limit.
We investigated wider-field optical and MSX 8 m images of these two sources to search for signs of any optical extinction or mid-infrared emission from hot dust in the HII region (which may absorb a significant fraction of the UV radiation emitted from the stars) and to attempt to ascertain whether the ionising star could be in a foreground or background position. If the star is located in the foreground position then we would expect to see the bright optical front face of the cloud perhaps combined with broad PDR 8m emission across the face of the cloud. If the star however lies behind the cloud then we would expect the Earth-facing side of the cloud to be dark in the optical but should still see a broad PDR positionally coincident with the cloud as the cloud is likely to be optically thin to the 8m emission . A good example of this is SFO 68, where the optical rim of the cloud is partially shielded by the dark molecular material, but the 8m emission indicates that there is a PDR located on the rearward face of the cloud.
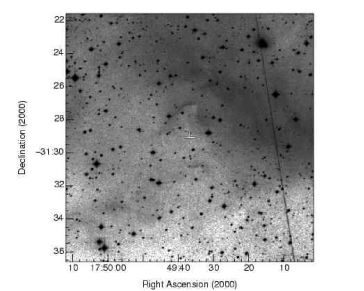
There is no detectable 8m emission associated with SFO 86 or its surrounding HII region, although there is a considerable amount of confusing emission in the red Digitised Sky Survey image (see Fig. 2). The cloud appears to be embedded in the parent HII region and the visible face of the cloud is optically bright, possibly indicating that the ionising star is located in the foreground. It is impossible to ascertain the degree of inclination from the optical image, but if the star from Table 6 is responsible for the bright-rimmed appearance and ionisation of the cloud then it must be located at least 5 times further from the cloud than its projected distance suggests. It is likely that BRC 86 is being ionised at a much lower level than expected (107 cm-2 s-1) because the nearby massive stars exciting the HII region are much more distant that previously suspected.
SFO 72 has a markedly different appearance to SFO 86 in the optical and mid-infrared (Fig. 3). The cloud is the tip of a long finger of extinction stretching for some 8′ to the east before merging into a larger area of extinction. A bright cluster of stars is visible at the tip of the finger of extinction. The MSX 8m emission is localised around this cluster, signifying a compact PDR or hot dust emission. However, no radio emission is associated with the finger or the star cluster down to a level of 10.8 mJy. The suspected ionising star of this cloud is HD 115455, an O7.5 III star located 5′ to the NW of the finger tip (and off the visible portion of Fig. 3).
We can draw several conclusions from the appearance of SFO 72 in the optical and mid-infrared and its non-detection in the radio. The compact appearance of the 8m emission suggests that it is centred upon either a compact HII region or a PDR but the morphology of the 8m emission is curved away from the finger-shaped cloud traced by the optical extinction, suggesting that the emission is breaking free from the tip of the finger. The 8m emission is centred on the star CPD61 3587, which is a member of the open cluster Stock 16 (Turner turner85 (1985)) and is variously reported as either an 07.5 III (Lynga lynga69 (1969)) or a B2 V type star (Herbst herbst75 (1975)). The upper limit of 10.8 mJy that we measured at 20 cm for this BRC rules out the possibility that CPD61 3587 is an O7.5 star, as from our upper flux limit Eq. (4) suggests that we would have detected free-free emission from an HII region excited by stars earlier than type B1.
The edge of the finger-shaped cloud is not traced in either 8m emission or radio free-free emission, which suggests that the edges of this cloud are weakly ionised at best ( cm-2 s-1). The edges of the finger do not display strong bright-rimmed emission in the red Digitised Sky Survey image and the overall appearance is that the cloud is illuminated on its rearward face. SFO 72 is thus likely to lie in the foreground of its exciting star and if the responsible star is the O7.5 III giant HD 115455 (Yamaguchi et al. ysmmmof99 (1999)) then the distance between the cloud and star must be greater than 93.5 pc. Given this large distance and the fact that the E-W orientation of the finger does not align with the direction toward HD 115455 we suggest that it is not this star that has shaped the evolution of the finger of SFO 72.
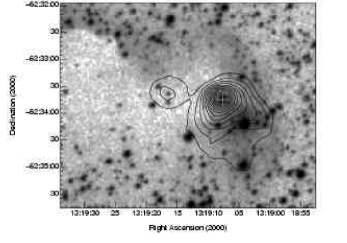
The 09.5 V star HD 115071 (also known as V961 Cen, LS 2998 or HIP 6437) is also a member of the open cluster Stock 16 (Penny et al. pgwsl02 (2002)) and is located 21′ to the west of SFO 72, which corresponds to a projected distance of 11.6 pc. The ionising flux from this star at this assumed distance ( cm-2 s-1) is consistent with our radio limits for that illuminating the cloud ( cm-2 s-1). The overall picture of this region is that the finger assocated with SFO 72 lies some 100 pc in the foreground of the most massive star powering the expansion of the HII region RCW 75, the O7.5 giant HD 115455. The nearby O9.5 V star HD 115071, which is located some 11.6 pc to the west, has been primarily responsible for shaping the morphology of the finger-shaped cloud and possibly clearing the molecular material away from the recently formed PDR surrounding CPD61 3587 at the tip of the finger.
The description of the region surrounding SFO 72 underlines the powerful technique of combining the optical, mid-infrared and radio images of these regions in order to identify the stars responsible for ionising the BRCs, to constrain their orientation and location with respect to the clouds and to crucially measure the ionising radiation impinging upon the surface of the clouds. The molecular material of the clouds is optically thin to the mid-infrared and radio emission which means that the significant extinction and confusion present in the optical images can be avoided. In addition the cross-correlation of the radio and mid-infrared images allows those radio sources that are not associated with rims of the BRCs (the Type 4 sources) to be removed from the sample. Future studies aimed at the identification of bright-rimmed clouds should take note of the advantages of the multi-wavelength approach in identifying the location and orientation of these clouds to their exciting sources.
4.3 The nature of the embedded sources
In Sect. 3.4 we showed that the far-infrared and radio luminosities of the Type 3 and Type 2 radio sources identified in the survey are consistent with the hypothesis that they are embedded massive YSOs or young stellar clusters (see Table 8). Here, we will examine this hypothesis in more detail so that we may explore the nature of the embedded sources and investigate whether their formation can be linked to the action of the nearby OB stars responsible for ionising the clouds.
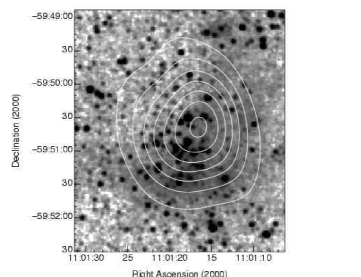
We carried out a search of the literature and the SIMBAD database of astronomical catalogues in order to determine whether the embedded sources were previously discovered prior to our survey. We found that almost all of the embedded sources (including the source SFO 82b, which was originally classified as a Type 1 source) have been identified as embedded stellar clusters in a recent near-infrared survey of the Milky Way (Bica et al. bdb03 (2003); Bica et al. 2003b ; Dutra et al. dbsb03 (2003)). The only source not identified in these catalogues is the broken-rimmed cloud SFO 62. We present a 2MASS band image of SFO 62 in Fig. 4, which shows that the cluster of stars located in the broken-rim of the cloud displays the same characteristics as the loose infrared clusters identified by Dutra et al. (dbsb03 (2003)). It is not known why SFO 62 does not appear in the cluster catalogue of Dutra et al. (dbsb03 (2003)), although SFO 62 is displaced by ′ from the center of its 2MASS “plate” and perhaps for this reason was missed from the 5′5′ fields that Dutra et al. (dbsb03 (2003)) centred on each of the nebulae in their search.
The literature search also revealed that SFO 59 and SFO 79 are respectively associated with the infrared stellar clusters vdBH RN26 IRC and RCW 108 IRC (Bica et al. 2003). SFO 74 is associated with two embedded infrared sources LLN93 IRS 30-1 and 30-2, which are classified as having a spectral type as early as B5 V (Liseau et al. 1992) ). As the IRAS sources associated with these clouds (Sugitani & Ogura so94 (1994)) follow the Wood & Churchwell (wc89 (1989)) IRAS colour criteria for embedded ultracompact HII regions, several of the embedded sources have been part of ultracompact HII region surveys. SFO 59 and SFO 79 were surveyed for 6.7 GHz CH3OH maser emission by Walsh et al. (whrb97 (1997)) with negative results. SFO 79 also formed part of the search list of Bronfman et al. (bnm96 (1996)) and was detected in the J=2–1 line of CS, implying that the molecular density toward this region is of the order 104–105 cm-3.
All the embedded radio sources detected in our survey are thus revealed as luminous ( L⊙) infrared stellar clusters that have begun to ionise their surroundings and form compact HII regions. The clusters must be relatively young as their IR and radio emission indicate that they contain late O-type to early B-type stars, which have a main sequence lifetime of yrs. Most of the embedded regions are at best marginally resolved in our radio survey (with the exception of SFO 59) and so we cannot estimate the age of the compact HII regions by directly measuring their radio diameter and estimating their expansion rate. However, it is unlikely that they are in the ultracompact HII region phase because they have begun to clear their surroundings sufficiently as to be visible in the near-infrared and optical wavelength ranges, which we would not expect to be the case for the deeply embedded ultracompact HII region phase (e.g. Testi et al. tfpr94 (1994)). SFO 59 is extended on the scale of our ′ FWHM beam and so this object is certainly not an ultracompact HII region. The ultracompact phase lasts for years and so we estimate that the age of the embedded clusters is between 105 and years. Higher resolution radio observations are required to resolve the radio emission and determine the spatial size of the embedded compact HII regions.
This maximum age is very similar to the age of the large HII regions (typically 1–2 Myr) at the edges of which the BRCs are found and so it is almost impossible to determine whether the stars that are powering the HII regions are responsible for inducing the formation of the stellar clusters. Hoever, even for the more embedded clusters there has been sufficient time since the formation of the massive stars powering the HII region for photoionisation-induced shocks to travel deep inside the clouds and perhaps affect the star formation process. For example, the cluster associated with SFO 79 is located approximately 3′ from the bright rim of the cloud, which corresponds to a distance of 1.2 pc at the assumed distance to SFO 79 (see Table 6). The typical shock velocities induced by the photoionisation of the BRC surface layers range from 1–2 km s-1 (Thompson et al. 2003a ; White et al. whiteeagle (1999)) and at this velocity the shocks would require only years to traverse the distance from rim to cluster.
Whilst we cannot conclude whether the formation of the embedded clusters was due to the UV illumination from the nearby OB stars, we have nevertheless succeeded in showing that these BRCs are intimately involved in the star formation process. At least 7 clouds from our original sample of 45 have been shown to be associated with young stellar clusters containing high to intermediate-mass stars (including SFO 72 and SFO 82b, which were originally classed as a non-detection and a Type 1 rim source respectively). This is in line with the higher IRAS luminosities found for BRCs over isolated star-forming regions such as Bok globules (Sugitani et al. smmto00 (2000), sfo (1991)), which suggest that BRCs may preferentially form stellar clusters or significantly higher-mass stars than Bok globules. Further work is required in order to determine whether the formation of stars in these regions was induced by the external action of the nearby OB stars, particularly higher-resolution radio continuum observation to measure the spatial diameters of the compact HII regions and constrain their ages and optical/infrared spectroscopy to provide more accurate age estimates for the stars contained in the clusters.
A more detailed theoretical treatment of the star formation processes in these clouds is also needed, as the RDI models of Bertoldi (bertoldi (1989)) and Lefloch & Lazareff (ll94 (1994), ll95 (1995)) do not specifically address the issue of star formation within these clouds. High-resolution molecular line and millimetre/sub-millimetre continuum observations of the clouds could provide the necessary physical parameters to model the star formation within these clouds and potentially identify star-forming regions that were induced by the external action of a nearby OB star.
5 Summary and conclusions
We have carried out a radio-wavelength imaging survey of 45 bright-rimmed clouds (BRCs) with the Australia Telescope Compact Array, with the aim of measuring the physical conditions in their ionised boundary layers. We detected radio emission from a total of 25 clouds and using a combination of optical Digitised Sky Survey images and mid-infrared MSX 8m images classified the radio emission into 4 types. The four types are: Type 1 bright-rimmed clouds, Type 2 broken-rimmed clouds, Type 3 embedded radio sources and Type 4 unassociated radio sources.
Type 1 sources are those where the radio emission follows the bright optical rim of the cloud and correlates closely with the MSX 8m emission, which is a tracer of the photon-dominated surface layers of these clouds. Eighteen Type 1 clouds were detected in the survey and we evaluated the incident ionising photon flux, electron density and ionised gas pressure for their ionised boundary layers. With this sample we have more than doubled the existing number of BRCs with known ionised boundary layer conditions (e.g. Thompson et al. 2003a ; White et al. whiteeagle (1999); Megeath & Wilson mw97 (1997); Lefloch et al. llc97 (1997)). Type 2 sources are those clouds where the radio and 8m emission is positionally correlated, but the optical appearance of the cloud resembles the well known broken-rimmed globule CG 4 (Reipurth reipurth83 (1983); González-Alfonso et al. g-acr95 (1995)). Only one Type 2 source was identified (SFO 62).
Type 3 sources are strong radio emitters that are both positionally coincident with luminous mid-infrared sources and embedded within the bright-rimmed clouds rather than located at the edge. The high infrared and radio luminosities of these objects imply that they are embedded stellar clusters containing late O and early B-type stars. Four type 3 sources were detected in the survey. Type 4 sources are radio sources that are either not positionally coincident with the optical or mid-infrared emission tracing the clouds or whose morphology does not follow the optical or mid-infrared morphology of the clouds. It is possible that a number of Type 4 sources represent free-free emission associated with the clouds but observations of higher sensitivity and resolution than our survey are required to make a definitive statement.
We draw the following conclusions from our survey:
-
1.
Comparing the pressure of the ionised gas in the ionised boundary layer to a global estimate of the internal molecular pressure of BRCs indicates that the majority of the clouds are in pressure equilibrium. It is thus highly likely that photoionisation-induced shocks are currently propagating into these clouds, in line with the predictions of the radiative-driven implosion (RDI) models of Lefloch & Lazareff (ll94 (1994)) and Bertoldi (bertoldi (1989)).
-
2.
The two clouds SFO 58b and SFO 61a have the lowest ionised boundary layer pressures and are thus the most probable clouds where the interior molecular pressure could exceed the exterior ionised gas pressure. These clouds are presumably in the evolutionary phase prior to that of pressure balance between their interior and exterior (Lefloch & Lazareff ll94 (1994)). In this phase the photoionisation-induced shocks are stalled at the ionised boundary of the cloud until the pressure in the ionised boundary layer rises and equilibrates with the interior molecular pressure of the cloud.
-
3.
In most cases the physical properties of the ionised boundary layers are consistent with their expected ionisation from the OB stars responsible for exciting the large HII regions at the edges of which the clouds are found. Where the predicted ionising flux illuminating the clouds is greater than that derived from the observations we have shown that differences of a factor of a few can be readily explained by projection effects. For a number of clouds the predictions and observations cannot be reconciled and we suggest that there are additional ionising sources present within the HII regions. A SIMBAD database search revealed several additional OB stars but their overall contribution to the ionising flux is still insufficient to match the observations. Either the spectral types of the known stars are earlier than estimated or there are additional ionising stars located within the HII regions.
-
4.
Using a multi-wavelength approach combining the radio, mid-infrared and optical data, we show that the ionising star of SFO 72 is not the O7.5 star HD 115455, as originally thought, but is more likely to be the O9.5 star HD 115071, which lies some 21′ to the west of SFO 72. The non-detection of this cloud in the radio suggests that it is located at least 93.5 pc in the foreground of HD 115455. An embedded cluster is currently breaking free from the molecular gas at the tip of SFO 72 and from our radio upper limit we constrained the earliest star within this cluster to be B1, consistent with the observations of Herbst (herbst75 (1975)).
-
5.
The 4 embedded Type 3 radio sources detected in the survey are shown to be embedded stellar clusters containing late O and early B-type stars. All of the embedded sources are indentified with infrared stellar clusters found in recent 2MASS surveys (Bica et al. bdb03 (2003); Bica et al. 2003b ; Dutra et al. dbsb03 (2003)) or in 2MASS images downloaded as part of this paper (see Fig. 4). Three more BRCs are also found to be associated with stellar clusters which have either disrupted their natal molecular cloud (SFO 62) or are on the verge of breaking free from the molecular gas (SFO 72 & SFO 82b). Each of these clusters is sufficiently luminous in the far-infrared or radio to contain at least early B-type stars and thus we have shown that bright-rimmed clouds are implicated in the formation of high to intermediate mass-stars. However, further observations and modelling are required to investigate whether this star formation may have been induced by the external action of the OB star or stars ionising the bright-rimmed clouds.
Acknowledgements.
The authors would like to thank the Director and staff of the Paul Wild Observatory, Narrabri, New South Wales, Australia for their hospitality and assistance during the observing run. We would also like to thank Michael Burton for useful discussions regarding the mid-infrared emission from the clouds. MAT is supported by a PPARC postdoctoral grant and JSU by a PPARC doctoral studentship. This research would not have been possible without the SIMBAD astronomical database service operated at CCDS, Strasbourg, France and the NASA Astrophysics Data System Bibliographic Services. The Digitized Sky Survey was produced at the Space Telescope Science Institute under U.S. Government grant NAG W-2166. The images of these surveys are based on photographic data obtained using the Oschin Schmidt Telescope on Palomar Mountain and the UK Schmidt Telescope. The plates were processed into the present compressed digital form with the permission of these institutions. Quicklook 2.2 m 2MASS images were obtained as part of the Two Micron All Sky Survey (2MASS), a joint project of the University of Massachusetts and the Infrared Processing and Analysis Center/California Institute of Technology, funded by the National Aeronautics and Space Administration and the National Science Foundation. This research made use of data products from the Midcourse Space Experiment. Processing of the data was funded by the Ballistic Missile Defense Organization with additional support from NASA Office of Space Science. This research has also made use of the NASA/ IPAC Infrared Science Archive, which is operated by the Jet Propulsion Laboratory, California Institute of Technology, under contract with the National Aeronautics and Space Administration.References
- (1) Bertoldi, F., 1989, ApJ, 346, 735
- (2) Bertoldi, F., McKee, C.F., 1990, ApJ, 354, 529
- (3) Bica, E., Dutra, C. M., & Barbuy, B. 2003, A&A, 397, 177
- (4) Bica, E., Dutra, C. M., Soares, J., & Barbuy, B. 2003, A&A, 404, 223
- (5) Bock, D. C.-J., Large, M. I., & Sadler, E. M. 1999, AJ, 117, 1578
- (6) Bronfman, L., Nyman, L.-A., & May, J. 1996, A&AS, 115, 81
- (7) Carpenter, J. M., Snell, R. L., & Schloerb, F. P. 1990, ApJ, 362, 147
- (8) Codella, C., Bachiller, R., Nisini, B., Saraceno, P., & Testi, L. 2001, A&A, 376, 271
- (9) Condon, J.J., Cotton, W.D., Greisen, E.W., Yin, Q.F., Perley, R.A., Taylor, G.B.,Broderick, J.J., 1998, AJ, 115, 1693
- (10) Cornwell, T., Braun, R., Briggs, D.S., 1999, in Synthesis Imaging in Radio Astronomy II, eds. G.B. Taylor, C.L. Carilli, R.A. Perley, ASP Conf. Ser., 180, 151
- (11) van Dishoeck, E.F., Black, J.H., 1988, ApJ, 334, 771
- (12) Dutra, C. M., Bica, E., Soares, J., & Barbuy, B. 2003, A&A, 400, 533
- (13) Eggen, O. J. 1998, AJ, 116, 1314
- (14) Elmegreen, B.G., 1991, in The Physics of Star Formation and Early Stellar Evolution, eds. C.J. Lada & N.D. Kylafis (Dordrecht:Kluwer), 35
- (15) Evans, N.J., II, 1999, ARA&A, 37, 311
- (16) Gooch, R.E., 1995, in Astronomical Data Analysis Software & Systems IV, ed. RA. Shaw, H.E. Payne & J.J.E. Hayes, ASP Conf. Ser., 77, 144
- (17) Gonzalez-Alfonso, E., Cernicharo, J., & Radford, S. J. E. 1995, A&A, 293, 493
- (18) Hester, J.J., Scowen, P.A., Sankrit, R. et al., 1996, AJ, 111, 2349
- (19) Herbst, W. 1975, AJ, 80, 212
- (20) Larson, R.B., 1981, MNRAS, 194, 809
- (21) Leger, A., Puget, J.L., 1984, A&A, 137, 5
- (22) Lefloch, B., Lazareff, B., 1994, A&A, 289, 559
- (23) Lefloch, B., Lazareff, B., 1995, A&A, 301, 522
- (24) Lefloch, B., Lazareff, B., Castets, A., 1997, A&A, 324, 249
- (25) Liseau, R., Lorenzetti, D., Nisini, B., Spinoglio, L., & Moneti, A. 1992, A&A, 265, 577
- (26) Lynga, G. 1969, Arkiv for Astronomi, 5, 181
- (27) Megeath, S. T. & Wilson, T. L. 1997, AJ, 114, 1106
- (28) Ogura, K., Sugitani, K., Pickles, A., 2002, AJ, 123, 2597
- (29) Panagia, N., 1973, AJ, 78, 929
- (30) Penny, L.R., Gies, D.R., Wise, J.H., Stickland, D.J., Lloyd, C., 2002, ApJ, 575, 1050
- (31) Price, S.D., Egan, M.P., Carey, S.J., Mizuno, D.R., Kuchar, T.A., 2001, AJ, 121, 2819
- (32) Reipurth, B. 1983, A&A, 117, 183
- (33) Sault, R.J., Teuben, P.J., Wright, M.C.H., 1995, Astronomical Data Analysis Software & Systems IV, ed. RA. Shaw, H.E. Payne & J.J.E. Hayes, ASP Conf. Ser., 77, 433
- (34) Sugitani, K., Fukui, Y., Mizuni, A., & Ohashi, N. 1989, ApJ, 342, L87
- (35) Sugitani, K., Fukui, Y., Ogura, K., 1991, ApJS, 77, 59
- (36) Sugitani, K., Ogura, K., 1994, ApJS, 92, 163
- (37) ugitani, K., Matsuo, H., Nakano, M., Tamura, M., & Ogura, K. 2000, AJ, 119, 323
- (38) Testi, L., Felli, M., Persi, P., & Roth, M. 1994, A&A, 288, 634
- (39) Thompson, M.A., White, G.J., Morgan, L.K., Miao, J., Fridlund, C.V.M., Huldtgren White, M., 2003a, submitted to A&A
- (40) Thompson, M.A., Morgan, L.K., White, G.J., 2003b, in preparation
- (41) Urquhart, J.S., Thompson, M.A., Morgan, L.K., White, G.J., 2003, in preparation
- (42) Turner, D.G., 1985, ApJ, 292, 148
- (43) Walsh, A. J., Hyland, A. R., Robinson, G., & Burton, M. G. 1997, MNRAS, 291, 261
- (44) White, G.J., et al., 1999, A&A, 342, 233
- (45) Wood, D. O. S. & Churchwell, E. 1989, ApJ, 340, 265
- (46) Yamaguchi, R., Saito, H., Mizuno, N., Mine, Y., Mizuno, A., Ogawa, H., & Fukui, Y. 1999, PASJ, 51, 791