Stellar Kinematics of the Bulge from HST Proper Motion Measurements
Abstract
I report on an ongoing programme of proper motion measurements in the Galactic Bulge, using HST images. As a first application, the data are used to derive the vertical gravitational acceleration on the minor axis of the Galaxy. Implications of the measurement for the flattening of the Galactic potential are discussed.
Leiden Observatory, PO Box 9513, 2300RA Leiden, The Netherlands
1. Introduction
Understanding the kinematics of the bulge is important for a number of reasons. We know that the Galaxy is barred, but unique detailed models are still lacking, in spite of great progress in this area (see the contributions at this conference by Merrifield and Englmaier). But our bulge should, and could, be the best-understood bar in the universe! Understanding the kinematics of the bulge requires an understanding of the gravitational potential that drives the stellar orbits, which in turn provides information on the central mass distribution of the Galaxy (halo, bulge/bar, disk). Stellar kinematics are described by phase-space distribution functions (DFs) which generically have three degrees of freedom; in the Bulge we have the opportunity to try to constrain such a DF by means of a data set of higher dimensionality (two projected spatial coordinates, two proper motion components, complemented by photometric line-of-sight distances and possibly radial velocities).
Once the kinematics are understood, they can be correlated with stellar population and used to build a picture of how the bulge/bar was formed. The kinematics of the bulge populations also form a key ingredient for the interpretation of microlensing statistics (see the review by Evans at this meeting).
2. Proper motion study of galactic bulge fields
The data archive of the Hubble Space Telescope (HST) is now over a decade old. It contains a wealth of images taken in the early and mid-nineties with the WFPC2 instrument, including several fields in the Galactic Bulge region. This paper describes our recent work on proper motions of large samples of bulge stars, which were obtained using these ‘early’ epochs as a reference.
It is not hard to show that the positional accuracy that can be obtained for a faint point source detected at signal-to-noise ratio , for a point spread function (PSF) of full-width at half maximum is given by where the coefficient of 0.7 applies to a wide range of realistic PSF profiles (see e.g. Kuijken & Rich 2002—henceforth KR02). For HST/WFPC2, , so stars detected at 20 can in principle be centroided to an accuracy of 3mas. Over a time baseline of six years this allows proper motion measurements of accuracy better than 1 mas/yr to be achieved. At the distance of the Bulge, this corresponds to uncertainties in the transverse motions of below 30km/s, significantly smaller than the velocity dispersion of the Bulge which is around 100km/s. They are thus sufficient to map the internal dynamics of the Bulge.
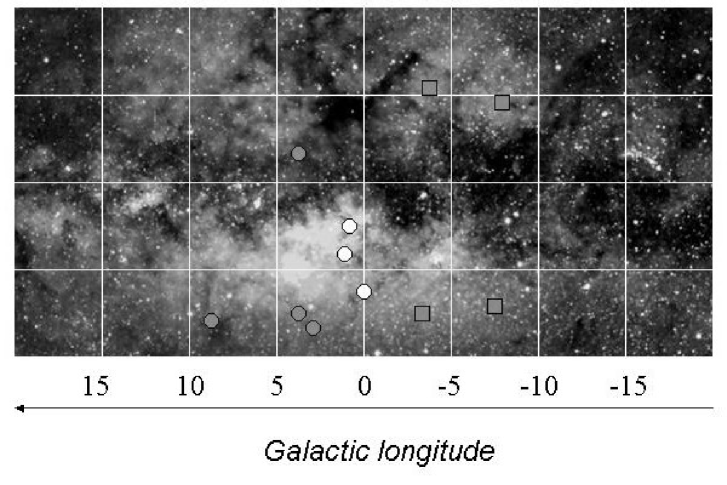
This paper describes proper motions measured from three fields near the minor axis of the bulge (see fig. 1), near (SGR-1), (Baade’s Window) and (near NGC6558).
Details of the proper motion measurement technique, a variant of the one developed by Anderson & King (2000), are given in KR02. It is a combination of PSF reconstruction from bright stars in the HST images, and PSF core fitting on these same crowded images. Information from exposures at different dither positions is used to refine the centroids, with residual systematics on the position measurements believed to be better than 1.5 mas (1/70th of a pixel on the undersampled WF2–4 detectors). We use the F814W (I band) images, whose PSF is least undersampled, for all proper motion measurements. Our proper motions are relative to each other: we arbitrarily set the average proper motion in each field to zero. At this point we have not yet established an extragalactic, absolute reference frame.
Figure 2 is an example of the results we obtain. It shows the data for the Baade Window field, with the ca. 15,000 stars measured binned in fine cells on the colour-magnitude diagram. For each cell we derive a mean and a dispersion in each of the proper motion coefficients.
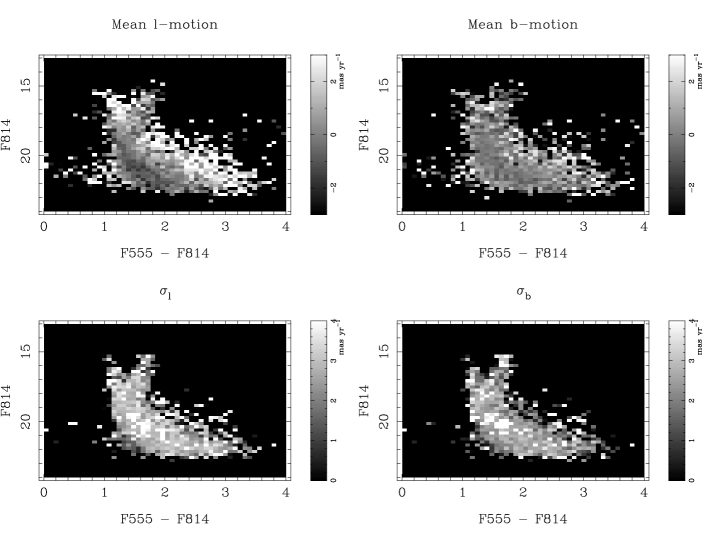
There is much information in this diagram. Clearly the bright end of the main sequence has different kinematics from the red giant branch, the former moving tangentially at several mas/yr with respect to the latter. This shows that the former are foreground disk stars, rotating in front of the bulge. Also, the lower main sequence shows a kinematic gradient: at fixed colour, fainter (hence more distant) main sequence stars have a systematically negative , opposite to the brighter stars—again a manifestation of the rotation of the galaxy about the bulge. And as a demonstration that observational errors are not a dominant effect, it is interesting to note that the fainter main sequence stars have lower proper motion dispersions than the brighter ones, which is naturally explained as a roughly constant velocity dispersion which translates to a lower proper motion dispersion for more distant stars.
3. Modeling
In KR02, we present the results of the SGR-1 and Baade Window fields, and focused mainly on a kinematic separation of the stars into disk and bulge. A dynamical analysis, based on Schwarzschild (1979) modeling of the observed proper motions in a variety of trial potentials with different bar shapes, orientations and pattern speeds, is underway. Here I present a preliminary analysis of the gravitational potential near the Galactic minor axis, based on Jeans modeling of part of the sample.
The vertical equilibrium of a stellar population of density and velocity dispersion tensor in a gravitational acceleration field is given by the Jeans equation
(The ‘tilting’ term involving is usually much smaller than the others, and will be ignored here.) Thus, in situ measurements of tracer density and velocity dispersion are required to determine the gravitational field that holds the tracer in equilibrium. This equation is usually applied in the solar neighbourhood in order to determine the vertical acceleration, and hence the amount of matter, in the local Galactic Disk (the Oort limit). In that case radial velocities of stars seen towards the Galactic Poles yield the required distribution in -velocity. However, with our proper motion data we can apply this technique to stars elsewhere in the Galaxy.
From our three fields near the Galactic minor axis we can measure the -gradient of the tracer kinematics. Using relative photometric parallaxes for main sequence stars, it is possible to select a sample of stars close to the Galactic minor axis, and hence to convert the vertical proper motion into a -velocity and apply the Jeans equation. The process is illustrated in Fig. 3, which shows that to a good approximation the vertical velocity dispersion and density of bulge stars follow


The resulting vertical force, representative for , can be cast into a velocity that can be compared with the circular velocity at the same radius in the plane of the Galaxy:
For comparison, the circular velocity at this radius in the Galaxy is likely to be at least 180km/s (Clemens 1985, Englmaier & Gerhard 1999)—an exact number is hard to estimate because of the nonaxisymmetries induced by the Bar.
4. Interpretation
The fact that the vertical force at is weaker than the radial force in the Galactic plane at (by a factor perhaps as large as 2) is at first sight surprising. The Galaxy is rather flattened, and so is the Bulge, so one might expect a flattened potential as well—in which case . Either the potential is prolate, (extended away from the plane), or our measured is diluted in some way. It turns out that the Galactic Bar would do precisely the latter.
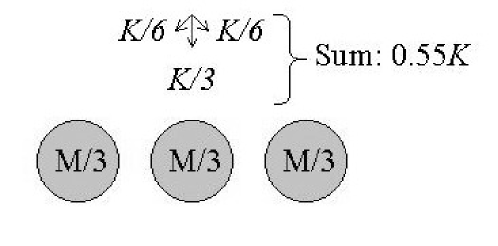
Fig. 4 illustrates the effect. Imagine a spherical bulge of mass , and a measurement of the vertical force about 500pc above it. Now imagine that the bulge is stretched out into a barred shape in the Galactic plane. The total mass of the bulge remains the same, but the vertical force on the minor axis changes: much of the bulge moves further away from the measuring point on the minor axis, weakening the gravitational attraction, and furthermore this weaker force is directed away from vertical, partially canceling. The net result is a gravitational acceleration that is still vertical, but weaker. The effect turns out to be easily strong enough to halve the vertical acceleration due to the bulge, even for a modest bar half-length of 1kpc.

5. Conclusions
Proper motions of bulge stars can be harvested effectively using of the HST/WFPC2 archive as a treasure of first-epoch images. The resulting samples of tens of thousands of stellar velocities will enable detailed kinematic models to be constructed. First results from analysis of three fields along the Bulge minor axis have yielded a measurement of the gravitational field on the symmetry axis of the Galaxy.
We conclude from these (still preliminary) measurements that the vertical potential gradient on the minor axis of the Galaxy, at a height of ca. 550pc, is equivalent to a a circular speed at that radius of 150km/s. This rather low value when compared to the Galactic rotation curve is probably best interpreted as evidence for a barred shape to the Galactic potential.
This project is on-going: fields away from the minor axis await re-observation for more proper motion measurements. A pilot programme to determine radial velocities in these crowded fields, using integral-field spectroscopy, has started. In the end, full models incorporating all kinematic information in the data, as well as the fields still in the pipeline, can be expected to yield a detailed description of the gravitational potential, bar shape and pattern speed in this complicated region of the Galaxy.
References
Anderson, J. & King, I.R. 2000, PASP 112, 1360
Clemens, D. 1985, ApJ 295, 422
Englmaier, P. & Gerhard, O. 1999, MNRAS 304, 512
Kuijken, K. & Rich, R.M. 2002, AJ 124, 2054 (KR02)
Schwarzschild, M. 1979, ApJ 232, 236