11email: ipa@ct.astro.it 22institutetext: JILA, University of Colorado and NIST, Boulder, CO 80309-0440, USA
22email: jlinsky@jila.colorado.edu 33institutetext: Space Telescope Science Institute, 3700 San Martin Dr. Baltimore, MD 21218, USA
33email: valenti@stsci.edu 44institutetext: Department of Astrophysical and Planetary Sciences, University of Colorado, Boulder, CO 80309-0389, USA
44email: dduncan@colorado.edu
HST/STIS High Resolution Echelle Spectra
of $α$ Centauri
A (G2
V)111Based on observations made with the NASA/ESA Hubble Space
Telescope, obtained at the Space Telescope Science Institute, which is
operated by the Association of Universities for Research in Astronomy, Inc.,
under NASA contract NAS 5-26555. These observations are associated with
proposal GO-07263.
We describe and analyze HST/STIS observations of the G2 V star Centauri A ($α$~Cen~A, HD~128620), a star similar to the Sun. The high resolution echelle spectra obtained with the E140H and E230H gratings cover the complete spectral range 1133-3150 Å with a resolution of 2.6 km s-1, an absolute flux calibration accurate to %, and an absolute wavelength accuracy of 0.6–1.3 km s-1. We present here a study of the E140H spectrum covering the 1140–1670 Å spectral range, which includes 671 emission lines representing 37 different ions and the molecules CO and H2. For $α$~Cen~A and the quiet and active Sun, we intercompare the redshifts, nonthermal line widths, and parameters of two Gaussian representations of transition region lines (e.g., Si iv, C iv), infer the electron density from the O iv intersystem lines, and compare their differential emission measure distributions. One purpose of this study is to compare the $α$~Cen~A and solar UV spectra to determine how the atmosphere and heating processes in $α$~Cen~A differ from the Sun as a result of the small differences in gravity, age, and chemical composition of the two stars. A second purpose is to provide an excellent high resolution UV spectrum of a solar-like star that can serve as a proxy for the Sun observed as a point source when comparing other stars to the Sun.
Key Words.:
Stars: individual ($α$ Cen A) — stars: chromospheres — ultraviolet: stars — ultraviolet: spectra — line: identification — line: profiles1 Introduction
Our knowledge and understanding of phenomena related to magnetic activity in late-type stars is based largely on the analysis of observations of the Sun obtained with high spatial, spectral and temporal resolution. In particular, the different heating rates and emission measure distributions of stellar chromospheres and transition regions can be understood by comparing stellar UV spectra with corresponding solar spectra. However, as strange as this may at first appear, we lack a true “reference spectrum” for the Sun observed as a star for such comparisons. In fact, the existing solar UV spectra provided by instruments on the Solar Maximum Mission (SMM) and the Solar and Heliospheric Observatory (SOHO) typically have moderate to high spectral resolution, but do not represent a full disk average, have uncertain wavelength and absolute flux calibrations, and consist of a stitching together of many small parts of the UV spectrum obtained at different times. Table 1 summarizes the instrumental characteristics of these data sets. For example, the UV spectral atlas obtained with the High Resolution Telescope and Spectrograph (HRTS) rocket experiment (Brekke, 1993b) and the recent UV spectral atlas obtained with the Solar Ultraviolet Measurements of Emitted Radiation (SUMER) instrument on the Solar and Heliospheric Observatory (SOHO) (Curdt et al., 2001) have high spectral resolution, but do not provide the solar irradiance (the Sun viewed as a point source) for direct comparison with stellar spectra. On the other hand, spectra of the Sun as a point source obtained with the Solar-Stellar Irradiance Comparison Experiment (SOLSTICE) instrument on the Upper Atmospheric Research Satellite (UARS) (Rottman, Woods, & Sparn, 1993), the EUV Grating Spectrograph (Woods & Rottman, 1990), and the Coronal Diagnostic Spectrometer (CDS) on SOHO (Brekke et al., 2000) do not have sufficient spectral resolution to resolve the line profiles.
| Instrument | Spectral | Spectral | Solar | Flux | Reference |
| Used | Range (Å) | Resolution | Location | Calibration | |
| HRTS | 1190–1730 | 0.05Å | quiet Sun | % | (1) |
| active Sun | (1) | ||||
| UVSP/SMM | 1150–3600 | disk center | (2) | ||
| SOHO/SUMER | 465–1610 | 17,770–38,300 | disk center | 20% | (3) |
| sunspot, CH | 20% | (3) | |||
| SOHO/CDS | 150–800 | 0.3–0.6Å | slit on disk | not given | (4) |
| 307–632 | 0.3–0.6Å | Sun-as-a-star | 15–45% | (5) | |
| SOLSTICE/UARS | 1190–4200 | 1–2 Å | Sun-as-a-star | 5% | (6) |
| rocket EGS | 300–1100 | 2Å | Sun-as-a-star | 15% | (7) |
| STIS E140H | 1140–1670 | 114,000 | $α$~Cen~A | % | (8) |
| (1) Brekke (1993b), (2) Shine & Frank (2000), Woodgate et al. (1980), (3) Curdt et al. (2001), | |||||
| (4) http://solg2.bnsc.rl.ac.uk/atlas/atlas.shtml, (5) Brekke et al. (2000), (6) Rottman, Woods, & Sparn (1993), | |||||
| (7) EUV Grating Spectrograph, Woods & Rottman (1990), (8) Leitherer et al. (2001), Bohlin, Dickinson, & Calzetti (2001). | |||||
One way to obtain a close approximation to a high resolution spectrum of the whole Sun observed as a point source with excellent S/N, absolute flux calibration, and wavelength accuracy is to observe a bright star with very similar properties to the Sun. We have done this with the Space Telescope Imaging Spectrograph (STIS) instrument on HST (Woodgate et al., 1998), obtaining a very high S/N and high resolution () spectrum of the star $α$~Cen~A, a nearby (d=1.34 pc) twin of the Sun with the same spectral type (G2 V). Although there are some small differences in effective temperature and metal abundances between $α$~Cen~A and the Sun (see below), this STIS spectrum of $α$~Cen~A can be considered the best available “reference spectrum” for the Sun viewed as a star, because it is a full disk average, has excellent wavelength and flux calibration (Bohlin, Dickinson, & Calzetti, 2001), and covers the entire 1130–3100 Å UV range with high S/N and within a short period of time.
$α$~Cen~AB (G2 V + K1 V) is the binary system located closest to the Earth (d=1.34 pc). It shows an eccentric orbit (e = 0.519) with a period of almost 80 years (Pourbaix et al., 2002). Actually Cen is a triple star system. The third member of the system, $α$ Cen C or Proxima Cen, is a M5.5 Ve flare star (V = 11.05) about 12 000 AU distant from $α$ Cen and only d=1.29 pc from the Sun (Perryman et al., 1997). Thanks to the high apparent brightness (V = -0.01 and V = 1.33 for the A and B component, respectively) and large parallax of the Cen stars, their surface abundances, other stellar properties, and astrometric parameters are among the best known of any star except the Sun. Guenther & Demarque (2000), Morel et al. (2000), and Pourbaix et al. (2002) have reviewed recent determinations of the physical characteristics of $α$~Cen~AB. According to Morel et al. (2000) and references therein, $α$~Cen~A has nearly the same surface temperature of the Sun (Teff=579030 K), slightly lower gravity than the Sun (=4.320.05, i.e. 0.76 g☉), and a mass of 1.160.03 M☉ - which is probably an upper limit, given different estimates reported in the literature starting from 1.08 M☉ (Guenther & Demarque, 2000). The same authors give a metal overabundance of 0.2 dex with respect to the Sun, but similar Li and Be abundances to the Sun. In Table 2 we list the $α$~Cen~A abundances used in this paper, which were compiled from Feltzing & Gonzalez (2001) and Morel et al. (2000). The age of $α$~Cen~A is controversial: Morel et al. (2000) derive an age in the range 2.7-4.1 Gyr depending on the adopted convection model, while Guenther & Demarque (2000) estimate an age in the range 6.8-7.6 Gyr. One could argue that $α$~Cen~A is younger than the Sun on the basis that it is formed of metal enriched material, but the larger radius and lower gravity compared to the Sun argue that the star is more evolved and somewhat older than the Sun, even considering its somewhat larger mass. A closer analog to the Sun is 18~Sco (V = 5.50), but this star is too faint to get high S/N high resolution UV spectra with STIS.
| Atom | Abund. | Ref. | Atom | Abund. | Ref. |
| H | 12.00 | 1 | S | 7.33 | 3 |
| He | 10.93 | 1 | Cl | 5.50 | 1 |
| Li | 1.30 | 2 | Ar | 6.40 | 3 |
| Be | 1.40 | 3 | K | 5.12 | 3 |
| B | 2.55 | 3 | Ca | 6.58 | 1 |
| C | 8.72 | 1 | Sc | 3.42 | 1 |
| N | 8.22 | 1 | Ti | 5.27 | 1 |
| O | 9.04 | 1 | V | 4.23 | 1 |
| F | 4.56 | 3 | Cr | 5.92 | 1 |
| Ne | 8.08 | 3 | Mn | 5.62 | 1 |
| Na | 6.33 | 3 | Fe | 7.75 | 1 |
| Mg | 7.58 | 3 | Co | 5.20 | 1 |
| Al | 6.71 | 1 | Ni | 6.55 | 1 |
| Si | 7.82 | 1 | Cu | 4.46 | 4 |
| P | 5.45 | 3 | Zn | 4.85 | 4 |
| References: | |||||
| 1) Feltzing & Gonzalez(2001); | |||||
| 2) Morel et al.(2000); | |||||
| 3) Solar values from Grevesse & Sauval (1998); | |||||
| 4) scaled from the Fe abundance. | |||||
$α$~Cen has been extensively studied in the ultraviolet by IUE. Jordan et al. (1987) used IUE data to create simple one-dimensional models of the atmospheric structure of the two stars. Hallam et al. (1991) have studied the rotational modulation of the most prominent lines in IUE spectra of $α$~Cen~A and found a rotation period of about 29 d. This is consistent with the Boesgaard & Hagen (1974) estimate that the Cen A rotation period is 10% larger than the solar one, but is larger than the 22 d rotation period derived from the 2.70.7 km s-1 rotational velocity measured by Saar & Osten (1997), assuming a radius of 1.2 R☉ and an orbital inclination of 79. Ayres et al. (1995) have studied the time variability of the most prominent UV lines of $α$~Cen~A and B during about 11 years of observations. While a clear evidence of a solar-like activity cycle was found for $α$~Cen~B, UV line fluxes from $α$~Cen~A do not give any clear indication for an activity cycle.
In this paper we report on the $α$~Cen~A spectrum recorded with the E140 grating by HST/STIS between 1140–1670 Å, while the analysis of the E230H spectrum (1620–3150 Å) will be published in a forthcoming paper. Information on data acquisition and reduction are provided in Section 2, the spectral line identification and the analysis of interesting lines are presented in Section 3. A detailed comparison of our STIS $α$~Cen~A spectrum, with the SOHO/SUMER (Curdt et al., 2001) and the SMM/UVSP (Shine & Frank, 2000) spectra of the Sun is given in Section 5. Then, we derive the $α$ Cen A transition region electronic densities (Section 6), and emission measure distribution (Section 7). In Section 8 we call the reader’s attention on some absorption features present in high exicitation lines, and give our conclusions in Section 9.
2 The $α$ Cen A Data
The E140H spectrum of $α$~Cen~A was acquired on 1999 Feb 12 with 3 exposures of 4695 s each, centered at 1234, 1416, and 1598 Å, respectively. The E140H mode ensures an average dispersion of Å per pixel, which corresponds to a resolving power of 2.6 km s-1. The E140H grating is used with the FUV-MAMA detector, which we operated in TIME-TAG mode. We used the 0.20.09 arcsec aperture.
The data were reduced using the STIS Science Team’s IDL-based software, CALSTIS (Version 6.6). CALSTIS performs a variety of functions including flat fielding, assignment of statistical errors, compensation for the Doppler shifts induced by the spacecraft’s motion in orbit, conversion of counts to count rates, dark-rate image subtraction, and the removal of data from bad/hot pixels. Wavelength calibration was carried out assuming the post launch echelle dispersion coefficients and a dispersion coefficient correction for the Monthly MSM offsets released to the STIS Science Team on 1999 September (Lindler, 1999b). The on-board Pt lamp spectra taken in association with the science observations were used to measure zero point adjustments. For the echelle observations, CALSTIS computes a wavelength offset for each spectral order. The adopted offset is the median of these offsets. As a check for the success of the algorithm used, we have verified that the measured offsets are all within one pixel of the median offset. As a further check on the accuracy of the wavelength scale, we measured the centroids of emission lines recorded in adjacent orders, and found that the results agree to within less than 1 pixel. The nominal absolute wavelength accuracy is 0.5–1 pixel (i.e. 0.6–1.3 km s-1) (Leitherer et al., 2001).
CALSTIS outputs a file containing wavelength, flux, and error vectors, which is used in all subsequent processing. To remove the effects of scattered light that are important near the Ly- line, we used the IDL ECHELLE_SCAT routine (Lindler, 1999a) in the STIS Science Team’s software package. This routine uses the first estimate of the spectrum and a scattering model of the spectrograph to determine the intensity of the scattered light and to estimate what the spectrum plus scattered light image should look like. Comparison of this calculated spectrum with the observations yields differences that indicate the errors in the first estimate of the spectrum. This spectrum is then corrected and the process is iterated until acceptable agreement is obtained between the prediction and the observed image.
After correction for scattered light, the spectrum was then analyzed using software packages written in IDL. We used routines of the ICUR fitting code222ICUR (http://sbast3.ess.sunysb.edu/fwalter/ICUR/icur.html) is a general purpose screen-oriented data analysis program written in IDL for manipulating and analyzing one dimensional spectra. It is distributed to the public by the authors (F.M. Walter and J.E. Neff)., adapted to handle our STIS data, which perform multi-Gaussian fits to the line profiles using Bevington’s (1969) CURFIT algorithm. To correct for instrumental broadening, we convolved each proposed fit to an emission line profile with the instrumental line spread function (LSF), which was assumed to be a Gaussian with the nominal width ranging from 1.2 pixel at 1200 Å to 1 pixel at 1700 Å (Leitherer et al., 2001), as is appropriate for lines which are much broader than the width of the LSF.
3 Results
3.1 The Ultraviolet Spectrum of $α$ Cen A
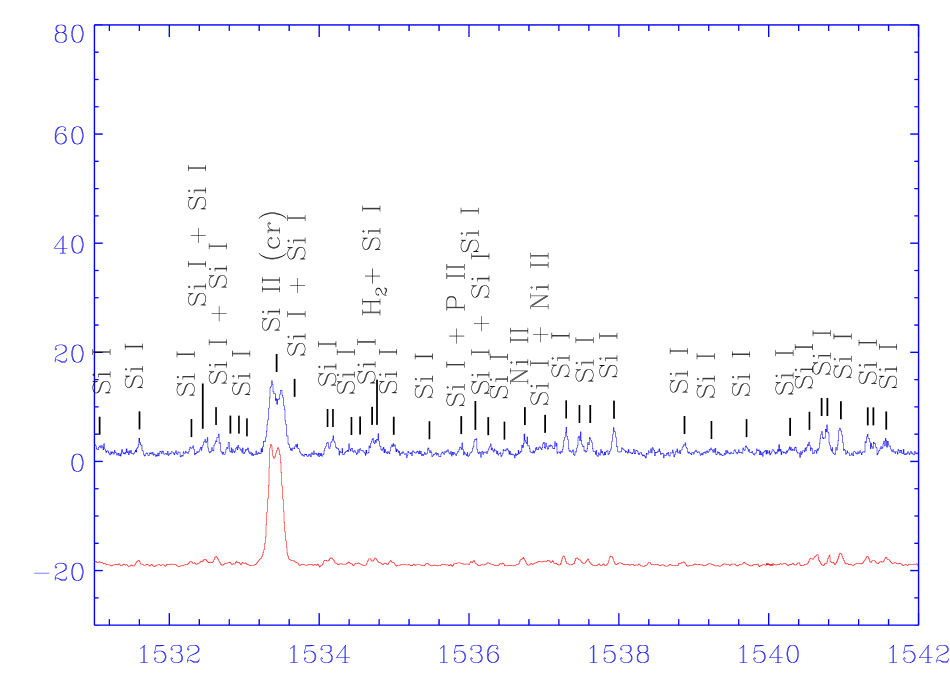
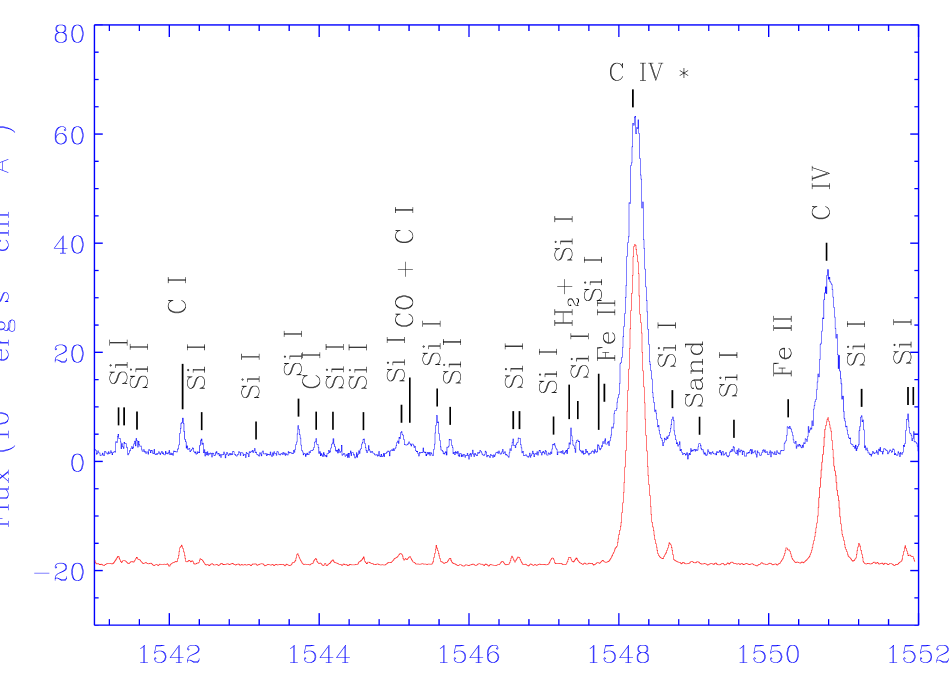
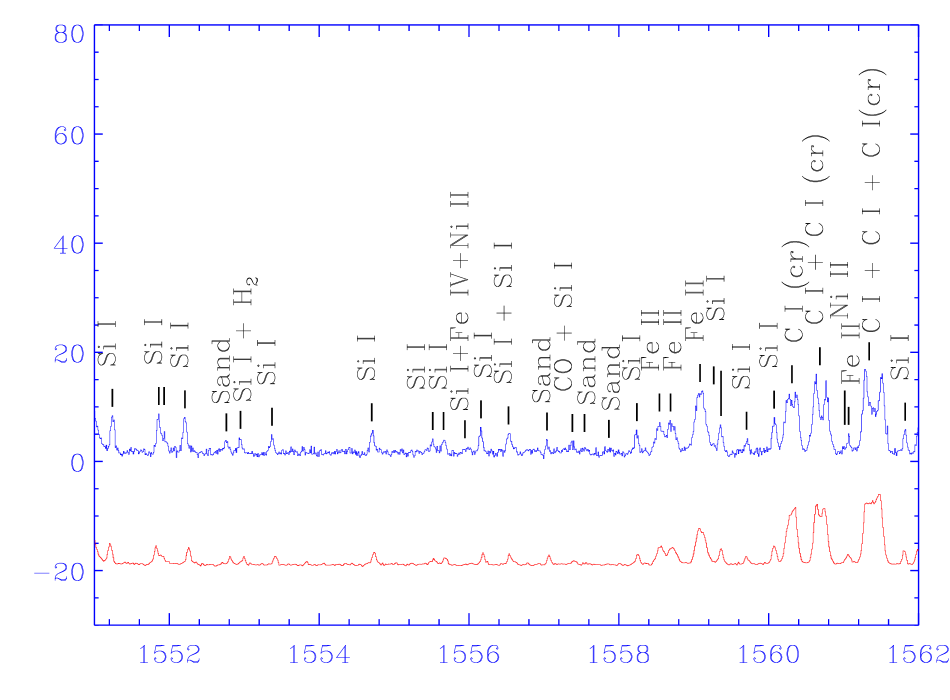
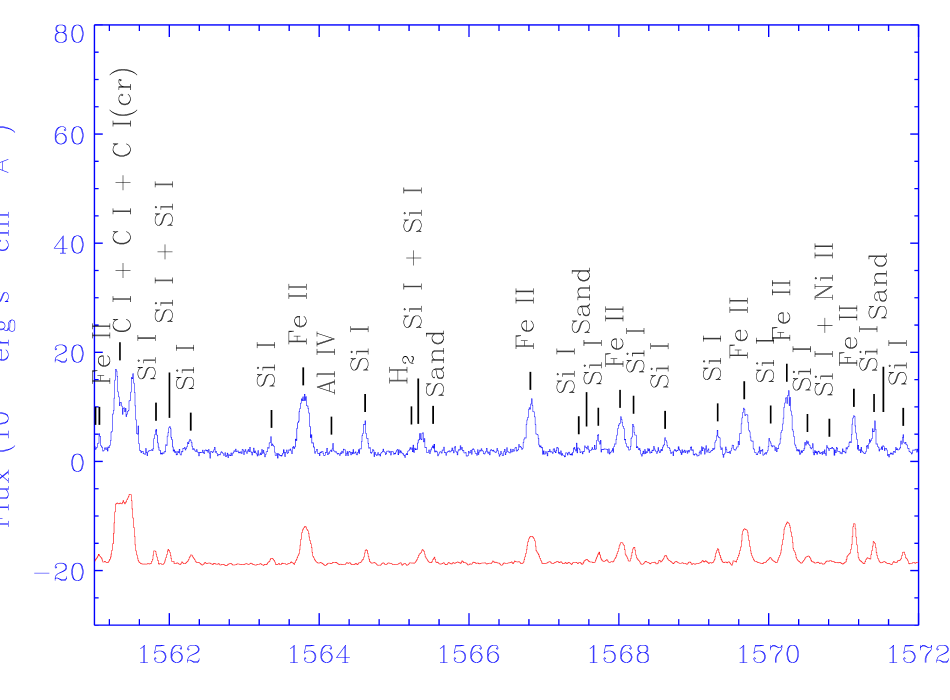
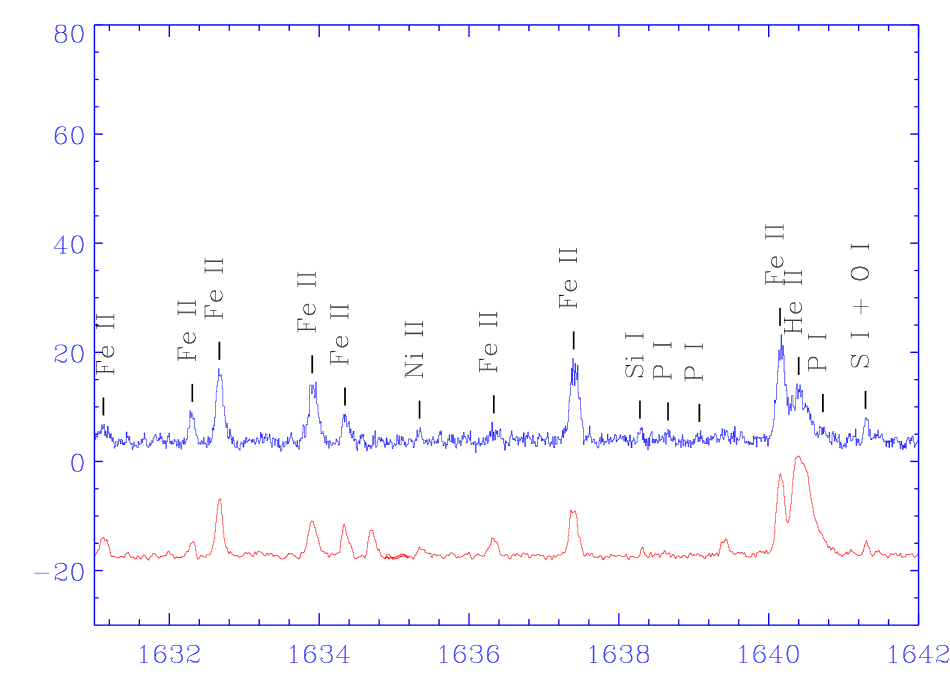
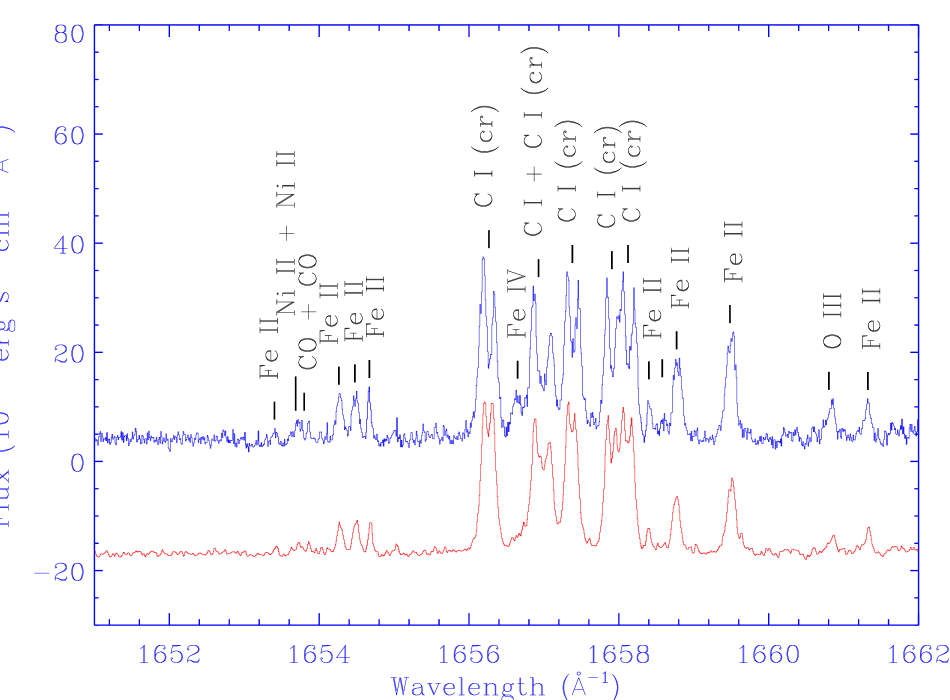
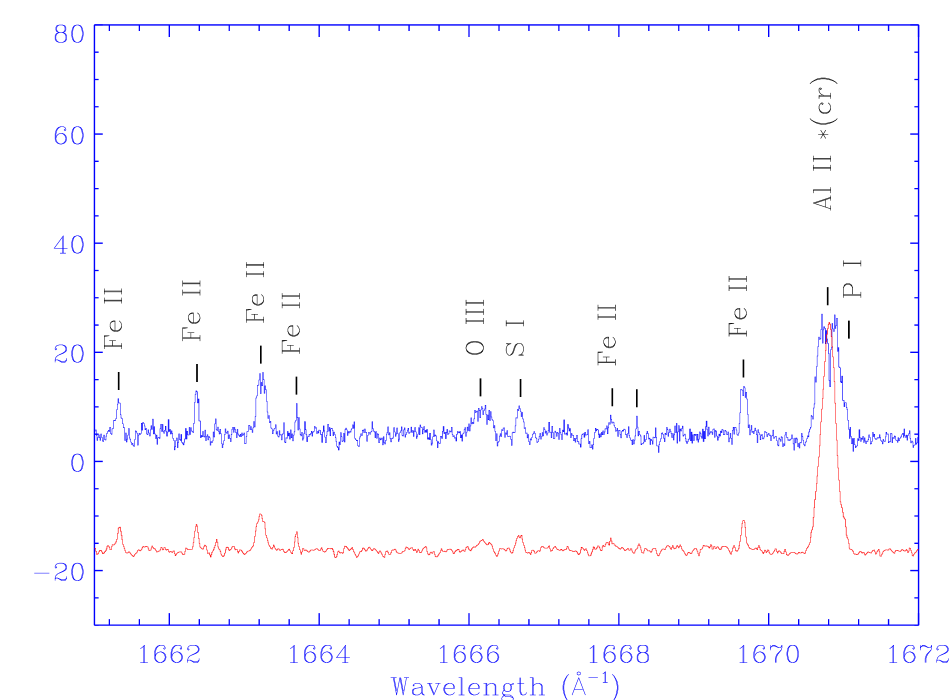
In Figure 1 we show the E140H spectrum of $α$~Cen~A. We have measured a total of 662 emission features of which 77 are due to blends of two or more lines, 71 are due to unidentified transitions, and 514 are identified as due to single emission lines. Taking into account the 157 lines identified in blended features, we find a total of 671 emission lines in this spectrum. In Table 3 we list all the ions that have been identified. Most of these lines are due to Si i, Fe ii, C i, which together contribute 441 lines, but S i and Ni ii are each represented by more than 30 lines.
| Ion | No. of lines | Ion | No. of lines | ||
|---|---|---|---|---|---|
| Total | Blended | Total | Blended | ||
| Si I | 155 | 46 | O IV | 5 | 1 |
| Fe II | 144 | 20 | Ca II | 4 | 3 |
| C I | 142 | 32 | Cl I | 3 | |
| S I | 55 | 6 | S II | 3 | |
| Ni II | 34 | 8 | S III | 3 | 1 |
| Si II | 17 | 4 | S IV | 3 | 1 |
| H2 | 14 | 11 | C IV | 2 | |
| N I | 13 | 6 | Fe V | 2 | |
| CO | 11 | 6 | N V | 2 | |
| C III | 8 | 1 | O III | 2 | |
| Fe IV | 8 | 1 | O V | 2 | |
| Si III | 7 | 2 | Si IV | 2 | |
| O I | 6 | 1 | S V | 2 | 1 |
| C II | 6 | 4 | |||
| P I | 5 | ||||
| 1 line each for Al II, Al IV, Ca VII, Cl II, Cr II, | |||||
| Fe XII, H I, He II, and N IV | |||||
| 1 line in blended features for P II, and Si VIII | |||||

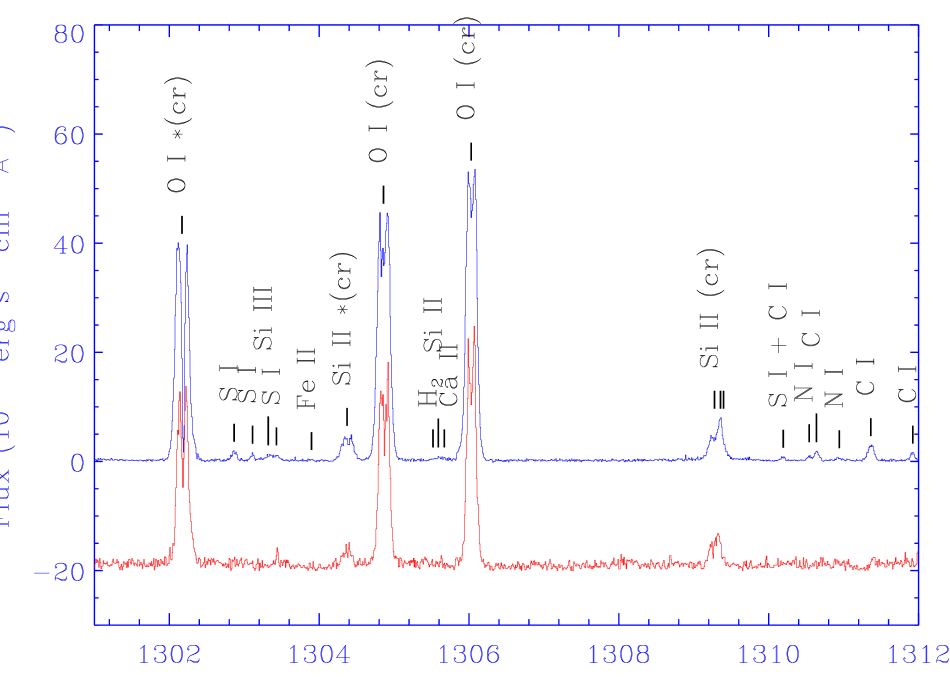
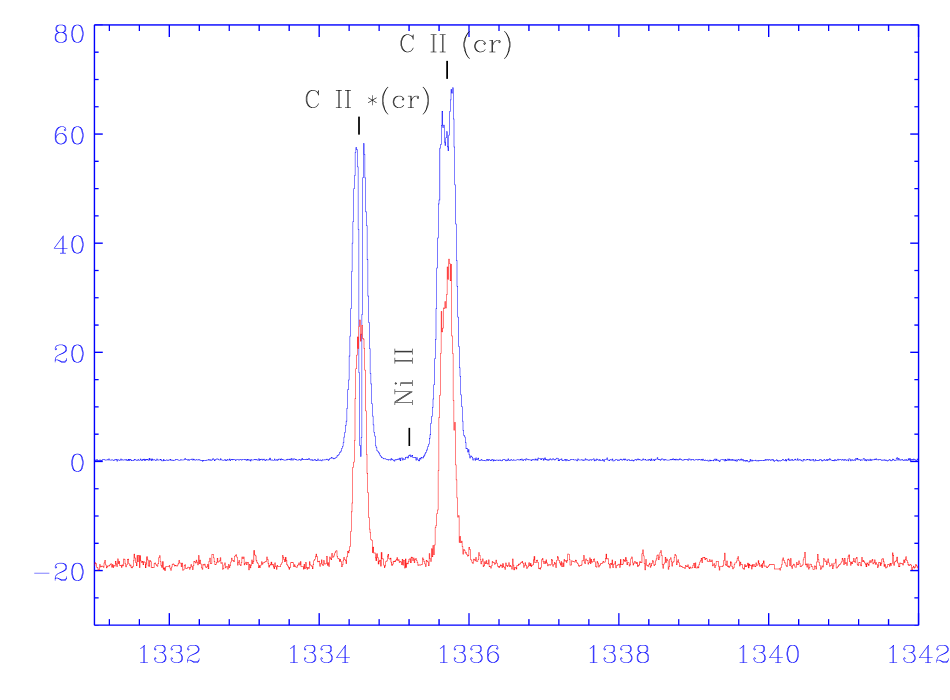
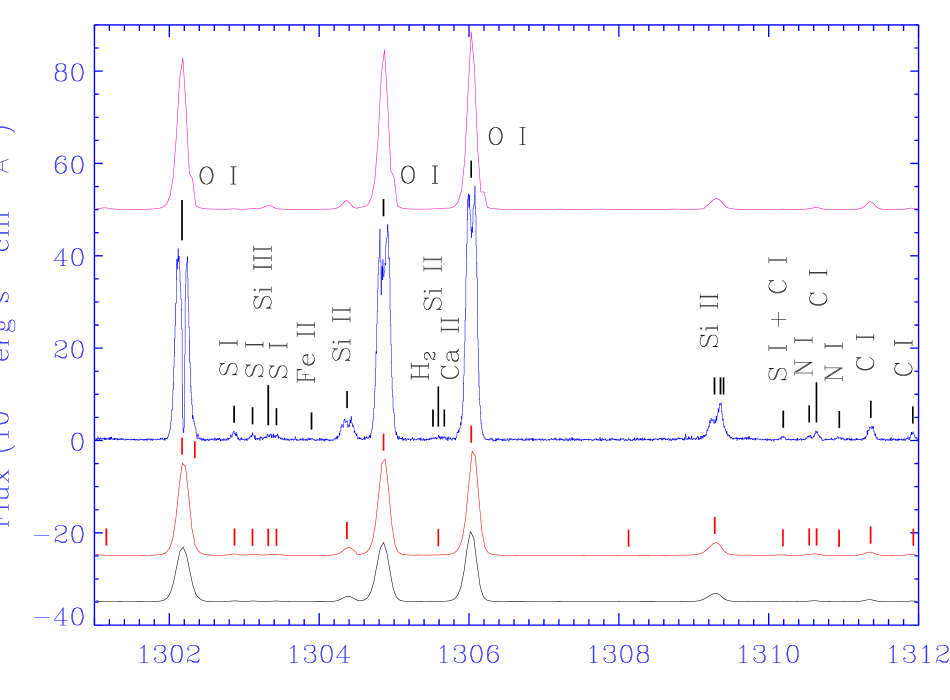
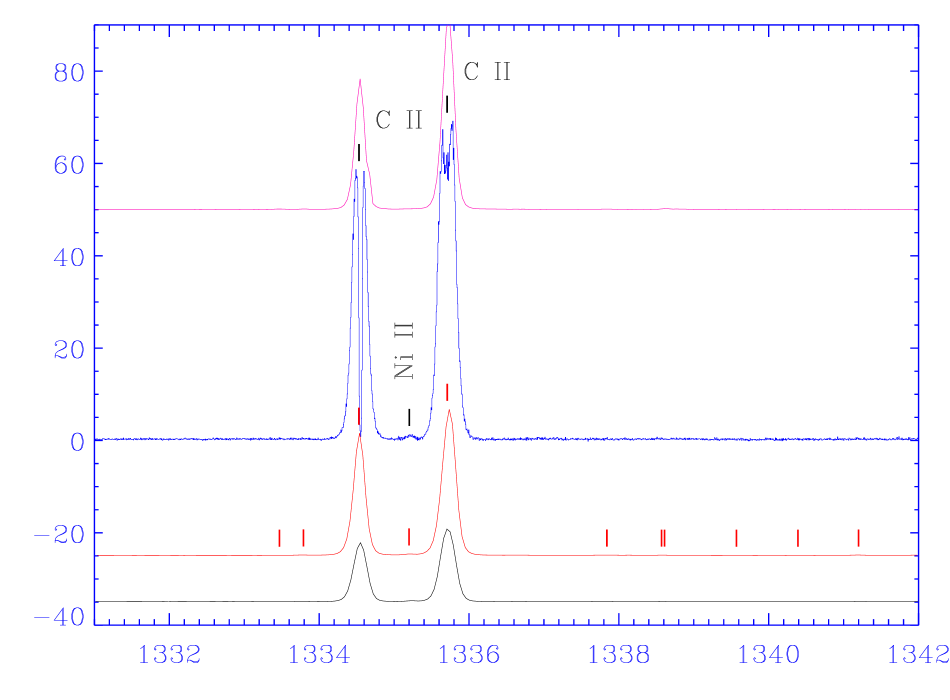
Table 4333Table 4 is also available at the CDS, lists the line identifications, laboratory and measured wavelengths, radial velocity shifts corrected for the stellar radial velocity of –23.45 km s-1, computed using the orbital parameters and ephemeris given by Pourbaix et al. (2002), line full-widths at half-maxima (FWHM), and line fluxes. The laboratory wavelengths listed in Table 4 are from Sandlin et al. (1986), unless otherwise noted in the table. We used Gaussian fits to the line profiles to measure wavelengths, FWHM, and fluxes for single or blended emission lines which do not show central reversals. For the lines which have interstellar absorption components or central reversals, i.e. the most intense optically thick chromospheric lines of C i, O i, Si ii, and C ii, we instead integrated the flux contained in a suitable wavelength interval and tabulated the FWHM of the observed profile. In Table 4 these lines are indicated with “CR” in the Notes column.
The strongest transition region lines show broad wings, and therefore do not have a Gaussian profile. For these lines, we list in Table 4 the line centroid, the FWHM of the observed profile and the flux integrated in a suitable wavelength interval. The analysis of these lines is reported in Section 3.3.
Absorption features due to the interstellar medium have been measured in a number of lines originating in transitions from the ground level. Such lines are indicated with “ISM” in Table 4 (column Notes). They will be discussed in a separate paper, together with the derived properties of the interstellar medium along this line of sight.
Several intersystem lines are present in the spectrum of the $α$~Cen~A, including the O iv UV 0.01 intercombination multiplet , that are diagnostics of electron density (cf. Del Zanna, Landini, & Mason 2002; Brage et al. 1996, and references therein), the N iv line at 1486 Å, and the O iii line at 1666 Å. We have used these lines to measure densities in the $α$~Cen~A chromosphere and transition region as discussed in Section 6.
3.2 Comments on individual line identifications
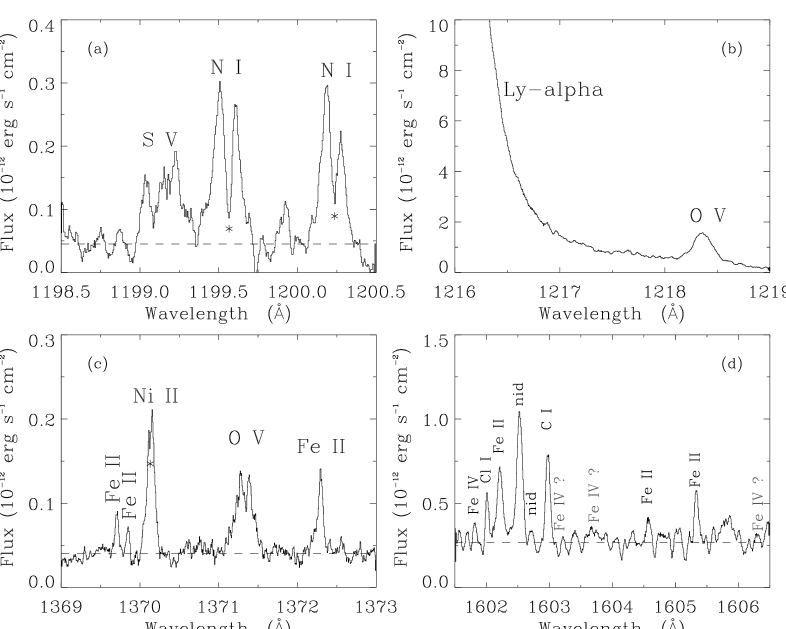
According to the NIST database, we have identified the broad feature near 1199 Å as S v (see Figure 2a). However, it is possible that other unidentified lines are present. In fact, the flux measured at 1199.08 Å seems too large to be consistent with the differential emission measure distribution derived in Section 7.
The chromospheric Ly emission line is altered greatly by the superimposed narrow, weak deuterium (D I) interstellar absorption and by very broad, saturated hydrogen (H I) interstellar, heliospheric, and astrospheric absorption, and by geocoronal emission. The Ly line flux given in Table 4 was estimated by fitting a Gaussian to the wings of the line profile, disregarding the central part of the line, which is strongly affected by ISM absorption and geocoronal emission, and including a second Gaussian to account for the Deuterium absorption. This is a very rough estimate of the Ly flux. We refer to the Linsky& Wood (1996) and Wood et al. (2001) papers for reliable estimates of the intrinsic Ly in Cen A.
The two O v lines that we have measured in the $α$~Cen~A STIS spectrum have radial velocities differing by about 1.8 km s-1, with the 1218 Å line less red-shifted than the line at 1371 Å. On the Sun, the 1371 Å line has a Doppler shift of km s-1 greater than the 1218 Å line, but Brekke (1993a) concluded that such a difference between the two lines can be explained only by an error in the adopted laboratory wavelength of the O v 1218 Å line, which is an intersystem line and thus difficult to measure in the laboratory. However, if this were the case, adoption of the wavelength 1218.325 Å suggested by Brekke (1993a) as the laboratory wavelength, leads to a significant difference (2.8 km s-1) in the opposite sense. We suggest that the main reason of the slight wavelength disagreement, even on the Sun, can be attributed to the difficulty in measuring the wavelength of the O v 1218 Å line (see Figure 2b) in the sloping wing of the Ly line. The O v line at 1371 Å (see Figure 2c) shows a double peak with an apparent central reversal. We know of no explanation for this effect as the line is unlikely to be optically thick and thus self-reversed, and interstellar absorption is also unlikely.
A blow-up of the region with a complex feature located near 1241.8 Å is shown in Figure 3. The feature is noisy, but its double-peak structure is preserved even after smoothing with a boxcar average of width as large as 13 pixels. We have therefore fitted the profile with two Gaussians, and identified the two lines as the S i 1241.9 Å and Fe xii 1242 Å lines. Since the Fe xii line is formed at temperature , its predicted thermal width is 33 km s-1. We have frozen the line width of the Fe xii line to its thermal width, and derived a flux of 6.310-15 erg s-1 cm-2. An a-posteriori check for the accuracy of our measured flux is given by the excellent agreement between the emission measure derived by using this line at and the emission measure derived at temperatures and 6.3 from Chandra spectra (Raassen et al., 2003) (cf. Section 7).

The weak emission feature observed in solar spectra at 1356.88 Å was tentatively attributed to the S iii line at 1357.0 Å by Feldman et al. (1975). Its laboratory wavelength makes this line slightly blue-shifted, in contrast with the expectation (cf. Section 4), therefore we can argue that either the identification is wrong or the laboratory wavelength given by Feldman et al. (1975) is inaccurate.
We have measured the Fe iv line at 1602 Å that belongs to a multiplet of four lines. A careful inspection of the spectrum shows slight flux increments at the wavelengths corresponding to the 1603.181, and 1603.730 Å Fe iv lines, which, however, are below our detection limit as shown in Figure 2 (panel d), but we do not find any appreciable emission feature corresponding to the fourth line of this multiplet at 1606.333 Å. While all of the Fe iv lines have been identified in the Kelly (1982) line database, no Fe iv lines have been identified in the solar spectrum analyzed by Sandlin et al. (1986). We have inspected the solar SMM/UVSP spectrum (Shine & Frank, 2000) to look for Fe iv lines, but even the strongest line measured in the $α$~Cen~A STIS spectrum at 1656 Å is missing in the solar spectrum, as shown in the left-bottom panel of Figure 4.
3.3 The Broad Wings of the Transition Region Emission Lines
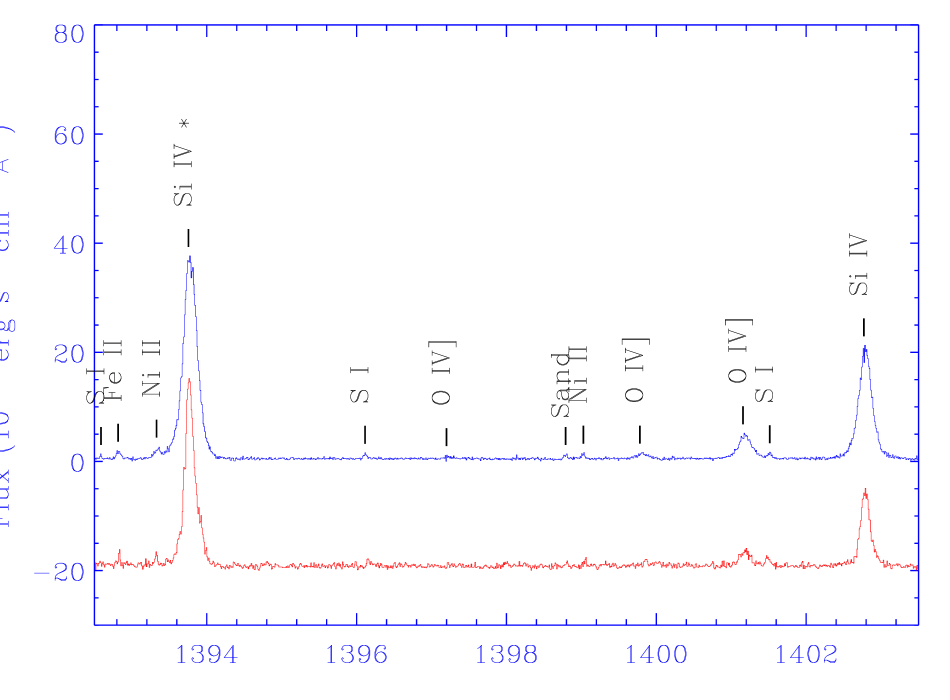
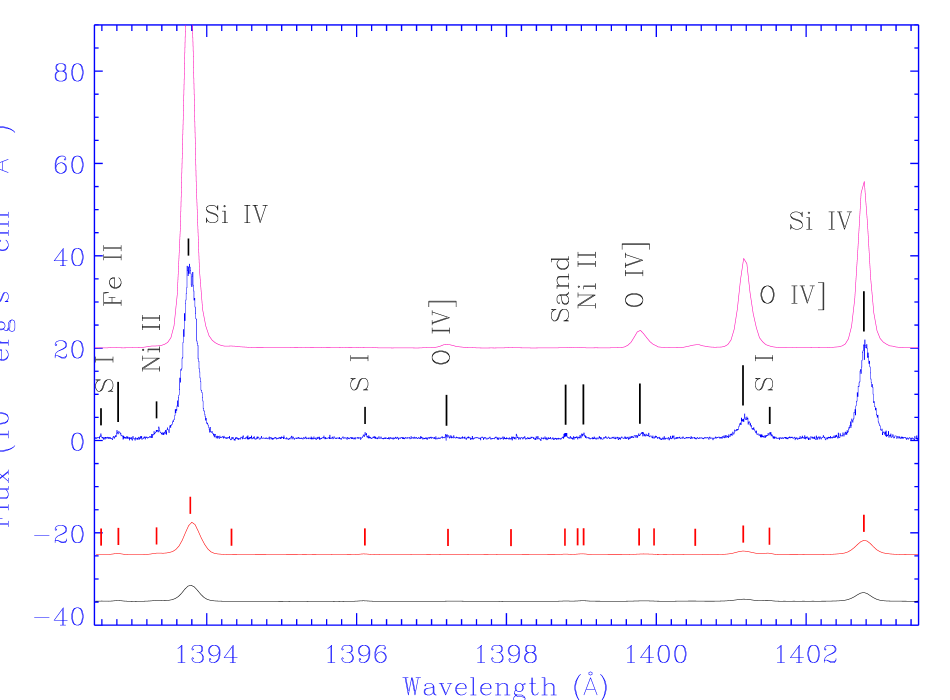
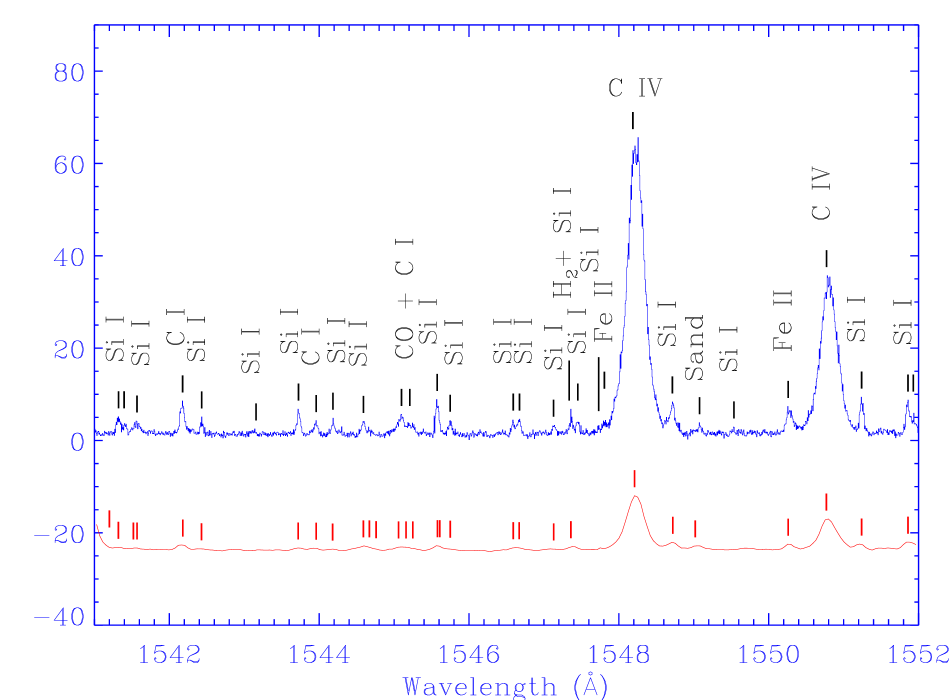
As shown by Wood et al. (1997), the strongest transition region emission lines of $α$~Cen~A have profiles with broad wings. We find that broad wings are present in the Si iii 1206 Å, N v 1238 Å, Si iv 1393 & 1402 Å, and C iv 1548 & 1502 Å line profiles. For these lines we used one narrow Gaussian component (NC) to fit the line core and one broad Gaussian component (BC) to fit the broad wings (see Figure 5). This bi-modal structure of the transition region lines is typically observed for several RS CVn-type stars (i.e., Capella and HR~1099), main sequence type stars (i.e., AU Mic, Procyon, $α$~Cen~A, and $α$~Cen~B), and the giants 31~Com, $β$~Cet, $β$~Dra, $β$~Gem, and AB~Dor (Linsky & Wood, 1994; Linsky et al., 1995; Pagano et al., 2000). Wood et al. (1997) showed that the narrow components can be produced by turbulent wave dissipation or Alfvén wave heating mechanisms, while the broad components, that resemble the explosive events on the Sun, are diagnostics for microflare heating. Analysis of SUMER data led Peter (2001) to propose an alternative explanation for the broad Gaussians, which he calls the “tail component”, seen in lines formed at temperatures between 50,000 and 300,000 K in the chromospheric network. He argues that the tail component originates in coronal funnels that magnetically connect the lower transition region with the corona, and the broadening is by passing magneto-acoustic waves.

Table 5 lists the parameters resulting from our multi-Gaussian fits444For the fits of N v 1238 Å, Si iv 1393 Å, and C iv 1548 Å, a third Gaussian component was used to account for the absorption feature possibly originating in the intervening interstellar medium.. Both the narrow and broad components are redshifted with respect to the stellar chromosphere, whose rest velocity is determined by the mean velocity of 80 selected Si I lines as discussed in Section 4. The narrow components show larger redshifts as is seen in solar data (Peter, 2001). This effect was also noticed by Wood et al. (1997), who analyzed the Si IV 1393 Å line in GHRS/HST spectra of $α$~Cen~A.
The broad and narrow Gaussian components have comparable intensity as the flux-weighted mean ratio between the flux in the broad component and the total flux is . This ratio is typical for the most active stars studied by Wood et al. (1997), and it appears to be independent of the activity level of the star.
| Narrow Component | |||
|---|---|---|---|
| Ion | FWHM | Flux | |
| (km s-1) | (km s-1) | (erg s-1 cm-2) | |
| Si III 1206.510 | +5.2 0.4 | 48.7 0.4 | 1148.2 13.7 |
| N V 1238.821 | +5.1 0.8 | 42.8 2.4 | 129.5 9.0 |
| Si IV 1393.755 | +6.5 0.2 | 35.7 0.5 | 437.9 6.8 |
| Si IV 1402.770 | +5.4 0.3 | 34.8 0.7 | 221.8 4.4 |
| C IV 1548.187 | +8.8 0.2 | 43.2 0.4 | 996.0 11.5 |
| C IV 1550.772 | +7.8 0.4 | 42.3 1.5 | 478.2 22.9 |
| Flux-weighted | |||
| average | +6.8 1.5 | 43.4 4.7 | … |
| Broad Component | |||
| Ion | FWHM | Flux | |
| (km s-1) | (km s-1) | (erg s-1 cm-2) | |
| Si III 1206.510 | –0.7 0.7 | 69.6 0.4 | 745.4 13.7 |
| N V 1238.821 | +0.9 1.2 | 70.4 2.4 | 187.8 7.4 |
| Si IV 1393.755 | +3.8 0.3 | 69.1 0.5 | 461.1 6.8 |
| Si IV 1402.770 | +3.9 0.6 | 65.6 0.8 | 228.8 4.4 |
| C IV 1548.187 | +7.4 0.4 | 78.8 0.6 | 867.8 11.5 |
| C IV 1550.772 | +4.5 0.6 | 72.1 1.7 | 474.0 32.5 |
| Flux-weighted | |||
| average | +3.6 3.1 | 72.4 4.4 | … |
| Comparison | |||
| Flux Ratio | Velocity Shift | ||
| FBC/Ftot | () | ||
| Si III 1206.510 | 0.39 0.01 | +5.90.8 | 1.12 |
| N V 1238.821 | 0.59 0.03 | +4.31.4 | 1.08 |
| Si IV 1393.755 | 0.51 0.01 | +2.70.4 | 1.15 |
| Si IV 1402.770 | 0.51 0.01 | +1.50.7 | 1.36 |
| C IV 1548.187 | 0.47 0.01 | +1.40.5 | 1.17 |
| C IV 1550.772 | 0.50 0.04 | +3.30.7 | 1.30 |
| Flux-weighted | |||
| average | 0.46 0.05 | +3.41.8 | |
The flux-weighted average of the FWHMs are , and km s-1 for the narrow and broad components, respectively. By comparison, explosive events on the Sun produce transition region lines as broad as FWHM km s-1 (Dere et al., 1989).
4 Turbulent velocity and velocity shifts with line formation temperature
Lines of the same ion generally form at nearly the same temperature in a collisional ionization equilibrium plasma. Therefore, for most ions we use all the measured lines to derive their mean Doppler shifts and nonthermal widths. The results, listed in Table 6, have been derived according to the following procedure. First, we have computed the standard deviation of the heliospheric velocities measured for all the unblended lines of each ion. Then, we have selected the lines whose velocity is different from the mean by less than 1 standard deviation in order to remove from the analysis lines that might be altered by unknown blends or have inaccurate wavelengths. With these selected lines we then computed the mean heliospheric velocity and standard deviation of the mean, as well as the mean FWHM. For some ions this procedure was not applied - e.g. in the case of ions for which less than 3 lines have been measured - as notated in the last column of Table 6.
| Ion | Log Te | Na | Velocity | Nonthermal | Notesc | |
|---|---|---|---|---|---|---|
| Shiftb | Velocity | |||||
| (km s-1) | (km s-1) | |||||
| Si I | 3.80 | 80 | 0.00 0.12 | 7.5 0.3 | ||
| N I | 3.85 | 5 | -0.12 0.10 | 14.6 2.6 | ||
| S I | 3.95 | 37 | 0.59 0.07 | 7.6 0.4 | ||
| C I | 4.11 | 82 | 0.61 0.09 | 9.9 0.3 | ||
| Fe II | 4.23 | 90 | 1.50 0.17 | 10.8 0.3 | ||
| Ni II | 4.25 | 18 | 1.07 0.34 | 10.9 0.8 | ||
| Si II | 4.26 | 9 | 1.21 0.05 | 23.7 2.3 | ||
| O I | 4.31 | 3 | 1.01 0.83 | 11.9 3.2 | ||
| S II | 4.48 | 2 | 2.27 1.17 | 15.4 0.4 | ||
| C II | 4.62 | 2 | 1.68 0.83 | 27.4 1.3 | 1 | |
| C III | 4.75 | 5 | 3.98 0.64 | 28.7 0.7 | ||
| Si III | 4.78 | 3 | 6.92 0.25 | 27.1 1.3 | ||
| S III | 4.81 | 1 | 5.05 0.07 | 22.5 0.3 | 1 | |
| Si IV | 4.84 | 2 | 4.99 1.47 | 25.7 0.5 | 1 | |
| O III | 4.97 | 2 | 4.73 1.08 | 19.8 7.3 | 1 | |
| C IV | 5.03 | 2 | 7.28 0.43 | 30.2 1.0 | 1 | |
| O IV | 5.21 | 2 | 7.25 1.20 | 27.0 0.5 | ||
| N V | 5.25 | 2 | 3.87 0.19 | 30.2 1.1 | 1 | |
| S V | 5.26 | 1 | 11.49 0.93 | 38.9 0.2 | ||
| O V | 5.37 | 2 | 6.13 1.25 | 33.1 0.1 | 1 | |
| aNumber of lines selected to compute the velocity shift | ||||||
| and nonthermal velocity. | ||||||
| bDoppler shift computed assuming as reference the measured | ||||||
| mean velocity of Si i lines, –23.85 0.09 km s-1. | ||||||
| cWe use in this column to flag the ions for which all | ||||||
| the measured lines were used to compute the velocity shift | ||||||
| and nonthermal velocity. | ||||||
The most probable nonthermal speeds () listed in Table 6 were computed from the measured FWHM (in km s-1) by:
| (1) |
where is the speed of light, is the line formation temperature, and the ion mass. The Doppler shifts listed in Table 6 are relative to the the mean velocity of the Si i lines (–23.85 0.09 km s-1), which we use as the reference velocity, since the Si i lines are formed deep in the chromosphere at a temperature close to 6500 K (Chae et al., 1998) and are expected to be at the rest velocity of the photosphere (Samain, 1991). This velocity is very close to the radial velocity of –23.45 km s-1 obtained from contemporaneous AAT and CORALIE measurements (Pourbaix et al., 2002).
The Doppler shift and nonthermal widths of the chromospheric and transition region lines measured in the E140H spectrum of $α$~Cen~A are plotted in Figures 6 and 7. In both figures polynomial fits to the SUMER measurements of radial velocities and nonthermal widths in a solar active region and in the quiet Sun, derived by Teriaca et al. (1999), are represented with dotted and dashed curves, respectively. According to Teriaca et al. (1999), in solar active regions the lines formed at temperatures between T K and K are red-shifted, with a maximum red-shift about 15 km s-1 at K (C iv). At higher temperatures the velocities decrease becoming blue-shifted (about –10 km s-1 at T K). However, in the quiet Sun the Doppler shift reaches a maximum at a slightly higher temperature, T K (O iv, N v), and then decreases to a blue-shift of about –2 km s-1 at T K (Ne viii).

We performed a 2nd order polynomial fit to the $α$~Cen~A line Doppler shifts with respect to the temperature of line formation, giving each data point a weight equal to the square root of the inverse of its standard deviation. We find that in the sampled temperature range (T K to T K) the redshift increases monotonically, but the data are not adequate to infer the temperature of the turnover. Even though the lines of C ii, Si ii, and Fe ii are believed to be optically thick, these lines do not show Doppler shifts different from the optically thin lines formed at the same formation temperature. The N v lines, especially the 1238 Å line, have broad wings, and their centroids show a smaller redshift than is expected by the general distribution. In fact, the broad components are generally marginally blueshifted relative to the narrow components, as discussed in Section 3.3.

For both active and quiet regions on the Sun, the distributions of nonthermal line width versus line formation temperature, derived by including only those lines that are not affected by opacity effects, show a peak at T K. To map the increase in turbulent velocity with line formation temperature (and hence approximate height in the atmosphere), we fit the $α$~Cen~A data with a third order polynomial using the widths of the optically thin lines. In the sampled temperature interval, the turbulent velocity distribution for $α$~Cen~A resembles the solar data, although slightly larger nonthermal line widths are measured for line formation temperatures greater than T K. We note that the O iii mean line width is probably underestimated because the 1660 Å line may be blended, which can alter its intensity and consequently the determination of its width.
5 Comparison between the UV spectra of $α$ Cen A and the Sun
5.1 The Solar UVSP/SMM and SUMER/SOHO spectra
Solar UV spectra with comparable spectral resolution to our HST/STIS spectrum of $α$~Cen~A are those observed by the UltraViolet Spectrometer and Polarimeter (UVSP) instrument which flew on the the Solar Maximum Mission (SMM) and by the SUMER (Solar Ultraviolet Measurements of Emitted Radiation) spectrograph now operating on SOHO (Solar and Heliospheric Observatory).
The UVSP/SMM spectrum was obtained during the minimum of solar cycle (1984) in the range 1290 – 1772 Å with a slit, oriented north-south near solar disk center, with spectral resolution of the order of 100,000. The atlas (2nd order) was prepared by Richard Shine and Zoe Frank of the Lockheed-Martin Space and Astrophysics Lab., and was retrieved from the site . According to Shine (private communication), this spectrum was calibrated using Rottman’s quiet Sun data from rocket flights, which had accurate flux scales but had low spectral resolution. For intercomparison purposes, the wavelength scale of the solar spectrum was shifted by performing a cross correlation between this spectrum and the $α$ Cen A spectrum in many selected wavelength intervals.
The SUMER/SOHO spectrum is the FUV part of the spectrum that has been derived from observations obtained in the range 670 – 1609 Å by Curdt et al. (2001). These data were acquired with a dispersion of 41.2 mÅ/pixel (1st order) at 1500 Å, for an effective resolution of 8.2 km s-1. The wavelengths are typically accurate to 10 mÅ, i.e. 2 to 5 km s-1. The data represent the average radiance (mW sr-1m-2Å-1) for the quiet Sun at disk center (April 20, 1997), a coronal hole (Oct 12, 1996), and a solar spot (Mar 18, 1999). Hence, the quiet Sun and coronal hole SUMER spectra were acquired during phases of minimum of the solar cycle.
To be comparable with the $α$~Cen~A spectrum, we have computed the solar irradiance at the Cen distance from the quiet Sun radiance at disk center by multiplying by (cf. Wilhelm et al. 1998) for the quiet Sun, sunspot, and coronal hole spectra. This conversion does not take into account center-to-limb variations in the lines and continuum.
5.2 Comparison between the $α$ Cen A/STIS and the Sun/UVSP spectra
The comparison between the STIS $α$ Cen A and the UVSP solar spectra can be made in the 1192–1688 Å spectral range. In Figure 4 we plot interesting regions of the UVSP spectrum and the $α$~Cen~A spectrum degraded to a resolution of 0.010 Å/pixel in order to be comparable to the UVSP spectrum. The wavelength scale of the $α$~Cen~A spectrum was shifted to compensate for the radial velocity of the system (–23.45 km s-1).
Since the UVSP data refer to the “mean intensity over the disk”, it is possible to perform a radiometric comparison with the $α$ Cen A spectrum. For the emission lines whose integrated flux in the STIS spectrum exceed 5 10-14 erg s-1 cm-2, we list in Table 7 line surface fluxes and full widths at half maximum (FWHM) for both $α$~Cen~A and the Sun. We find that the line widths for the two stars are very similar for most of the chromospheric lines, whereas the transition region lines are typically broader for $α$ Cen A compared to the Sun. We show in Figure 8 the FWHM ratios versus the temperatures of line formation. A linear fit to these data suggests that the two quantities are correlated with a correlation coefficient of 0.83. Typically the $α$ Cen A line surface fluxes are slightly larger than those of the Sun (see Figure 9), with a mean flux ratio (Sun/$α$~Cen~A) of 0.830.18, but the Si ii 1526 and 1533 Å, the He ii 1640 Å and the Al ii 1671 Å lines are stronger in the Sun than in $α$ Cen A. The interstellar medium absorption in the Si ii 1526 Å and Al ii lines of $α$ Cen A can partially explain the high flux ratios. However, this is not the case for the Si ii 1533 Å line. The common factor for the three lines is the presence of central reversals. In the Sun these lines form in the chromosphere, where temperature increases with height. Line source functions, however, first increase and then decrease with height over the line formation region, due to non-LTE effects. A central reversal occurs for an optically thick line when the line core forms above the region where the source function peaks. The “horns” of the observed profile form roughly where the source function peaks (Mauas et al., 1989). On the Sun we see that the depth of the central reversal is a function of position on the solar surface. For example, the C i lines of the multiplet at 1560 and 1657 Å show profiles which have central reversals quite deep at the limb, and less pronounced both above the limb and towards disk center (Roussel-Dupré, 1983). The UVSP spectrum was acquired near disk center, while the $α$~Cen~A spectrum is a full disk average. As a consequence, we expect less pronounced central reversals for the strongest chromospheric lines in the solar UVSP spectrum than in the $α$~Cen~A spectrum, as is observed.
| Line | Lab | Surface Flux | Flux | FWHM | FWHM | Line | Lab | Surface Flux | Flux | FWHM | FWHM | ||||
|---|---|---|---|---|---|---|---|---|---|---|---|---|---|---|---|
| ID | Wavel. | Cen A | Ratio | Cen | Ratio | ID | Wavel. | Cen A | Ratio | Cen A | Ratio | ||||
| (Å) | Sun | Sun | (Å) | Sun | Sun | ||||||||||
| S I | 1300.907 | 0.15 | 0.12 | 0.82 | 13 | 18 | 1.36 | C I+ | 1608.438 | 0.30 | 0.46 | 1.55 | 31 | 28 | 0.92 |
| O I | 1302.169 | 1.98 | 1.80 | 0.91 | 33 | 32 | 0.96 | +Fe II | |||||||
| Si II | 1304.372 | 0.18 | 0.16 | 0.88 | 31 | 33 | 1.04 | Fe II | 1610.921 | 0.31 | 0.24 | 0.76 | 23 | 20 | 0.89 |
| O I | 1304.858 | 2.10 | 1.84 | 0.88 | 33 | 27 | 0.80 | Fe II | 1611.201 | 0.21 | 0.17 | 0.82 | 17 | 15 | 0.85 |
| O I | 1306.029 | 2.17 | 1.96 | 0.90 | 29 | 24 | 0.83 | Fe II | 1612.802 | 0.39 | 0.34 | 0.87 | 26 | 26 | 0.97 |
| C II | 1334.532 | 3.27 | 2.68 | 0.82 | 43 | 31 | 0.74 | C I | 1613.376 | 0.18 | 0.15 | 0.85 | 12 | 13 | 1.12 |
| C II | 1335.708 | 4.53 | 3.82 | 0.84 | 47 | 36 | 0.76 | C I | 1613.803 | 0.17 | 0.13 | 0.77 | 12 | 13 | 1.07 |
| Cl I | 1351.657 | 0.30 | 0.32 | 1.06 | 12 | 12 | 0.97 | C I | 1614.507 | 0.19 | 0.13 | 0.68 | 13 | 12 | 0.97 |
| O I | 1355.598 | 0.46 | 0.42 | 0.91 | 12 | 12 | 0.99 | Fe II | 1618.470 | 0.25 | 0.30 | 1.21 | 24 | 20 | 0.83 |
| Si IV | 1393.755 | 2.22 | 2.14 | 0.97 | 44 | 31 | 0.72 | Fe II | 1623.091 | 0.28 | 0.25 | 0.89 | 24 | 22 | 0.92 |
| O IV] | 1401.157 | 0.23 | 0.16 | 0.72 | 46 | 36 | 0.79 | Fe II | 1625.520 | 0.47 | 0.32 | 0.69 | 27 | 23 | 0.86 |
| Si IV | 1402.770 | 1.12 | 0.83 | 0.75 | 42 | 29 | 0.69 | Fe II | 1625.909 | 0.20 | 0.20 | 0.98 | 17 | 18 | 1.02 |
| O IV]+ | 1404.806 | 0.12 | 0.08 | 0.66 | 47 | 45 | 0.97 | Fe II | 1632.668 | 0.37 | 0.39 | 1.06 | 20 | 18 | 0.90 |
| +S IV | Fe II | 1633.908 | 0.37 | 0.32 | 0.86 | 26 | 24 | 0.94 | |||||||
| S I | 1472.972 | 0.38 | 0.28 | 0.74 | 18 | 18 | 1.02 | Fe II | 1637.397 | 0.49 | 0.43 | 0.89 | 25 | 24 | 0.94 |
| S I | 1473.995 | 0.21 | 0.20 | 0.92 | 16 | 15 | 0.96 | Fe II | 1640.152 | 0.52 | 0.69 | 1.33 | 22 | 22 | 1.00 |
| N IV | 1486.496 | 0.16 | 0.06 | 0.40 | 45 | 33 | 0.74 | He II | 1640.400 | 0.62 | 1.60 | 2.59 | 52 | 52 | 1.00 |
| Si II | 1526.708 | 0.67 | 1.64 | 2.44 | 32 | 32 | 0.98 | Fe II | 1643.576 | 0.45 | 0.42 | 0.94 | 22 | 22 | 1.00 |
| Si II | 1533.432 | 0.74 | 1.65 | 2.23 | 37 | 31 | 0.86 | Fe II | 1649.423 | 0.30 | 0.21 | 0.71 | 22 | 18 | 0.84 |
| C IV | 1548.187 | 4.50 | 5.11 | 1.13 | 49 | 45 | 0.88 | C I | 1656.260 | 1.68 | 2.05 | 1.22 | 37 | 30 | 0.84 |
| Fe II | 1550.260 | 0.13 | 0.11 | 0.89 | 20 | 20 | 1.01 | C I | 1656.928 | 1.34 | 2.25 | 1.69 | 58 | 54 | 0.92 |
| C IV | 1550.772 | 2.39 | 2.39 | 1.00 | 52 | 47 | 0.88 | C I | 1657.380 | 1.51 | 1.86 | 1.23 | 35 | 31 | 0.89 |
| Fe II | 1559.084 | 0.47 | 0.39 | 0.82 | 30 | 29 | 0.96 | C I | 1657.900 | 0.99 | 1.52 | 1.53 | 28 | 27 | 0.96 |
| C I | 1560.310 | 0.51 | 0.60 | 1.17 | 27 | 29 | 1.06 | C I | 1658.120 | 1.22 | 1.76 | 1.44 | 30 | 26 | 0.87 |
| C I | 1560.683 | 0.60 | 0.73 | 1.22 | 30 | 36 | 1.21 | Fe II | 1658.771 | 0.50 | 0.42 | 0.83 | 24 | 20 | 0.85 |
| C I | 1561.341 | 0.83 | 1.19 | 1.42 | 56 | 51 | 0.92 | Fe II | 1659.483 | 0.75 | 0.69 | 0.91 | 27 | 26 | 0.97 |
| Fe II | 1563.788 | 0.42 | 0.37 | 0.88 | 28 | 26 | 0.92 | O III | 1660.803 | 0.17 | 0.12 | 0.73 | 20 | 22 | 1.07 |
| Fe II | 1566.819 | 0.30 | 0.25 | 0.81 | 25 | 24 | 0.96 | O III | 1666.153 | 0.31 | 0.13 | 0.43 | 45 | 34 | 0.76 |
| Fe II | 1569.674 | 0.24 | 0.29 | 1.24 | 22 | 22 | 0.99 | Fe II | 1669.663 | 0.22 | 0.15 | 0.67 | 16 | 12 | 0.75 |
| Fe II | 1570.242 | 0.35 | 0.39 | 1.12 | 23 | 25 | 1.07 | Al II | 1670.787 | 1.78 | 3.57 | 2.01 | 44 | 41 | 0.94 |
| Fe II | 1577.166 | 0.15 | 0.19 | 1.22 | 18 | 18 | 0.95 | Fe II | 1674.254 | 0.40 | 0.35 | 0.87 | 20 | 17 | 0.85 |
| Fe II | 1580.625 | 0.30 | 0.30 | 1.02 | 22 | 24 | 1.07 | Fe II+ | 1685.954 | 0.29 | 0.38 | 1.30 | 23 | 21 | 0.92 |
| Fe II | 1584.949 | 0.28 | 0.30 | 1.08 | 23 | 22 | 0.94 | +Ni II | |||||||
| Fe II | 1588.286 | 0.36 | 0.55 | 1.53 | 21 | 19 | 0.90 | Fe II | 1686.455 | 0.44 | 0.55 | 1.26 | 23 | 20 | 0.84 |
| C I | 1602.972 | 0.13 | 0.13 | 0.99 | 15 | 16 | 1.07 | Fe II | 1686.692 | 0.60 | 0.59 | 0.99 | 25 | 26 | 1.04 |

We believe that the He ii line, which is optically thin and not self-reversed, is really weaker on $α$ Cen A than on the Sun. Since the He ii line is extremely sensitive to the coronal activity, a flux ratio of 1.8 suggests that the Sun is more active than $α$ Cen A. This conclusion is strengthened by the absence of a limb contribution in the solar data since the He ii line is limb-brightened for the Sun and likely also for $α$ Cen A.

It should be mentioned here that some of the UV line flux differences between the $α$ Cen A and the Sun may be due to observing at different phases of the two stellar activity cycles. In fact transition region lines on the Sun can vary up to factors 2 – 5 over a magnetic cycle. While both UVSP and SUMER spectra were acquired during phases of solar minimum, we do not know the phase of $α$ Cen A activity cycle at which our observations have been obtained. In fact, the long-time extended IUE data base of $α$ Cen A does not provide any hints of an activity cycle period (Ayres et al., 1995). The roughly 13 individual measurements of the C IV multiplet flux obtained by IUE over a 13 year time period (see Fig. 11a in their paper) have a mean value of but a range from 1.5 to 3.6 in these units. The STIS flux for the C IV multiplet is 2.80 in the same units. This STIS flux is about 12% larger than the mean IUE flux. Since the IUE data are low resolution (about 6 Å), the broad line wings could be difficult to measure compared to the continuum and nearby weak lines. Thus the C IV fluxes measured from IUE spectra are likely somewhat low, and the C IV flux observed by STIS is probably very close to the mean value observed by IUE. We therefore believe that Cen A had average transition region fluxes when it was observed by STIS.
5.3 Comparison between the $α$ Cen A/STIS and Sun/SUMER spectra
In Figure 10 we plot interesting regions of the $α$~Cen~A spectrum, and the SUMER spectra of a coronal hole, a sunspot, and the quiet Sun, respectively. The wavelength scale of the $α$~Cen~A spectrum was shifted to remove the radial velocity of the star (–23.45 km s-1). The SUMER spectrum has the best photon statistics, therefore faint lines can be more easily seen in the solar spectrum than in the Cen STIS spectrum. On the other hand, the STIS spectrum has better resolution, which can be useful in resolving line blends and in studying line reversals due to optical thickness effects better than with the solar spectrum. In Table 8 we summarize how many lines we found in common between the two spectra. Many of the lines present in the solar spectrum but not in $α$ Cen A are located at wavelengths below about 1500 Å, whereas many of the lines detected only in the STIS spectrum are at wavelengths above 1500 Å. These differences probably result from the different resolutions of the two data sets and the increasing S/N of the SUMER data to shorter wavelengths. The emission lines in the $α$ Cen A spectrum are much stronger than in the quiet Sun spectrum. This is most likely because we are comparing the solar spectrum, which is an average disk-center quiet Sun spectrum, with the $α$ Cen A full disk irradiance spectrum, which includes emission from the limb. For most of the lines, the full disk irradiance is nearly a factor of two larger than the irradiance derived from disk-center radiance data (cf., Wilhelm et al. 1999), but there is no difference for the continuum. Because of this effect, the radiometric comparison between the SUMER and STIS spectra is uncertain.
| Total | With | Without | |
|---|---|---|---|
| Features | IDa | IDa | |
| $α$ Cen A/STIS | 559 | 498 | 61 |
| - of which not in the solar spectrum | 172 | 127 | 45 |
| Sun/SUMER | 516 | 458 | 58 |
| - of which not in the $α$ Cen A spectrum | 126 | 80 | 46 |
| Lines common to both spectra | 390 | 377 | 13 |
| a ID = Identification | |||
6 Electron Densities
The ratios of lines emitted by the same ion can be sensitive to electron density when the upper levels of the two transitions are depopulated in different ways. However, misleading results can be obtained when using line ratios that have a very small sensitivity at the inferred electron densities or when temperature effects are not properly taken into account. For this reason we have computed transition region densities for $α$~Cen~A using both the line ratios method and the so-called L-functions method, as described by Landi & Landini (1997). The main advantage of this method is that it gives an overall view of all lines and clearly shows which lines (and not line ratios) are more suitable in a particular density regime and when lines are at the limit of their density sensitive regime. According to these authors, the contribution function for each line of a selected ion, ), can be expressed as a product of two functions, one depending on electron density and electron temperature, and the other on temperature alone:
| (2) |
While the function is mainly determined by the ionization equilibrium and is the same for all the lines of the same ion, is determined mainly by the population of the upper level. The L-functions are ratios between the measured intensity of each line of a selected ion and the emissivity , computed at the temperature where the bulk of the emission arises. As described by Landi & Landini (1997), the L-functions of density dependent lines cross each other when plotted versus at the density, or the range of densities, of the region where the emission arises. Instead, the L-functions of density independent lines do overlap without crossing. The advantages of this method are discussed by Del Zanna, Landini, & Mason (2002).
The analysis of the $α$~Cen~A electron densities have been carried out with the help of the CHIANTI database VERSION 4.0 (Dere et al. 1997; Young et al. 2003), assuming the ionization equilibria described by Mazzotta et al. (1998) and the $α$~Cen~A photospheric abundances listed in Table 2.
6.1 O iv and S iv
The O iv intercombination multiplet near 1400 Å can be used as a density diagnostic in the range 10Ne1012 cm-3 (Brage et al., 1996). The 5 lines of the multiplet are all measured in the $α$~Cen~A STIS spectrum. The 1399.780 and 1407.382 Å lines originate from a common upper level; their ratio is , consistent with the ratio of their A-values (1.08), which is the expected value for a branching ratio in the optical thin case (Jordan, 1967). The O iv 1404.806 Å line is blended with S iv 1404.808 Å, and possibly with another unknown line (Del Zanna, Landini, & Mason, 2002). The percentage of the blending attributable to the O iv line has been derived and discussed by many authors (cf. Dufton et al. 1982; Brage et al. 1996; Del Zanna, Landini, & Mason 2002). The analysis of the five O iv line ratios (1401/1399, 1401/1407, 1401/1404, 1404/1407, and 1404/1399) indicate that is in the range 9.8–10.2, assuming that the effective temperature of O iv formation is and that the O iv 1404 Å line accounts for about 70-80% of the blend with the S iv 1404 Å line. This result does not change strongly with the assumed temperature at which the O iv lines are formed. Different estimates of the O iv and S iv relative contributions to the 1404 Å blend have been found to result in densities inconsistent with those obtained by ratios not involving the 1404 Å line. This is true if one assumes that either the O iv accounts for 92% of the blend, which is obtained from the theoretical line ratio of the S iv 1404.808 Å and 1406.016 Å lines assuming the atomic calculations by Dufton et al. (1982), or that the O iv line accounts for 50% of the blend, as derived by Del Zanna, Landini, & Mason (2002) in their analysis of a solar flare and of a GHRS spectrum of Capella. On the other hand, in their analysis of FUSE and STIS data for the dM1e star AU Mic Del Zanna, Landini, & Mason (2002) conclude that the O iv contribution to the blend is 80%, which is similar to our analysis.
In Figure 11 (top panel) the L-functions of the O iv lines, computed at , are plotted versus . Apart from the 1397 Å line, which is very weak and results in large errors, the other lines meet at , assuming that the O iv 1404 Å line accounts for 70% of the blend.
The L-functions of the S iv 1404, 1406, and 1407 Å lines, plotted in Figure 11 (middle panel), show that in order to have consistency among the lines, the S iv 1404 Å line must not exceed 10% of the flux in the blend. Therefore, an unidentified line contributes % of the total flux to the 1404 Å blend. Moreover, the L-functions of the S iv lines clearly show that no reliable density measurements can be derived from these lines.


6.2 O v
The observed O v 1218/1371 Å line ratio is R=. Using the Chianti code, and assuming the ionization equilibrium as described in Mazzotta et al. (1998) and the $α$~Cen~A photospheric abundances listed in Table 2, we find that:
-
•
at the O v effective temperature, , the theoretical 1218/1371 line ratio varies in the range , corresponding to ;
-
•
at the temperature of O v maximum ionization fraction, , the theoretical line ratios fall in the range , corresponding to .
Therefore, the observed ratio is not consistent with the theoretical ratios for any sensible density. In fact, the L-functions of the O v 1218 and 1371 Å lines shown in Figure 11 (bottom panel) at temperature do not cross at any density.
Either an overestimation of the 1218 Å O v line flux or an underestimation of the 1317 Å line flux can produce this higher than expected flux ratio. The 1218 Å line would have to be less than half the measured value, or the 1371 Å line would have to be more than double the measured value, to be consistent with a density at . As discussed in Section 3.2 and shown in Figure 2, the O v line at 1371 Å appears in the STIS spectrum with a double peak, indicating an apparent central reversal or overlying absorption. We know of no explanation for this effect, but it could be the cause of a slight flux understimation for this line. On the other hand, in Section 7 we show that the density sensitive O v 1218 Å line does not match the differential emission measure distribution determined from the allowed lines at any density, unless we assume that its actual flux is from 20 to 30% less than measured. We think that such an error can be ascribed to the difficulty in measuring the O v line in the sloping wing of the Ly line, as already discussed in Section 3.2, where we also show a slight discrepancy in the radial velocities measured for the O v 1218 and 1371 Å lines.
7 The $α$ Cen A emission measure distribution
The physical properties of the transition region plasma can be determined by means of an emission measure distribution analysis (cf. Jordan & Brown 1981; Dere & Mason 1981; Pagano et al. 2000). The frequency integrated flux of an effectively thin emission line between levels and of an atom, in units erg cm-2 s-1, can be written as:
| (3) |
where (cm-3) is the number density of the upper level, (s-1) is the Einstein A-coefficient of the line for a transition between levels and , and (cm-3) is the electron density. With a high degree of accuracy, the ratio is a function only of temperature and density . For resonance lines formed at transition region temperatures, this ratio is a weak function of and a strongly peaked function of , say . Therefore, defining the differential emission measure as:
| (4) |
equation 3 can be written as:
| (5) |
The differential emission measure can in principle be determined from a set of emission line fluxes, by an inversion of the set of the corresponding integral equations (eq. 5). The total emission measure for the emitting plasma is the integral over of the function. Since emission lines are typically formed over a temperature range of , we determine the differential emission measure for all plasma with temperature in the range log 0.15 to log 0.15. The shape of the emission measure distribution is constrained by the combination of the loci from different emission lines, where the emission measure locus of each line, in units of cm-5, is given by:
| (6) |
where represents the amount of isothermal material needed to produce the observed line flux.
We have derived the emission measure loci as a function of temperature for each emission line of interest using equation 6, the functions computed with the CHIANTI database VERSION 4.0 (Dere et al. 1997; Young et al. 2003), the ionization equilibrium as in Mazzotta et al. (1998), and the $α$~Cen~A photospheric abundances listed in Table 2. Following the procedure described in Pagano et al. (2000), we derive the differential emission measure distribution shown in Figure 12. We used the allowed lines of Si ii, S ii, C ii, S iii, Si iii, C iii, S iv, O v, and Fe xii observed in the STIS spectrum, which are labelled in the last column of Table 3 with the letters “emd”. We have also used the allowed lines C ii 1036 & 1037 Å, N iii 990 Å, S iii 1077 Å, Si iii 1108 Å, S iv 1062 & 1063 Å, Ne v 1145 Å, and O vi 1037 Å observed in the FUSE spectrum of $α$~Cen~A (Redfield et al., 2002). When more than two lines for a given ion have been used, the errorbars in Figure 12 represent the standard deviation of the emission measures computed for the different lines. Otherwise, the errorbar is indicative of the uncertainty due to the line flux measurement. The allowed C iv 1548 & 1502 Å, Si iv 1393 & 1402 Å, N v 1238 & 1242 Å, and S vi 933 Å lines were not used to derive the differential emission measure distribution, because Del Zanna, Landini, & Mason (2002) showed that such lines from the Li and Na isoelectronic sequences, which were commonly used in previous literature, produce erroneous results in the determination of emission measures. In Figure 12 emission measure loci of the C iv, Si iv, N v, and S vi lines are, in fact, anomalous with respect to the emission measure distribution derived from the other ions.

In Figure 12 we also plot for comparison the differential emission measure distribution for the quiet Sun (Landi & Landini, 1998) and for solar active regions (Dere & Mason, 1993). There is close agreement between the differential emission measure distributions of $α$~Cen~A and the quiet Sun in the range 5.0–5.6. For temperatures below , the emission measure is larger for $α$~Cen~A than for the quiet Sun. At temperatures higher than we have only the Fe xii 1242 Å line in the STIS spectrum, therefore it is not possible to constrain the real slope of the emission measure distribution. There is, however, a reasonable good agreement between the emission measure of Fe xii and the values derived at temperatures and 6.3 from Chandra spectra (Raassen et al., 2003).
The spin-forbidden lines can be used to obtain information on the plasma density by comparing their emission measure loci, computed for different values of the density, with the emission measure distribution derived by using the resonance lines. In fact, for collisionally de-exicited spin-forbidden lines (i.e., when and cm-3 s-1 is the total collision rate out of level ), the ratio in Equation 3 is proportional to . Therefore, the emission measure loci of spin-forbidden lines depend upon both electron density and temperature. In Figure 12 we have plotted the emission measures of the intersystem O iii 1666Å, S iv 1406 Å, N iv 1486 Å, and O v 1218 Å lines, and the mean emission measure of the O iv lines at 1397, 1399, 1401, and 1407 Å. The O iii and O iv ions match the emission measure distribution derived from allowed lines for electron density log =9.5–10, and lie above at higher densities. The S iv, N iv, and O v lines do not strictly match the emission measure distribution at any density. A possible explanation for this behaviour is that the fluxes of these lines are slightly overestimated (no more than 50%). As shown in Figure 13, the S iv 1406 Å and N iv 1486 Å lines are very well detected in the STIS $α$~Cen~A spectrum, and a flux overestimation could be caused only by unknown blends. Alternatively, inaccurate atomic data could be the cause of the observed discrepancy. For the O v 1218 Å line, a flux from 20 to 30% less than measured would make this line consistent with the emission measure distribution derived from the allowed lines. As seen in Section 6.2, the anomalous ratio between 1218 and 1371 Å line fluxes also suggests that the O v 1218 Å line flux was overestimated, possibly because of the sloping Ly wings (cf. Section 3.2).
The total power radiated per unit (surface) area from the stellar atmosphere is:
| (7) |

where is the total power radiated in all spectral features per unit emission measure and for a specified set of atomic abundances. Above log hydrogen is predominantly ionized, therefore . By using the analytical expression for given by Rosner et al. (1978) and the differential emission measure derived above, we find a radiative power loss of 1.5106 erg s-1 cm-2, i.e. 2.4, for the plasma in the temperature range log . This result is compatible with the estimate of the total power radiated between 104 and 108 K, excluding hydrogen emission, which can be computed from the surface flux of the C iv lines by using the Bruner & McWhirter (1988) empirical relation, P=f(CIV 1548+1550 Å)/3.0 10-4. For $α$~Cen~A this formula predicts P=5.7. Focusing on only the regions for which we have derived a very well constrained emission measure distribution, that are those in the temperature range log , we find that their radiative power loss is 4.2105 erg s-1 cm-2 or 6.5.
With the same method described above, we have computed the power loss from Solar Active regions and from the Quiet Sun adopting their emission measure distributions as in Figure 12. For the temperature range range log we find a power loss of 8.3105 erg s-1 cm-2 (1.3) from Solar Active Regions, and of 2.6105 erg s-1 cm-2 (4.0) from the Quiet Sun. The $α$~Cen~A power loss in the same temperature range is therefore midway between those of the Quiet Sun and the Solar Active Regions, but closer to the former than to the latter.
8 The Interstellar medium towards Cen
A number of lines in the $α$~Cen~A spectrum contain interstellar absorption components (look for label ”ISM” in the column of the Table 3). The analysis of these components will be presented and analyzed in a subsequent paper. We call here attention to the narrow absorption features in the Si iv 1393 Å, C iv 1548 Å, and N v 1238 Å lines shown in Figure 5. We think that these features could be real. In fact, if they were an artifact of the line spread function, then they would appear in all emission lines, not just the high excitation lines. Also the possibility that these features are the results of order overlapping, in the case the wavelength scales of two adjacent orders were not consistent, was examined and disregarded. In fact, not one of the above emission lines lies in the overlap region of two adjacent orders. Although the central reversals in N v and perhaps C iv could be noise, the reversal in theSi iv line appears to be too deep and includes too many pixels to be just noise. The reality of the Si IV feature suggests that the other features could be real. If the reversals are real, then what is their cause? Self-absorption should affect both lines in a doublet, but the weaker members of the doublet do not show absorption features. Perhaps we are detecting narrow absorption by some cool species above the hot regions. Since these possible absorption features are too narrow to be thermal, we have no explanation for them, and further observations and analysis are needed to verify their reality and, if real, search for their cause.
9 Conclusions
We present our analysis of HST/STIS observations of $α$~Cen~A and compare its spectrum with its near twin, the Sun:
(1) We present a high resolution () spectrum of $α$~Cen~A obtained using the E140H mode of STIS that covers the spectral range 1140–1670 Å with very high signal-to-noise. The spectrum has an absolute flux calibration accurate to %, an absolute wavelength accuracy of 0.6–1.3 km s-1, and and is corrected for scattered light. To our knowlege this is the best available ultraviolet spectrum of a solar-like star.
(2) As strange as this may at first appear, there is no available ultraviolet reference spectrum of the Sun as a point source with the characteristics of the $α$~Cen~A spectrum that can be used to compare stellar spectra with the Sun. Many ultraviolet spectra of the Sun do exist, but they either have lower spectral resolution, lack wavelength or flux accuracy, or do not include the center-to-limb variation across the solar disk required to provide an accurate spectrum of the Sun as a point source. Although $α$~Cen~A differs slightly from the Sun in effective temperature, gravity, and metal abundance, its spectrum can serve as a representative solar spectrum for comparison with other stars.
(3) We compare the $α$~Cen~A spectrum to the solar irradiance (the Sun viewed as a point source) derived from UVSP data for the “mean intensity over the disk” by placing the Sun at the distance to $α$~Cen~A and shifting the $α$~Cen~A spectrum by the star’s radial velocity. The line widths of the two stars are similar for chromospheric lines, but the transition region lines of $α$~Cen~A are broader than those of the Sun by roughly 20%. The line surface fluxes are typically larger on $α$~Cen~A, presumably due to $α$~Cen~A being somewhat metal rich. However, the He ii 1640 Å line is stronger in the Sun, indicating that the solar corona is more active.
(4) We also compare the $α$~Cen~A spectrum to the solar irradiance derived from SUMER spectra of the disk center quiet Sun, assuming constant center-to-limb radiance and shifting the $α$~Cen~A wavelength scale by the radial velocity of the star. A total of 671 emission lines are detected in the $α$~Cen~A spectrum from 37 different ions and 2 molecules (CO and H2). In addition to the well known chromospheric and transition region lines, we also identify lines of Al iv, Si viii, S v, Ca vii, Fe iv, Fe v, and Fe xii. A total of 172 emission lines observed in $α$~Cen~A are not seen in the SUMER spectrum.
(5) Broad wings are present in the strong resonance lines of C iv, N v, Si iii, and Si iv, as are seen in solar observations of the chromospheric network. We fit the line profiles with two Gaussians: a narrow component ascribed to Alfvén waves in small magnetic loops, and a broad component ascribed to microflares or magneto-acoustic waves in large coronal funnels. Both components are redshifted with the narrow Gaussians having larger redshifts as is seen on the Sun. At line formation temperatures between 20,000 K and 200,000 K, there is a trend of increasing line redshift, similar to but with a somewhat lower magnitude than the quiet Sun. A similar trend of increasing nonthermal velocities with temperature is nearly identical to that which is observed in solar quiet and active regions.
(6) Using line ratios and L-functions, we infer that the O iv lines are formed where the electron density is . The S iv and O v lines, however, do not provide reliable values. Values of have been obtained for the Sun and other solar type stars (c.f. Cook et al. 1995). It is hard to make any comparison with these results because they are strongly affected by the adopted atomic calculation or by the choice of lines with a limited density sensitivity, as the O iv 1400 Å line (see Del Zanna, Landini, & Mason 2002). Hence estimates of from different computations are often not consistent. We can, however, compare the electron density we derive for Cen A at with the electron density derived by Del Zanna, Landini, & Mason (2002) for Capella (G1 III + G8 III) and AU Mic (dM1e), because we use the same computation methods. The comparison tell us that at the electron density is slightly less in Cen A than in the more active Capella () and AU Mic ().
(7) The emission measure distribution of $α$~Cen~A derived from emission lines of ions not in the Li and Na isoelectronic sequences is in close agreement with that of the quiet Sun in the temperature range , but lies somewhat above the quiet Sun in the temperature range . This could be explained by the higher metal abundance of $α$~Cen~A combined with a somewhat less active corona that provides less conductive heating to the upper transition region. The estimated total radiative power loss from the transition region () is erg s-1 cm-2, corresponding to .
Acknowledgements.
This work is supported by NASA grant S-56500-D to NIST and the University of Colorado. We thanks Dr. Joseph B. Gurman, who kindly provided us information about the UVSP/SMM solar spectrum, and Dr. Richard Shine and Dr. Zoe Frank who made it available.References
- Ayres et al. (1995) Ayres, T.R., Fleming, T.A., Simon, T., et al., ApJS, 96, 223
- Bevington’s (1969) Bevington P.R., 1969, in Data Reduction and Error Analysis for the Physical Science (New York: McGraw-Hill)
- Bohlin, Dickinson, & Calzetti (2001) Bohlin, R.C., Dickinson, M/E., & Calzetti, D. 2001, AJ, 122, 2118
- Boesgaard & Hagen (1974) Boesgaard, A.M., Hagen, W., 1974, ApJ 189, 85
- Brage et al. (1996) Brage, T., Judge, P.G., & Brekke, P. 1996, ApJ, 464, 1030
- Brekke (1993a) Brekke, P. 1993, ApJ, 408, 735
- Brekke (1993b) Brekke, P. 1993, ApJS, 87, 443
- Brekke et al. (2000) Brekke, P., Thompson, W.T., Woods, T.N., & Eparvier, F.G., ApJ, 536, 959
- Bruner & McWhirter (1988) Bruner, M.E., & McWhirter, R.W.P. 1988, ApJ, 326, 1002.
- Chae et al. (1998) Chae, J., Yun, H.S., & Poland, A.I. 1998, ApJS, 114, 151
- Cook et al. (1995) Cook, J.W., Keenan, F.P., Dufton, P.L., et al., 1995, ApJ, 444, 936
- Curdt et al. (2001) Curdt, W., Brekke, P., Feldman U., et al., 2001, A&A, 375, 591
- Del Zanna, Landini, & Mason (2002) Del Zanna, G., Landini, M., & Mason, H.E. 2002, A&A, 385, 968
- Dere et al. (1989) Dere, K.P., Bartoe, J.-D.F., & Brueckner, G.E. 1989, Sol. Phys., 123, 41
- Dere et al. (1997) Dere, K.P., Landi, E., Mason, H.E., Monsignori Fossi, B.C., Young, P.R. 1997, A&AS, 125, 149
- Dere & Mason (1981) Dere, K.P., & Mason, H.E. 1981, in Solar Active Regions, ed. F.Q. Orrall, Colorado Univ. Press, 129
- Dere & Mason (1993) Dere, K.P., & Mason, H.E. 1993, Sol. Phys., 144, 217
- Dufton et al. (1982) Dufton, P.L., Hibbert, A., Kingston, A.E., & Doschek, G.A. 1982, ApJ, 258, 548
- Feldman et al. (1975) Feldman, U., Doschek, G.A., VanHoosier, M.E., & Tousey, R. 1975, ApJ, 199, L67
- Feldman et al. (1997) Feldman, U., Behring, W.E., Curdt, W., Schühle, U., Wilhelm, K., Lemaire, P., & Moran, T.M. 1997, ApJSS, 113, 195
- Feltzing & Gonzalez (2001) Feltzing, S., Gonzalez, G. 2001, A&A, 367, 253
- Grevesse & Sauval (1998) Grevesse, N., & Sauval, A.J. 1998, Space Science Reviews, 85, 161
- Guenther & Demarque (2000) Guenther D.B. & Demarque P. 2000, ApJ, 531, 503
- Hallam et al. (1991) Hallam, K.L., Altner, B., Endal, A.S., 1991, ApJ, 372, 610
- Harper et al. (1999) Harper, G. M., Jordan, C., Judge, P. G., Robinson, R. D., Carpenter, K. G., & Brage, T. 1999, MNRAS, 303, L41
- Jordan (1967) Jordan, C. 1967, Sol. Phys., 2, 441
- Jordan (1975) Jordan, C. 1975, MNRAS, 170, 429
- Jordan & Brown (1981) Jordan, C., & Brown, A. 1981, in Solar Phenomena in Stars and Stellar Systems, ed. R.M. Bonnet and A.K. Dupree (Dordrecht: Reidel), 199
- Jordan et al. (1987) Jordan, C., Ayres, T.R., Brown, A., Linsky, J.L., Simon, T. 1987, MNRAS, 225, 903
- Judge et al. (1995) Judge, P.G., Woods, T.N., Brekke, P., & Rottman, G.J. 1995, ApJ, 455, L85
- Kelly (1982) Kelly, R.L. 1982, in Atomic and Ionic Spectrum Lines Below 200 Å, ORNL-592
- Kimble et al. (1998) Kimble, R.A., et al. 1998, ApJ, 492, L83
- Landi & Landini (1997) Landi, E. & Landini, M. 1997, A&A, 327, 1230
- Landi & Landini (1998) Landi, E. & Landini, M. 1998, A&A, 340, 265
- Leitherer et al. (2001)
- Lindler (1999a)
- Lindler (1999b)
- Linsky & Wood (1994) Linsky, J.L., & Wood, B.E. 1994, ApJ, 430, 342
- Linsky et al. (1995) Linsky, J.L., Wood, B.E., Judge P., Brown, A., Andrulis, C., & Ayres, T.R. 1995, ApJ, 442, 381
- Linsky& Wood (1996) Linsky, J.L., Wood B.E. 1996, ApJ, 463, 254
- Linsky et al. (1998) Linsky, J.L., Wood, B.E., Brown, A., & Osten, R.A. 1998, ApJ, 492, 767
- Mauas et al. (1989) Mauas, P.J., , Avrett, E.H., & Loeser, R., 1989, ApJ, 345, 1104
- Mazzotta et al. (1998) Mazzotta, P., Mazzitelli, G., Colafrancesco, S., & Vittorio, N. 1998, A&AS, 133, 403
- Morel et al. (2000) Morel, P., Provost, J., Lebreton, Y., Thévenin, F., and Berthomieu, G. 2000, A&A, 363, 675
- Neff et al. (1989) Neff, J.E., Walter, F.M., Rodonò, M., & Linsky, J.L. 1989,A&A, 215, 79
- Pagano et al. (2000) Pagano, I., Linsky, J.L., Carkner, L., Robinson, R.D., Woodgate, B., & Timothy G. 2000, ApJ, 532, 497
- Pagano et al. (2003) Pagano, I., Linsky, J.L., Curdt, W., et al., in preparation
- Perryman et al. (1997) Perryman, M.A.C., et al., 1997, A&A, 323, L49
- Peter (2001) Peter, H. 2001, A&A, 374, 1108
- Pourbaix (1999) Pourbaix, D., Neuforge-Verheecke, C., & Noels, A. 1999, A&A, 344, 172
- Pourbaix et al. (2002) Pourbaix, D. et al. 2002, A&A, 386, 280
- Raassen et al. (2003) Raassen, A.J.J., Ness, J.-U., Mewe, R., van der Meer, R.L.J., Burwitz, V., & Kaastra, J.S. 2003, A&A, in press
- Redfield et al. (2002) Redfield, S., Linsky, J.L., Ake, T.B., Ayres, T.R., Dupree, A.K.; Robinson, R.D., Wood, B.E., Young, P.R. 2002, ApJ, 581, 626
- Rosner et al. (1978) Rosner, R., Tucker, W.H., and Vaiana, G.S. 1978, ApJ, 220, 643
- Rottman, Woods, & Sparn (1993) Rottman, G.J., Woods, T.N., & Sparn, T.P. 1993, J. Geophys. Res., 98, 10667
- Roussel-Dupré (1983) Roussel-Dupré, D. 1983, ApJ, 275, 892
- Saar & Osten (1997) Saar, S.H., & Osten, R.A. 1997, MNRAS 284, 803
- Samain (1991) Samain, D. 1991, A&A, 244, 217
- Sandlin et al. (1986) Sandlin, G.D., Bartoe, J.-D.F., Brueckner, G.E., Tousey, R., & VanHoosier, M.E. 1986, ApJS, 61, 801
- Shine & Frank (2000) Shine, R., & Frank, Z. 2000, data retrivable from .
- Teriaca et al. (1999) Teriaca, L., Banerjee, D., Doyle, J.G. 1999, A&A, 349, 636
- Wilhelm et al. (1998) Wilhelm, K., Lemaire, P., & Dammasch, I.E., 1998, A&A, 334, 685
- Wilhelm et al. (1999) Wilhelm, K., Woods, T.N., Schühle, U., et al., 1999, A&A, 352, 321
- Wood (1996) Wood, B.E. 1996, Ph.D. Thesis, University of Colorado
- Wood et al. (1997) Wood, B.E., Linsky, J.L., & Ayres, T.R. 1997, ApJ, 478, 745
- Wood et al. (2001) Wood, B.E., Linsky, J.L., Müller, H.-R., Zank, G. 2001, ApJ, 547, L49
- Woods & Rottman (1990) Woods, T.N., & Rottman, G.J. 1990, J. Geophys. Res., 95, 6227
- Woodgate et al. (1980) Woodgate, B.E. et al. 1980, Sol. Phys., 65, 73
- Woodgate et al. (1998) Woodgate, B.E., et al. 1998, PASP, 110, 1183
- Young et al. (2003) Young, P.R., Del Zanna, G., Landi, E., Dere, K.E., Mason, H.E., Landini, M 2003, ApJS, 144, 135.
- Zirin (1975) Zirin, H. 1975, ApJ, 199, L63
| Linea | Lab | Observed | Velocityb | Flux | FWHMc | Notesd |
|---|---|---|---|---|---|---|
| ID | Wavelength | Wavelength | Shift | (10-15) | ||
| (Å) | (Å) | km s-1 | erg cm-2 s-1 | km s-1 | ||
| C III | 1174.933 | 1174.8595 0.0009 | 4.7 0.2 | 162.0 3.7 | 47.7 0.4 | emd |
| C III | 1175.263 | 1175.1910 0.0008 | 5.1 0.2 | 125.2 3.8 | 49.1 0.5 | emd |
| C III | 1175.590 | 1175.4908 0.0070 | -1.8 1.8 | 111.2 7.1 | 49.5 0.4 | emd |
| C III | 1175.711 | 1175.6449 0.0031 | 6.6 0.8 | 402.2 4.7 | 48.4 0.4 | emd |
| C III | 1175.987 | 1175.9141 0.0008 | 4.8 0.2 | 114.0 3.7 | 48.0 0.7 | emd |
| C III | 1176.370 | 1176.2869 0.0008 | 2.3 0.2 | 155.8 3.9 | 51.2 1.8 | emd |
| Si II | 1190.416 | 1190.3302 0.0009 | 1.8 0.2 | 37.7 3.0 | 39.5 0.5 | emd, ISM |
| Si II | 1193.289 | 1193.2031 0.0008 | 1.9 0.2 | 23.6 4.3 | 56.0 0.4 | emd, ISM |
| S III+ C I | 1194.020/.064 | 1193.9884 0.0008 | 17.8 4.5 | 59.1 0.5 | ||
| Si II | 1194.500 | 1194.4117 0.0008 | 1.3 0.2 | 53.5 4.5 | 58.2 0.4 | emd |
| Si II | 1197.394 | 1197.3188 0.0009 | 4.6 0.2 | 23.9 3.5 | 45.5 0.4 | emd |
| S V | 1199.134 | 1199.0846 0.0007 | 11.1 0.2 | 29.7 4.9 | 64.0 0.4 | NIST |
| N I | 1199.549 | 1199.4596 0.0010 | 1.1 0.3 | 55.2 2.7 | 35.3 0.5 | ISM |
| N I | 1200.224 | 1200.1270 0.0011 | -0.8 0.3 | 48.9 2.3 | 29.4 0.5 | ISM |
| N I | 1200.711 | 1200.6163 0.0009 | -0.2 0.2 | 27.6 3.2 | 41.2 0.5 | ISM |
| S III | 1200.966 | 1200.8907 0.0010 | 4.7 0.2 | 33.5 2.9 | 37.4 0.5 | emd |
| 1201.3582 0.0019 | 5.0 0.8 | 10.2 0.9 | ||||
| 1201.9110 0.0017 | 4.0 0.9 | 11.9 0.9 | ||||
| 1202.5665 0.0019 | 7.1 0.8 | 10.1 0.9 | ||||
| S I | 1203.440 | 1203.3491 0.0026 | 0.8 0.6 | 3.0 0.4 | 5.5 1.3 | Kelly (1982) |
| S V + S I | 1204.300/.33 | 1204.2095 0.0013 | 19.0 1.7 | 21.7 0.6 | Curdt et al. (2001) | |
| 1204.3019 0.0016 | 7.2 1.1 | 13.9 0.8 | ||||
| 1205.0609 0.0021 | 2.3 0.6 | 8.0 1.0 | ||||
| S I | 1205.565 | 1205.4757 0.0086 | 1.3 2.1 | 10.3 3.4 | 15.9 6.5 | |
| Si III | 1206.510 | 1206.4255 0.0010 | 2.5 0.2 | 1893.0 4.1 | 53.0 1.0 | emd, NC+BC |
| S I | 1207.015 | 1206.9293 0.0023 | 2.2 0.6 | 4.2 0.5 | 7.1 1.1 | |
| 1207.0967 0.0030 | 1.9 0.3 | 4.0 1.5 | Sandlin-1 1207.21 | |||
| 1207.6364 0.0013 | 6.6 1.6 | 21.2 0.6 | Sandlin-1 1207.71 | |||
| P I | 1208.430 | 1208.3192 0.0025 | -4.0 0.6 | 3.0 0.5 | 6.0 1.2 | NIST |
| S I | 1208.850 | 1208.7595 0.0013 | 1.0 0.3 | 13.0 1.6 | 20.6 0.7 | |
| S I | 1211.212 | 1211.1201 0.0013 | 0.7 0.3 | 9.4 1.7 | 22.7 0.6 | |
| Ly alpha | 1215.670 | 1215.5780 0.0005 | 0.8 0.1 | 104377.8 333.3 | 155.4 0.5 | NIST, multi comp. |
| O V | 1218.344 | 1218.2682 0.0008 | 4.8 0.2 | 266.9 13.3 | 55.3 1.9 | NIST |
| 1227.9579 0.0020 | 5.5 0.7 | 9.4 1.0 | ||||
| S I | 1229.608 | 1229.5201 0.0019 | 2.0 0.5 | 2.6 0.8 | 11.0 0.9 | |
| N V | 1238.821 | 1238.7335 0.0032 | 2.3 0.8 | 287.0 3.7 | 48.4 0.4 | NC+BC, ISM |
| S I | 1241.905 | 1241.8154 0.0020 | 1.8 0.5 | 1.8 0.7 | 9.2 1.0 | |
| Fe XII | 1242.000 | 1241.8970 0.0011 | -1.4 0.3 | 6.3 2.6 | 33.3 (imposed) | |
| C I | 1242.230 | 1242.1324 0.0039 | -0.1 0.9 | 1.0 0.3 | UL | |
| 1242.3331 0.0020 | 1.7 0.7 | 9.5 1.0 | ||||
| 1242.4186 0.0014 | 6.9 1.5 | 19.5 0.7 | ||||
| N V | 1242.804 | 1242.7261 0.0017 | 4.7 0.4 | 141.7 4.0 | 52.1 0.4 | ISM |
| N I+ C I | 1243.180/.14 | 1243.0596 0.0020 | 9.7 1.9 | 24.8 2.6 | ||
| N I | 1243.307 | 1243.2079 0.0021 | -0.5 0.5 | 6.0 1.8 | 22.9 0.6 | |
| C I | 1243.518 | 1243.4125 0.0013 | -2.0 0.3 | 5.4 1.7 | 22.5 0.6 | Kelly (1982) |
| C I | 1243.784 | 1243.6854 0.0018 | -0.3 0.4 | 2.0 0.9 | 12.0 0.9 | Kelly (1982) |
| C I | 1243.998 | 1243.8966 0.0017 | -1.0 0.4 | 4.8 1.0 | 13.4 0.8 | Kelly (1982) |
| Ca II + C I | 1244.060/.127 | 1244.0105 0.0014 | 2.6 1.6 | 20.4 0.7 | ||
| C I | 1244.535 | 1244.4336 0.0016 | -1.0 0.4 | 7.2 1.2 | 16.1 0.7 | Kelly (1982) |
| C I + Ca II | 1244.996/.99 | 1244.8947 0.0017 | 3.2 1.0 | 12.7 0.8 | Kelly (1982) (C I) | |
| C I | 1245.183 | 1245.0857 0.0016 | 0.0 0.4 | 5.0 1.2 | 15.1 0.8 | Kelly (1982) |
| C I | 1245.538 | 1245.4320 0.0016 | -2.1 0.4 | 3.8 1.2 | 16.1 0.7 | Kelly (1982) |
| C I | 1245.943 | 1245.8478 0.0016 | 0.5 0.4 | 7.7 1.2 | 15.1 0.8 | Kelly (1982) |
| C I | 1246.180 | 1246.0800 0.0018 | -0.6 0.4 | 3.6 1.0 | 12.7 0.8 | Kelly (1982) |
| 1246.5189 0.0039 | 1.0 0.2 | UL | ||||
| C I | 1246.862 | 1246.7611 0.0016 | -0.8 0.4 | 8.9 1.2 | 15.9 0.7 | Kelly (1982) |
| C I | 1246.940 | 1246.8567 0.0029 | 3.4 0.7 | 1.2 0.4 | 4.7 1.4 | |
| S I | 1247.160 | 1247.0626 0.0018 | 0.0 0.4 | 5.2 0.9 | 12.0 0.9 | |
| C III | 1247.383 | 1247.2896 0.0010 | 1.0 0.2 | 6.2 3.3 | 42.5 0.5 | emd |
| C I | 1247.867 | 1247.7620 0.0015 | -1.8 0.4 | 7.1 1.3 | 16.3 0.7 | Kelly (1982) |
| C I | 1248.009 | 1247.9132 0.0015 | 0.4 0.4 | 9.9 1.4 | 18.3 0.7 | Kelly (1982) |
| C I | 1249.004 | 1248.9060 0.0016 | -0.1 0.4 | 6.6 1.1 | 14.6 0.8 | Kelly (1982) |
| C I | 1249.405 | 1249.3002 0.0014 | -1.7 0.3 | 12.3 1.5 | 19.1 0.7 | Kelly (1982) |
| C I + Si II | 1250.423/.433 | 1250.3245 0.0014 | 9.7 1.5 | 20.1 0.7 | Kelly (1982) (C I) | |
| S II | 1250.584 | 1250.4974 0.0013 | 2.7 0.3 | 15.5 1.9 | 24.9 0.6 | emd |
| Si II + C I | 1251.164/.176 | 1251.0778 0.0014 | 13.7 1.5 | 19.6 0.7 | Kelly (1982) (C I) | |
| C I | 1252.200 | 1252.1028 0.0016 | 0.2 0.4 | 7.8 1.1 | 14.5 0.8 | |
| S I | 1253.325 | 1253.2291 0.0022 | 0.5 0.5 | 2.1 0.6 | 8.2 1.0 | |
| C I | 1253.467 | 1253.3693 0.0013 | 0.1 0.3 | 19.1 1.7 | 22.2 0.6 | |
| S II | 1253.811 | 1253.7173 0.0012 | 1.0 0.3 | 29.8 2.0 | 26.5 0.6 | emd, NIST |
| C I | 1254.513 | 1254.4180 0.0015 | 0.8 0.4 | 10.4 1.3 | 17.1 0.7 | Kelly (1982) |
| Si I | 1255.276 | 1255.1732 0.0013 | -1.1 0.3 | 10.9 1.7 | 22.6 0.6 | |
| 1255.2924 0.0013 | 2.4 1.7 | 21.7 2.1 | Sandlin-1 1255.42 | |||
| 1256.0272 0.0013 | 2.6 1.8 | 23.8 0.6 | ||||
| C III + C I | 1256.470/.498 | 1256.3893 0.0011 | 37.0 2.5 | 32.3 0.5 | ||
| C I | 1257.565 | 1257.4651 0.0015 | -0.4 0.4 | 10.4 1.3 | 17.1 0.7 | |
| Si I | 1258.795 | 1258.6921 0.0011 | -1.1 0.3 | 38.3 2.5 | 32.1 0.5 | |
| S II | 1259.530 | 1259.4275 0.0012 | -1.0 0.3 | 49.5 2.2 | 29.2 0.5 | emd |
| Si II | 1260.421 | 1260.3027 0.0009 | -4.7 0.2 | 82.0 4.0 | 51.4 0.4 | CR, emd, ISM |
| C I | 1260.613 | 1260.5212 0.0018 | 1.6 0.4 | 10.9 1.0 | 12.8 0.8 | |
| C I | 1260.927 | 1260.8337 0.0016 | 1.3 0.4 | 2.7 1.2 | 15.6 0.8 | |
| Ca VII | 1261.070 | 1260.9786 0.0011 | 1.7 0.3 | 6.4 2.6 | 33.5 0.5 | Feldman et al. (1997) |
| C I | 1261.719 | 1261.6206 0.0016 | 0.1 0.4 | 12.7 1.2 | 16.1 0.7 | |
| S I | 1262.860 | 1262.7614 0.0020 | 0.0 0.5 | 2.9 0.8 | 10.1 0.9 | |
| Si II | 1264.737 | 1264.6426 0.0009 | 1.1 0.2 | 225.9 3.9 | 50.2 0.4 | emd,CR |
| Si II | 1265.001 | 1264.9167 0.0011 | 3.5 0.3 | 65.8 2.4 | 31.5 0.5 | emd, CR |
| Fe II | 1265.639 | 1265.5498 0.0017 | 2.3 0.4 | 1.7 1.1 | 13.7 0.8 | |
| C I | 1266.270 | 1266.1687 0.0015 | -0.5 0.4 | 12.0 1.4 | 18.2 0.7 | |
| C I | 1266.415 | 1266.3159 0.0016 | -0.0 0.4 | 21.7 1.2 | 15.6 0.8 | |
| C I | 1266.517 | 1266.4181 0.0016 | 0.0 0.4 | 6.1 1.2 | 15.8 0.7 | |
| C I | 1266.604 | 1266.5135 0.0018 | 2.0 0.4 | 3.3 0.9 | 12.2 0.8 | |
| C I | 1267.596 | 1267.4885 0.0014 | -2.0 0.3 | 16.0 1.7 | 21.5 0.6 | |
| C I | 1268.051 | 1267.9519 0.0017 | 0.0 0.4 | 1.9 1.1 | 14.7 0.8 | Kelly (1982) |
| S I | 1269.209 | 1269.1121 0.0020 | 0.6 0.5 | 2.1 0.8 | 10.5 0.9 | |
| Fe II | 1269.353 | 1269.2498 0.0029 | -0.9 0.7 | 1.0 0.4 | 4.9 1.3 | |
| S I | 1270.782 | 1270.6803 0.0018 | -0.5 0.4 | 12.9 1.0 | 13.1 0.8 | |
| S I | 1272.075 | 1271.9768 0.0153 | 0.3 3.6 | 2.0 1.0 | 13.6 0.8 | |
| Fe II + Fe II | 1272.613/.655 | 1272.5409 0.0015 | 3.1 1.7 | 22.4 0.6 | ||
| C I | 1274.109 | 1274.0189 0.0014 | 2.3 0.3 | 4.5 1.6 | 20.5 0.7 | |
| C I | 1274.756 | 1274.6608 0.0017 | 1.1 0.4 | 10.8 1.1 | 14.1 0.8 | |
| C I | 1274.984 | 1274.8885 0.0016 | 1.0 0.4 | 25.4 1.3 | 16.8 0.7 | |
| C I | 1275.288 | 1275.1871 0.0019 | -0.3 0.4 | 4.9 0.9 | 11.1 0.9 | Kelly (1982) |
| Fe II | 1275.807 | 1275.6993 0.0015 | -1.8 0.4 | 2.0 1.3 | 17.3 0.7 | |
| C I | 1276.287 | 1276.1793 0.0013 | -1.8 0.3 | 17.6 1.8 | 22.9 0.6 | |
| C I | 1276.483 | 1276.3953 0.0018 | 2.8 0.4 | 1.7 1.0 | 13.1 0.8 | |
| C I + Fe II | 1276.750/.801 | 1276.6709 0.0013 | 4.0 1.9 | 25.2 0.9 | ||
| C I | 1277.042 | 1276.9420 0.0018 | -0.0 0.4 | 2.9 1.0 | 12.6 0.8 | |
| C I + C I | 1277.245/.283 | 1277.1478 0.0010 | 12.2 3.4 | 44.3 0.6 | ||
| C I + C I | 1277.513/.550 | 1277.4358 0.0010 | 11.0 2.9 | 38.1 0.5 | ||
| C I | 1277.723 | 1277.6309 0.0012 | 1.8 0.3 | 7.7 2.3 | 29.7 0.5 | |
| C I | 1277.954 | 1277.8563 0.0014 | 0.5 0.3 | 6.3 1.5 | 20.0 0.7 | |
| C I | 1279.056 | 1278.9625 0.0013 | 1.5 0.3 | 7.2 1.7 | 22.5 0.6 | |
| C I | 1279.228 | 1279.1331 0.0013 | 1.2 0.3 | 9.1 2.0 | 25.4 0.6 | CR |
| C I | 1279.498 | 1279.3999 0.0015 | 0.5 0.3 | 6.5 1.5 | 19.2 0.7 | |
| C I | 1279.890 | 1279.7957 0.0012 | 1.3 0.3 | 9.7 2.2 | 29.0 1.1 | CR |
| C I | 1280.135 | 1280.0341 0.0042 | -0.2 1.0 | 5.8 1.9 | 24.1 0.6 | CR |
| C I + C I | 1280.333/.404 | 1280.2679 0.0009 | 10.4 3.5 | 45.5 2.1 | CR | |
| C I | 1280.597 | 1280.5023 0.0012 | 1.3 0.3 | 6.5 2.1 | 27.1 0.6 | CR |
| C I | 1280.847 | 1280.7476 0.0012 | 0.2 0.3 | 6.5 2.2 | 28.0 0.6 | CR |
| C I | 1287.608 | 1287.5009 0.0017 | -1.5 0.4 | 1.9 1.1 | 14.4 0.8 | |
| C I | 1288.037 | 1287.9391 0.0016 | 0.7 0.4 | 11.4 1.2 | 16.0 0.7 | |
| C I | 1288.422 | 1288.3242 0.0015 | 0.7 0.3 | 26.4 1.5 | 19.7 0.7 | |
| C I | 1288.710 | 1288.6100 0.0018 | 0.2 0.4 | 6.4 1.0 | 12.7 0.8 | |
| C I | 1288.917 | 1288.8190 0.0018 | 0.7 0.4 | 6.5 1.0 | 12.9 0.8 | |
| C I | 1289.891 | 1289.7894 0.0019 | -0.2 0.4 | 4.9 0.9 | 11.8 0.9 | |
| C I | 1289.977 | 1289.8774 0.0016 | 0.3 0.4 | 14.8 1.3 | 16.7 0.7 | |
| C I | 1291.304 | 1291.2072 0.0018 | 1.0 0.4 | 6.5 1.0 | 12.4 0.8 | |
| Si III | 1294.543 | 1294.4680 0.0009 | 6.1 0.2 | 15.4 3.9 | 50.5 0.9 | emd |
| S I | 1295.653 | 1295.5519 0.0016 | 0.1 0.4 | 19.9 1.3 | 17.1 0.7 | |
| Fe II | 1296.084 | 1295.9924 0.0017 | 2.3 0.4 | 6.2 1.2 | 15.4 0.8 | |
| S I | 1296.174 | 1296.0760 0.0017 | 0.8 0.4 | 10.6 1.1 | 13.8 0.8 | |
| Fe II | 1296.287 | 1296.1783 0.0016 | -1.7 0.4 | 2.9 1.2 | 15.8 0.7 | |
| Si III | 1296.726 | 1296.6675 0.0011 | 9.9 0.3 | 9.6 2.7 | 35.1 0.5 | emd |
| 1297.3766 0.0026 | 1.0 0.5 | 6.3 1.2 | ||||
| Si III + Si III | 1298.891/.960 | 1298.8571 0.0009 | 49.8 3.7 | 47.6 1.0 | ||
| Fe II | 1299.432 | 1299.3300 0.0014 | -0.1 0.3 | 4.0 1.8 | 23.0 1.0 | |
| S I | 1300.907 | 1300.8074 0.0018 | 0.5 0.4 | 60.4 1.1 | 13.8 0.8 | |
| O I | 1302.169 | 1302.0695 0.0011 | 0.5 0.3 | 806.8 2.6 | 33.8 0.5 | ISM, CR |
| S I | 1302.865 | 1302.7617 0.0016 | -0.3 0.4 | 12.0 1.4 | 17.7 0.7 | |
| S I | 1303.111 | 1303.0084 0.0018 | -0.1 0.4 | 6.3 1.0 | 13.0 0.8 | |
| Si III | 1303.320 | 1303.2518 0.0030 | 7.8 0.7 | 16.3 3.2 | 42.0 1.1 | emd |
| S I | 1303.430 | 1303.3414 0.0025 | 3.1 0.6 | 1.6 0.5 | 6.8 2.2 | |
| Fe II | 1303.898 | 1303.7935 0.0022 | -0.6 0.5 | 1.0 0.7 | 8.9 1.0 | |
| Si II | 1304.372 | 1304.2780 0.0012 | 1.8 0.3 | 73.9 2.5 | 31.9 0.5 | emd, ISM, CR |
| O I | 1304.858 | 1304.7607 0.0011 | 1.1 0.3 | 855.9 2.6 | 34.0 0.5 | CR |
| H2 | 1305.520 | 1305.4186 0.0018 | 0.2 0.4 | 1.4 1.0 | 12.9 1.0 | |
| Si II | 1305.590 | 1305.4906 0.0017 | 0.6 0.4 | 2.7 1.1 | 14.3 0.8 | |
| Ca II | 1305.670 | 1305.5581 0.0016 | -2.3 0.4 | 2.8 1.3 | 16.3 0.7 | |
| O I | 1306.029 | 1305.9283 0.0012 | 0.3 0.3 | 886.7 2.2 | 29.1 0.5 | CR |
| Si II | 1309.277 | 1309.1708 0.0011 | -0.9 0.3 | 73.3 2.6 | 34.1 0.5 | emd, CR |
| 1309.2540 0.0020 | 22.4 1.2 | 11.2 0.9 | ||||
| 1309.2947 0.0013 | 22.0 2.0 | 26.2 0.6 | ||||
| S I + C I | 1310.194/.187 | 1310.0883 0.0017 | 4.0 1.1 | 14.0 0.8 | ||
| N I | 1310.540 | 1310.4359 0.0018 | -0.4 0.4 | 4.8 1.1 | 13.9 0.8 | |
| C I | 1310.637 | 1310.5370 0.0016 | 0.6 0.4 | 12.3 1.2 | 16.2 0.7 | |
| N I | 1310.943 | 1310.8312 0.0015 | -2.1 0.3 | 3.9 1.5 | 19.2 0.7 | |
| C I | 1311.363 | 1311.2642 0.0014 | 0.8 0.3 | 27.9 1.6 | 21.2 0.6 | |
| C I | 1311.924 | 1311.8195 0.0018 | -0.4 0.4 | 9.2 1.0 | 13.4 0.8 | |
| C I | 1312.247 | 1312.1479 0.0018 | 0.8 0.4 | 8.3 1.0 | 13.6 0.8 | |
| Si III | 1312.590 | 1312.5122 0.0010 | 5.7 0.2 | 5.6 3.3 | 42.8 0.5 | emd |
| C I | 1312.853 | 1312.7582 0.0020 | 1.8 0.4 | 1.3 0.9 | 11.3 0.9 | Kelly (1982) |
| S I | 1313.249 | 1313.1505 0.0025 | 1.0 0.6 | 1.7 0.5 | 7.0 1.3 | |
| C I | 1313.387 | 1313.2832 0.0022 | -0.2 0.5 | 3.6 0.7 | 9.2 1.0 | |
| C I | 1313.464 | 1313.3593 0.0016 | -0.5 0.4 | 17.7 1.3 | 16.4 0.7 | |
| C I | 1315.919 | 1315.8174 0.0018 | 0.3 0.4 | 13.3 1.1 | 14.1 0.8 | |
| S I | 1316.542 | 1316.4344 0.0019 | -1.0 0.4 | 16.9 0.9 | 12.0 0.9 | |
| S I | 1316.618 | 1316.5028 0.0017 | -2.8 0.4 | 12.9 1.2 | 15.9 0.7 | |
| Ni II | 1317.220 | 1317.1240 0.0013 | 1.6 0.3 | 20.2 2.0 | 25.5 0.6 | |
| N I + N I | 1318.998/9.005 | 1318.8418 0.0019 | 55.1 1.0 | 12.6 0.8 | ||
| N I | 1319.669/.676 | 1319.5709 0.0020 | 3.3 0.9 | 11.3 0.9 | ||
| S I | 1323.515 | 1323.4136 0.0018 | 0.5 0.4 | 15.8 1.0 | 13.1 0.8 | |
| C II+CII+CII+CII | 1323.862/.906/.951/. | 1323.8492 0.0010 | 9.1 3.6 | 47.2 0.4 | ||
| N I + N I | 1326.564/.571 | 1326.4661 0.0020 | 1.1 0.9 | 11.3 0.9 | ||
| S I | 1326.643 | 1326.5382 0.0018 | -0.2 0.4 | 10.1 1.0 | 13.0 0.8 | |
| C I | 1328.833 | 1328.7305 0.0013 | 0.3 0.3 | 19.6 2.1 | 27.5 0.6 | CR |
| C I + C I | 1329.085/.12 | 1329.0032 0.0011 | 20.6 3.0 | 38.4 0.5 | CR | |
| C I + C I | 1329.578/.60 | 1329.4865 0.0012 | 23.3 3.3 | 42.5 0.5 | CR | |
| C II | 1334.532 | 1334.4385 0.0010 | 2.4 0.2 | 1335.3 3.3 | 43.3 0.5 | emd, ISM, CR |
| Ni II | 1335.203 | 1335.1115 0.0013 | 2.9 0.3 | 10.1 2.1 | 27.7 0.8 | |
| C II | 1335.708 | 1335.6040 0.0010 | 0.1 0.2 | 1846.7 3.7 | 47.8 0.4 | emd, CR |
| 1346.9371 0.0018 | 3.1 1.1 | 13.6 0.8 | ||||
| Cl I | 1351.657 | 1351.5510 0.0019 | -0.1 0.4 | 123.1 0.9 | 12.3 0.8 | |
| C I | 1354.288 | 1354.1864 0.0016 | 1.0 0.4 | 10.9 1.4 | 17.9 0.7 | |
| O I | 1355.598 | 1355.4945 0.0019 | 0.6 0.4 | 188.2 1.0 | 13.0 0.8 | |
| C I | 1355.844 | 1355.7443 0.0014 | 1.4 0.3 | 30.4 1.8 | 23.6 0.6 | |
| S III | 1357.000 | 1356.8817 0.0015 | -2.7 0.3 | 3.6 1.6 | 21.3 0.6 | Feldman et al. (1997) |
| C I | 1357.134 | 1357.0287 0.0016 | 0.2 0.4 | 11.8 1.3 | 17.4 0.7 | |
| C I | 1357.659 | 1357.5486 0.0019 | -0.9 0.4 | 12.3 1.0 | 13.4 0.8 | |
| C I | 1358.188 | 1358.0848 0.0020 | 0.7 0.4 | 4.2 0.9 | 11.2 0.9 | |
| O I | 1358.512 | 1358.4089 0.0019 | 0.7 0.4 | 57.2 1.0 | 12.5 0.8 | |
| 1358.6658 0.0017 | 6.9 1.3 | 16.5 0.7 | Sandlin-1 1358.76 | |||
| C I | 1359.275 | 1359.1742 0.0018 | 1.2 0.4 | 21.6 1.1 | 14.7 0.8 | |
| C I | 1359.438 | 1359.3291 0.0018 | -0.6 0.4 | 7.5 1.1 | 14.9 0.8 | |
| Fe II | 1360.170 | 1360.0717 0.0016 | 1.8 0.4 | 6.6 1.4 | 17.8 0.7 | |
| Fe II | 1361.373 | 1361.2697 0.0017 | 0.7 0.4 | 24.9 1.3 | 16.5 0.7 | |
| Fe II | 1362.748 | 1362.6617 0.0017 | 4.5 0.4 | 2.0 1.3 | 16.7 1.5 | |
| Cl I | 1363.447 | 1363.3184 0.0022 | -4.8 0.5 | 1.7 0.8 | 9.8 0.9 | |
| C I | 1364.164 | 1364.0587 0.0017 | 0.3 0.4 | 25.3 1.3 | 16.7 0.7 | |
| Fe II | 1364.384 | 1364.2802 0.0019 | 0.6 0.4 | 5.0 1.0 | 12.6 0.8 | |
| 1366.2848 0.0019 | 2.2 1.0 | 13.6 0.8 | Sandlin-1 1366.399 | |||
| Fe II | 1368.098 | 1367.9940 0.0018 | 0.7 0.4 | 10.6 1.1 | 14.6 0.8 | |
| Fe II + ?? | 1368.575/. | 1368.4342 0.0011 | 3.0 2.8 | 36.2 0.5 | ||
| Fe II | 1369.707 | 1369.6001 0.0019 | 0.0 0.4 | 3.3 1.0 | 12.6 0.8 | |
| Fe II | 1369.856 | 1369.7393 0.0023 | -2.1 0.5 | 1.6 0.7 | 8.9 1.0 | |
| Ni II | 1370.136 | 1370.0336 0.0014 | 1.0 0.3 | 18.6 1.8 | 23.3 1.0 | ISM |
| O V | 1371.292 | 1371.2152 0.0009 | 6.7 0.2 | 21.5 4.2 | 54.9 0.4 | emd |
| Fe II | 1372.292 | 1372.1858 0.0017 | 0.2 0.4 | 7.3 1.3 | 16.4 0.7 | |
| Fe V | 1373.967 | 1373.8687 0.0142 | 2.0 3.1 | 2.0 1.1 | 10.3 1.5 | |
| Fe V | 1374.116 | 1373.9980 0.0242 | -2.3 5.3 | 5.9 1.2 | 16.0 1.5 | |
| 1375.1185 0.0015 | 4.7 1.7 | 22.1 1.5 | ||||
| Fe II | 1376.672 | 1376.5645 0.0022 | 0.0 0.5 | 4.4 0.8 | 9.9 0.9 | |
| Fe II | 1379.615 | 1379.5089 0.0020 | 0.4 0.4 | 9.6 0.9 | 11.9 0.9 | |
| Ni II | 1381.295 | 1381.1951 0.0016 | 1.8 0.3 | 12.6 1.5 | 19.8 0.7 | |
| S I | 1381.552 | 1381.4512 0.0025 | 1.6 0.5 | 1.8 0.6 | 7.7 1.1 | |
| S I | 1385.510 | 1385.3998 0.0043 | -0.4 0.9 | 1.0 0.2 | UL | |
| Fe II | 1387.219 | 1387.1168 0.0019 | 1.4 0.4 | 7.0 1.0 | 13.5 0.8 | |
| 1388.0889 0.0027 | 1.3 0.5 | 6.8 1.1 | ||||
| S I | 1388.435 | 1388.3315 0.0020 | 1.1 0.4 | 5.4 0.9 | 11.6 0.9 | |
| S I | 1389.154 | 1389.0481 0.0026 | 0.6 0.6 | 1.4 0.5 | 7.1 1.1 | |
| Cl I | 1389.693 | 1389.5710 0.0021 | -2.9 0.4 | 1.5 0.9 | 11.1 0.9 | |
| Fe II | 1392.149 | 1392.0436 0.0019 | 0.7 0.4 | 4.4 1.0 | 12.8 0.8 | |
| S I | 1392.588 | 1392.4769 0.0036 | -0.5 0.8 | 1.5 0.3 | 3.7 1.5 | |
| Fe II | 1392.817 | 1392.7147 0.0018 | 1.4 0.4 | 9.9 1.2 | 15.0 0.8 | |
| Ni II | 1393.330 | 1393.2372 0.0013 | 3.5 0.3 | 20.4 2.1 | 27.3 0.6 | |
| Si IV | 1393.755 | 1393.6670 0.0011 | 4.5 0.2 | 880.0 3.3 | 43.4 0.4 | NC+BC, ISM |
| S I | 1396.112 | 1396.0070 0.0021 | 0.9 0.4 | 4.8 0.9 | 11.3 0.9 | |
| O IV] | 1397.200 | 1397.1166 0.0013 | 5.6 0.3 | 4.7 2.2 | 28.9 0.6 | () |
| 1398.6799 0.0023 | 3.9 0.7 | 9.5 1.0 | Sandlin-1 1398.76 | |||
| Ni II | 1399.026 | 1398.9144 0.0020 | -0.5 0.4 | 5.4 1.0 | 12.4 0.8 | |
| O IV] | 1399.780 | 1399.7104 0.0011 | 8.5 0.2 | 17.7 3.2 | 41.5 0.5 | () |
| O IV] | 1401.157 | 1401.0774 0.0010 | 6.4 0.2 | 93.6 3.6 | 46.2 0.4 | () |
| S I | 1401.514 | 1401.4010 0.0018 | -0.7 0.4 | 7.2 1.2 | 15.8 0.7 | |
| Si IV | 1402.770 | 1402.6821 0.0011 | 4.7 0.2 | 470.0 3.2 | 41.9 0.5 | NC+BC |
| O IV] + S IV] | 1404.806/.808 | 1404.7100 0.0010 | 46.2 3.7 | 47.5 0.4 | () | |
| Fe II | 1405.608 | 1405.5016 0.0018 | 0.7 0.4 | 7.9 1.2 | 15.9 0.7 | |
| S IV] | 1406.016 | 1405.9630 0.0011 | 12.2 0.2 | 17.1 3.3 | 43.2 0.5 | () NIST |
| O IV] | 1407.382 | 1407.3060 0.0011 | 7.3 0.2 | 17.7 3.3 | 43.5 0.4 | () |
| 1408.0629 0.0036 | 1.4 0.4 | 4.9 1.3 | Sandlin-1 1408.18 | |||
| Si II | 1409.073 | 1408.9474 0.0025 | -3.3 0.5 | 1.8 0.6 | 8.0 1.1 | |
| S I | 1409.337 | 1409.2207 0.0020 | -1.3 0.4 | 5.9 1.0 | 12.9 0.8 | |
| Fe II | 1410.621 | 1410.5239 0.0021 | 2.8 0.4 | 3.3 0.9 | 11.1 0.9 | |
| Ni II | 1411.071 | 1410.9615 0.0016 | 0.2 0.3 | 17.0 1.5 | 19.6 0.7 | |
| 1411.1924 0.0024 | 2.7 0.7 | 8.9 1.0 | Sandlin-1 1411.28 | |||
| 1411.2964 0.0029 | 1.3 0.5 | 6.1 1.2 | Sandlin-1 1411.354 | |||
| Fe II | 1411.470 | 1411.3773 0.0040 | 3.8 0.9 | 1.5 0.2 | 3.1 1.7 | |
| N I | 1411.949 | 1411.8347 0.0019 | -0.8 0.4 | 11.8 1.1 | 14.1 0.8 | |
| Fe II | 1412.834 | 1412.7360 0.0015 | 2.7 0.3 | 17.9 1.7 | 22.7 0.6 | |
| Ni II | 1414.299 | 1414.1871 0.0014 | -0.3 0.3 | 3.3 1.9 | 24.5 0.6 | |
| S I + Fe II | 1414.873/.882 | 1414.7700 0.0021 | 1.0 0.9 | 11.2 0.9 | ||
| 1414.9608 0.0025 | 1.6 0.6 | 7.9 1.1 | Sandlin-1 1415.06 | |||
| 1415.4392 0.0016 | 3.0 1.5 | 19.9 0.7 | Sandlin-1 1415.564 | |||
| Ni II | 1415.728 | 1415.6165 0.0019 | -0.2 0.4 | 5.8 1.1 | 13.7 0.8 | |
| Fe II | 1416.710 | 1416.6061 0.0027 | 1.5 0.6 | 3.7 1.4 | 17.6 2.6 | |
| S IV] | 1416.887 | 1416.8456 0.0028 | 14.7 0.6 | 7.4 2.9 | 37.6 5.7 | () emd |
| Fe II | 1417.733 | 1417.6129 0.0023 | -2.0 0.5 | 1.4 0.9 | 9.5 4.3 | |
| Fe II | 1418.853 | 1418.7500 0.0017 | 1.7 0.4 | 6.5 1.3 | 16.8 1.6 | |
| Ni II | 1423.212 | 1423.1111 0.0020 | 2.2 0.4 | 4.7 0.9 | 12.3 0.8 | |
| Fe II | 1424.047 | 1423.9326 0.0021 | -0.6 0.4 | 4.0 0.9 | 11.9 0.9 | |
| Fe II + Fe II | 1424.716/.786 | 1424.6141 0.0015 | 16.0 1.6 | 21.4 0.6 | ||
| S I | 1425.028 | 1424.9219 0.0018 | 1.1 0.4 | 39.6 1.2 | 16.1 0.7 | |
| S I + S I | 1425.188/.219 | 1425.0830 0.0017 | 21.6 1.3 | 16.8 0.7 | ||
| 1427.0327 0.0021 | 3.2 0.9 | 11.7 0.9 | Sandlin-1 1427.14 | |||
| H2 | 1430.161 | 1430.0469 0.0017 | -0.5 0.4 | 5.6 1.4 | 17.7 0.7 | |
| CO | 1431.200 | 1431.1058 0.0024 | 3.7 0.5 | 1.4 0.7 | 8.8 1.0 | |
| C I | 1431.597 | 1431.4908 0.0020 | 1.2 0.4 | 16.9 1.0 | 13.5 0.8 | |
| C I | 1432.105 | 1431.9980 0.0020 | 1.1 0.4 | 20.6 1.0 | 12.9 0.8 | |
| C I | 1432.530 | 1432.4227 0.0017 | 1.0 0.4 | 14.6 1.3 | 17.3 0.7 | |
| Fe II | 1432.875 | 1432.7649 0.0022 | 0.4 0.5 | 3.5 0.8 | 10.1 0.9 | |
| 1432.9351 0.0018 | 4.7 1.2 | 16.0 0.7 | Sandlin-1 1433.04 | |||
| S I | 1433.279 | 1433.1779 0.0016 | 2.3 0.3 | 31.6 1.5 | 19.4 0.7 | |
| H2 + H2 | 1434.079/.101 | 1434.0077 0.0014 | 2.6 2.0 | 26.5 0.6 | ||
| Fe II | 1434.994 | 1434.8807 0.0016 | -0.2 0.3 | 12.6 1.6 | 21.0 0.6 | |
| Cr II | 1435.369 | 1435.2521 0.0029 | -1.0 0.6 | 1.7 0.5 | 6.1 1.2 | |
| CO | 1436.560 | 1436.4437 0.0022 | -0.8 0.5 | 5.2 0.8 | 10.4 0.9 | |
| S I | 1436.967 | 1436.8527 0.0019 | -0.4 0.4 | 17.5 1.1 | 14.5 0.8 | |
| Fe II + Fe II | 1438.133/.135 | 1438.0145 0.0023 | 2.9 1.2 | 9.9 0.9 | ||
| Fe II | 1440.775 | 1440.6633 0.0098 | 0.2 2.0 | 4.3 1.3 | 13.3 15.6 | |
| Fe II | 1440.910 | 1440.8094 0.0018 | 2.5 0.4 | 4.9 1.3 | 16.3 4.6 | |
| Fe II | 1442.746 | 1442.6432 0.0018 | 2.1 0.4 | 8.5 1.2 | 15.5 0.8 | |
| S I | 1444.297 | 1444.1824 0.0021 | -0.3 0.4 | 8.1 0.9 | 11.8 0.9 | |
| Fe II | 1444.981 | 1444.8727 0.0018 | 1.0 0.4 | 3.9 1.3 | 17.0 0.7 | |
| Si VIII + CO | 1445.750/.78 | 1445.6747 0.0009 | 14.2 4.8 | 62.2 0.4 | ||
| Ni II | 1446.589 | 1446.4758 0.0019 | -0.0 0.4 | 5.0 1.1 | 14.0 0.8 | |
| Fe II | 1447.270 | 1447.1682 0.0020 | 2.4 0.4 | 4.6 1.0 | 12.6 0.8 | Sandlin-1 1447.29 |
| 1447.9115 0.0027 | 2.7 0.6 | 7.4 1.1 | Sandlin 1448.018 | |||
| S I | 1448.229 | 1448.1130 0.0018 | -0.6 0.4 | 3.7 1.3 | 16.7 0.7 | |
| 1449.8894 0.0021 | 4.1 0.9 | 12.1 0.9 | Sandlin-1 1449.996 | |||
| Ni II | 1454.852 | 1454.7437 0.0015 | 1.1 0.3 | 21.2 1.9 | 24.3 0.6 | |
| CO | 1455.290 | 1455.1621 0.0018 | -2.9 0.4 | 2.8 1.2 | 15.8 0.7 | |
| 1455.7979 0.0015 | 5.7 1.9 | 24.3 0.6 | Sandlin-1 1455.91 | |||
| C I | 1459.032 | 1458.9189 0.0016 | 0.2 0.3 | 15.0 1.6 | 20.3 0.7 | |
| Fe II + H2 | 1459.311/.340 | 1459.2554 0.0012 | 6.3 2.8 | 36.3 0.5 | ||
| C I | 1460.450 | 1460.3446 0.0018 | 1.8 0.4 | 3.8 1.2 | 16.1 0.7 | |
| C I | 1461.860 | 1461.7498 0.0020 | 0.8 0.4 | 2.8 1.0 | 13.1 0.8 | |
| C I | 1463.336 | 1463.2236 0.0014 | 0.4 0.3 | 33.9 2.2 | 28.9 0.6 | |
| C I | 1463.563 | 1463.4458 0.0019 | -0.6 0.4 | 7.3 1.2 | 15.5 0.8 | |
| 1464.4509 0.0022 | 3.2 0.9 | 11.3 0.9 | Sandlin-1 1464.571 | |||
| C I + H2 | 1464.9805.020 | 1464.8959 0.0015 | 4.8 1.7 | 22.7 0.6 | ||
| 1465.3080 0.0020 | 2.6 1.0 | 13.6 0.8 | Sandlin-1 1465.410 | |||
| 1466.0999 0.0021 | 9.3 0.9 | 11.6 0.9 | Sandlin-1 1466.17 | |||
| Ni II | 1467.265 | 1467.1506 0.0020 | 0.1 0.4 | 9.3 1.0 | 13.4 0.8 | |
| C I | 1467.402 | 1467.2775 0.0016 | -2.0 0.3 | 20.1 1.7 | 22.2 0.6 | |
| C I | 1467.670 | 1467.5430 0.0020 | -2.5 0.4 | 7.3 1.1 | 13.8 0.8 | |
| Ni II | 1467.762 | 1467.6487 0.0018 | 0.3 0.4 | 14.6 1.3 | 16.9 0.7 | |
| C I | 1467.877 | 1467.7626 0.0021 | 0.1 0.4 | 20.9 1.0 | 12.4 0.8 | |
| 1467.9211 0.0024 | 3.7 0.7 | 9.2 1.0 | Sandlin-1 1468.03 | |||
| C I | 1468.410 | 1468.2972 0.0020 | 0.4 0.4 | 25.6 1.0 | 13.2 0.8 | |
| C I | 1469.110 | 1469.0110 0.0029 | 3.2 0.6 | 2.7 0.5 | 6.4 1.2 | |
| C I | 1470.094 | 1469.9783 0.0020 | -0.1 0.4 | 28.0 1.0 | 13.6 0.8 | |
| C I | 1470.450 | 1470.3217 0.0103 | -2.7 2.1 | 4.4 1.0 | 12.9 1.0 | |
| S I | 1471.832 | 1471.7147 0.0024 | -0.4 0.5 | 5.9 0.7 | 9.1 1.0 | |
| C I | 1472.231 | 1472.1147 0.0021 | -0.2 0.4 | 22.1 1.0 | 12.5 0.8 | |
| S I | 1472.972 | 1472.8656 0.0017 | 1.8 0.4 | 156.0 1.4 | 18.3 0.7 | |
| C I | 1473.242 | 1473.1217 0.0021 | -1.0 0.4 | 6.3 0.9 | 12.3 0.8 | |
| C I | 1473.480 | 1473.3469 0.0027 | -3.6 0.6 | 1.8 0.6 | 7.2 1.1 | |
| Fe II + H2 | 1473.822/.834 | 1473.7126 0.0022 | 2.9 0.9 | 11.5 0.9 | ||
| S I | 1473.995 | 1473.8810 0.0018 | 0.3 0.4 | 86.3 1.2 | 16.2 0.7 | |
| S I | 1474.380 | 1474.2615 0.0019 | -0.7 0.4 | 38.0 1.2 | 15.0 0.8 | |
| S I | 1474.572 | 1474.4551 0.0023 | -0.3 0.5 | 12.5 0.8 | 10.7 0.9 | |
| C I | 1474.740 | 1474.6346 0.0027 | 2.0 0.6 | 4.7 0.6 | 7.4 1.1 | |
| Ni II | 1477.227 | 1477.1119 0.0023 | 0.1 0.5 | 7.4 0.8 | 10.0 0.9 | |
| C I | 1480.990 | 1480.8745 0.0016 | 0.1 0.3 | 7.5 1.6 | 20.2 0.7 | |
| C I | 1481.114 | 1481.0020 0.0022 | 0.8 0.5 | 11.2 0.8 | 11.0 0.9 | |
| S I | 1481.665 | 1481.5425 0.0022 | -1.3 0.4 | 63.3 0.9 | 11.4 0.9 | |
| S I | 1481.712 | 1481.5989 0.0022 | 0.6 0.4 | 15.7 0.9 | 11.8 0.9 | |
| C I | 1481.764 | 1481.6572 0.0017 | 1.8 0.4 | 27.3 1.4 | 18.0 0.7 | |
| Ni II | 1482.393 | 1482.2784 0.0019 | 0.3 0.4 | 5.2 1.2 | 15.3 0.9 | |
| 1482.3843 0.0044 | 1.6 0.2 | 2.9 1.7 | Sandlin-1 1482.45 | |||
| C I | 1482.730 | 1482.6036 0.0026 | -2.1 0.5 | 4.2 0.6 | 8.2 1.0 | |
| S I | 1483.038 | 1482.9237 0.0019 | 0.4 0.4 | 44.6 1.1 | 14.7 0.8 | |
| S I | 1483.233 | 1483.1191 0.0021 | 0.4 0.4 | 20.6 1.0 | 12.6 0.8 | |
| S I | 1485.622 | 1485.5024 0.0023 | -0.7 0.5 | 33.4 0.8 | 10.2 0.9 | |
| N IV | 1486.496 | 1486.4081 0.0049 | 5.7 1.0 | 65.2 4.0 | 45.2 4.2 | |
| 1486.6060 0.0016 | 7.6 1.8 | 22.9 0.6 | Sandlin-1 1486.68 | |||
| S I | 1487.150 | 1487.0336 0.0021 | -0.0 0.4 | 21.1 1.0 | 12.8 0.8 | |
| C I + Fe II | 1492.570/.577 | 1492.4517 0.0037 | 8.8 1.6 | 20.7 1.6 | ||
| C I | 1492.738 | 1492.6245 0.0019 | 0.7 0.4 | 18.9 1.2 | 15.3 0.8 | |
| C I | 1493.273 | 1493.1698 0.0068 | 2.7 1.4 | 5.2 1.0 | 12.9 1.5 | |
| C I | 1494.530 | 1494.4069 0.0021 | -1.3 0.4 | 7.1 1.0 | 12.8 2.2 | |
| 1499.7015 0.0152 | 2.7 1.5 | 15.8 11.7 | Sandlin-1 1499.809 | |||
| Ni II | 1500.437 | 1500.3325 0.0017 | 2.6 0.3 | 23.9 1.6 | 20.2 0.7 | |
| 1501.4036 0.0022 | 2.1 0.9 | 11.7 0.9 | ||||
| Ni II | 1501.962 | 1501.8534 0.0021 | 1.8 0.4 | 6.1 1.0 | 13.3 0.8 | |
| Ni II | 1502.150 | 1502.0273 0.0015 | -1.0 0.3 | 16.1 1.9 | 24.1 0.6 | |
| 1502.7277 0.0230 | 4.1 2.9 | 23.7 25.8 | Sandlin-3 1502.82 | |||
| 1505.6046 0.0023 | 1.5 0.8 | 10.8 2.2 | Sandlin-1 1505.73 | |||
| Fe II | 1506.898 | 1506.7947 0.0025 | 2.9 0.5 | 1.1 0.7 | 8.9 2.1 | |
| 1507.0273 0.0058 | 5.9 3.8 | 48.9 28.5 | Sandlin-1 1507.13 | |||
| 1510.0664 0.0023 | 3.6 0.8 | 10.4 0.9 | Sandlin-3 1510.17 | |||
| C I + H2 | 1510.668/.693 | 1510.5520 0.0024 | 6.0 0.8 | 9.8 0.9 | ||
| Ni II | 1510.859 | 1510.7473 0.0018 | 1.3 0.4 | 32.3 1.3 | 16.8 0.7 | |
| C I | 1510.981 | 1510.8629 0.0021 | 0.0 0.4 | 29.4 1.0 | 13.0 0.8 | |
| C I | 1511.907 | 1511.7831 0.0023 | -1.1 0.5 | 6.4 0.8 | 11.0 0.9 | |
| C I | 1513.150 | 1513.0364 0.0022 | 0.9 0.4 | 7.7 0.9 | 12.2 0.8 | |
| Si I | 1521.415 | 1521.2809 0.0017 | -3.0 0.3 | 8.2 1.5 | 20.1 0.7 | |
| Si I | 1522.983 | 1522.8496 0.0026 | -2.8 0.5 | 2.6 0.7 | 8.5 1.0 | |
| Si I | 1523.109 | 1522.9854 0.0036 | -0.9 0.7 | 1.4 0.3 | 4.4 2.8 | |
| Si I + Si I | 1523.200/.259 | 1523.1406 0.0022 | 5.8 0.9 | 12.2 0.8 | ||
| Fe II | 1523.374 | 1523.2538 0.0023 | -0.2 0.5 | 12.2 0.8 | 10.9 0.9 | |
| Si I + Si I | 1523.543/.568 | 1523.4457 0.0018 | 9.2 1.4 | 17.6 0.7 | ||
| Si I | 1523.915 | 1523.7922 0.0014 | -0.7 0.3 | 19.5 2.3 | 30.2 0.5 | |
| Si I | 1524.316 | 1524.1754 0.0015 | -4.2 0.3 | 11.5 1.9 | 25.0 0.6 | |
| Si I | 1524.767 | 1524.6510 0.0013 | 0.6 0.3 | 20.7 2.6 | 33.6 0.5 | |
| H2 + Ca II | 1525.230/.232 | 1525.1401 0.0015 | 14.0 1.9 | 25.2 0.6 | ||
| Si I + Si I | 1525.832/.886 | 1525.7616 0.0012 | 25.0 3.3 | 43.1 0.5 | ||
| Si I | 1526.549 | 1526.4170 0.0021 | -2.5 0.4 | 27.6 1.1 | 13.7 0.8 | |
| Si II | 1526.708 | 1526.5884 0.0013 | -0.0 0.3 | 273.9 2.5 | 32.8 0.5 | emd, ISM, CR |
| 1526.7761 0.0029 | 2.5 0.5 | 6.8 1.1 | Sandlin-1 1526.89 | |||
| Si I | 1527.223 | 1527.0840 0.0018 | -3.8 0.3 | 8.2 1.5 | 18.9 0.7 | Kelly (1982) |
| Si I + Si I | 1527.343/.367 | 1527.2533 0.0018 | 37.2 1.5 | 19.0 0.7 | ||
| Si I | 1527.588 | 1527.4590 0.0014 | -1.9 0.3 | 18.6 2.4 | 30.9 0.5 | Kelly (1982) |
| Si I + Si I | 1527.989/8.072 | 1527.9086 0.0014 | 10.6 2.4 | 30.8 0.5 | ||
| Si I | 1528.372 | 1528.2552 0.0028 | 0.6 0.5 | 4.9 0.6 | 7.6 1.1 | |
| 1528.4706 0.0026 | 4.3 0.7 | 8.6 1.0 | ||||
| CO + Si I | 1528.860/.871 | 1528.7402 0.0028 | 4.2 0.6 | 7.4 1.1 | ||
| Si I + Si I | 1529.022/.061 | 1528.9084 0.0020 | 9.7 1.1 | 14.8 0.8 | ||
| Si I | 1529.202 | 1529.0876 0.0028 | 1.0 0.5 | 11.1 1.4 | 13.1 1.4 | |
| Si I | 1529.396 | 1529.2640 0.0066 | -2.4 1.3 | 12.9 1.3 | 17.5 0.7 | |
| Si I | 1529.532 | 1529.4156 0.0023 | 0.6 0.4 | 9.0 3.0 | 11.4 1.9 | |
| Si I | 1529.778 | 1529.6570 0.0029 | -0.3 0.6 | 5.2 0.5 | 6.8 1.1 | |
| Si I | 1529.870 | 1529.7628 0.0018 | 2.4 0.4 | 5.8 1.4 | 17.6 0.7 | |
| Si I | 1530.690 | 1530.5575 0.0016 | -2.5 0.3 | 13.6 1.7 | 21.9 0.6 | Kelly (1982) |
| Si I + Si I +Si | 1530.867/.875/.929 | 1530.8220 0.0012 | 38.4 3.0 | 38.4 0.5 | ||
| Si I | 1531.070/.116 | 1530.9913 0.0018 | 10.5 1.4 | 17.6 0.7 | ||
| Si I | 1531.602 | 1531.4823 0.0024 | 0.0 0.5 | 12.5 0.8 | 9.9 0.9 | |
| Si I | 1532.295 | 1532.1808 0.0024 | 1.1 0.5 | 7.5 0.8 | 10.5 0.9 | |
| Si I + Si I | 1532.446/.490 | 1532.3580 0.0019 | 21.7 1.3 | 16.8 0.7 | ||
| Si I + Si I | 1532.624/.646 | 1532.5237 0.0020 | 24.5 1.1 | 14.2 0.8 | ||
| Si I | 1532.815 | 1532.6725 0.0024 | -4.4 0.5 | 8.7 0.8 | 10.1 0.9 | |
| Si I | 1532.929 | 1532.7997 0.0018 | -1.8 0.3 | 14.1 1.5 | 19.1 0.7 | |
| Si I | 1533.036 | 1532.9202 0.0022 | 0.8 0.4 | 6.7 0.9 | 11.7 0.9 | |
| Si II | 1533.432 | 1533.3102 0.0013 | -0.4 0.2 | 301.3 2.9 | 37.1 0.5 | emd, CR |
| Si I + Si I | 1533.672/.717 | 1533.5780 0.0021 | 13.1 1.0 | 13.6 0.8 | ||
| Si I | 1534.112 | 1533.9861 0.0026 | -1.2 0.5 | 10.2 0.7 | 8.9 1.0 | |
| Si I | 1534.184 | 1534.0667 0.0021 | 0.5 0.4 | 20.4 1.0 | 13.2 0.8 | |
| Si I | 1534.431 | 1534.2938 0.0019 | -3.4 0.4 | 8.5 1.3 | 16.7 0.7 | |
| Si I | 1534.547 | 1534.4333 0.0023 | 1.2 0.4 | 5.1 0.9 | 11.6 0.9 | |
| Si I | 1534.707 | 1534.5811 0.0024 | -1.2 0.5 | 11.3 0.8 | 10.1 0.9 | |
| H2 + Si I | 1534.772/.778 | 1534.6583 0.0018 | 26.4 1.4 | 18.2 0.7 | ||
| Si I | 1534.996 | 1534.8721 0.0021 | -0.7 0.4 | 13.0 1.1 | 13.8 0.8 | |
| Si I | 1535.472 | 1535.3364 0.0044 | -3.0 0.9 | 2.4 0.2 | 3.0 1.7 | |
| Si I + P II | 1535.896/.90 | 1535.7749 0.0024 | 7.2 0.8 | 10.4 0.9 | ||
| Si I | 1536.085 | 1535.9624 0.0026 | -0.5 0.5 | 14.3 0.7 | 9.1 1.0 | |
| Si I + Si I | 1536.257/.285 | 1536.1758 0.0018 | 11.7 1.4 | 18.7 0.7 | ||
| Si I | 1536.473 | 1536.3719 0.0022 | 3.7 0.4 | 5.8 1.0 | 12.6 0.8 | |
| Ni II | 1536.746 | 1536.6345 0.0019 | 1.7 0.4 | 23.8 1.3 | 16.5 0.7 | |
| Si I + Ni II | 1537.016/.038 | 1536.9221 0.0010 | 41.7 4.2 | 54.0 0.4 | ||
| Si I | 1537.297 | 1537.1759 0.0025 | -0.2 0.5 | 21.9 0.7 | 9.4 1.0 | |
| Si I | 1537.474 | 1537.3624 0.0021 | 1.7 0.4 | 23.9 1.0 | 13.0 0.8 | |
| Si I | 1537.618 | 1537.4952 0.0023 | -0.5 0.5 | 17.7 0.8 | 11.0 0.9 | |
| Si I | 1537.935 | 1537.8163 0.0025 | 0.3 0.5 | 24.6 0.8 | 9.8 0.9 | |
| Si I | 1538.876 | 1538.7573 0.0023 | 0.3 0.4 | 10.2 0.9 | 11.4 0.9 | |
| Si I | 1539.236 | 1539.1089 0.0025 | -1.3 0.5 | 3.5 0.7 | 9.4 1.0 | |
| Si I | 1539.705 | 1539.5776 0.0025 | -1.3 0.5 | 6.1 0.8 | 9.8 0.9 | |
| Si I | 1540.286 | 1540.1740 0.0023 | 1.6 0.4 | 8.4 0.9 | 11.7 0.9 | |
| Si I | 1540.544 | 1540.4131 0.0022 | -2.0 0.4 | 9.9 0.9 | 12.0 0.9 | |
| Si I | 1540.707 | 1540.5852 0.0025 | -0.3 0.5 | 18.0 0.7 | 9.2 1.0 | |
| Si I | 1540.783 | 1540.6580 0.0023 | -0.9 0.4 | 29.7 0.9 | 11.6 0.9 | |
| Si I | 1540.963 | 1540.8365 0.0023 | -1.2 0.5 | 27.2 0.8 | 10.8 0.9 | |
| Si I | 1541.322 | 1541.2021 0.0022 | 0.1 0.4 | 22.4 1.0 | 12.6 0.8 | |
| Si I | 1541.397 | 1541.2899 0.0025 | 2.6 0.5 | 10.4 0.8 | 9.8 0.9 | |
| Si I | 1541.569 | 1541.4443 0.0017 | -0.8 0.3 | 22.0 1.6 | 20.6 0.7 | |
| C I | 1542.177 | 1542.0541 0.0021 | -0.4 0.4 | 47.1 1.1 | 13.7 0.8 | |
| Si I | 1542.432 | 1542.3113 0.0027 | -0.0 0.5 | 11.7 0.6 | 8.0 1.0 | |
| Si I | 1543.158 | 1543.0129 0.0023 | -4.7 0.4 | 3.1 0.9 | 11.4 0.9 | |
| Si I | 1543.724 | 1543.6051 0.0024 | 0.4 0.5 | 27.2 0.8 | 10.4 0.9 | |
| C I | 1543.960 | 1543.8351 0.0022 | -0.8 0.4 | 15.6 0.9 | 12.3 0.8 | |
| Si I | 1544.184 | 1544.0663 0.0024 | 0.6 0.5 | 13.6 0.8 | 10.1 0.9 | |
| Si I | 1544.591 | 1544.4712 0.0022 | 0.2 0.4 | 16.5 0.9 | 11.9 0.9 | |
| Si I | 1545.099 | 1544.9655 0.0159 | -2.5 3.1 | 23.4 11.8 | 21.5 11.8 | |
| CO + C I | 1545.210/.249 | 1545.1069 0.0016 | 24.7 1.9 | 24.4 0.6 | ||
| Si I | 1545.575 | 1545.4552 0.0023 | 0.2 0.5 | 39.3 0.8 | 10.9 0.9 | |
| Si I | 1545.749 | 1545.6274 0.0023 | -0.1 0.5 | 15.9 0.8 | 11.0 0.9 | |
| Si I | 1546.590 | 1546.4673 0.0027 | -0.3 0.5 | 11.5 0.7 | 8.5 1.0 | |
| Si I | 1546.674 | 1546.5448 0.0023 | -1.6 0.4 | 18.4 0.9 | 11.1 0.9 | |
| Si I | 1547.129 | 1547.0166 0.0024 | 1.7 0.5 | 10.2 0.8 | 10.2 0.9 | |
| H2 + Si I | 1547.337/.362 | 1547.2428 0.0024 | 19.2 0.8 | 10.2 0.9 | ||
| Si I | 1547.452 | 1547.3308 0.0024 | -0.0 0.5 | 15.0 0.8 | 10.2 0.9 | |
| Si I | 1547.731 | 1547.6090 0.0037 | -0.2 0.7 | 2.7 0.3 | 4.4 1.4 | |
| Fe II | 1547.807 | 1547.6777 0.0026 | -1.6 0.5 | 6.2 0.7 | 9.1 1.0 | |
| C IV | 1548.187 | 1548.1071 0.0011 | 8.0 0.2 | 1800.0 3.7 | 48.6 0.4 | NC+BC,ISM,NIST |
| Si I | 1548.715 | 1548.5922 0.0018 | -0.3 0.4 | 48.8 1.4 | 17.6 0.7 | |
| 1548.9562 0.0022 | 10.3 1.0 | 12.4 0.8 | Sandlin-1 1549.05 | |||
| Si I | 1549.536 | 1549.4138 0.0048 | -0.2 0.9 | 2.3 0.2 | UL | |
| Fe II | 1550.260 | 1550.1577 0.0017 | 3.7 0.3 | 51.2 1.5 | 20.1 0.7 | |
| C IV | 1550.772 | 1550.6807 0.0011 | 5.8 0.2 | 998.0 4.0 | 52.0 0.4 | NC+BC,NIST |
| Si I | 1551.240 | 1551.1228 0.0023 | 0.8 0.4 | 41.8 0.9 | 11.5 0.9 | |
| Si I | 1551.860 | 1551.7306 0.0025 | -1.5 0.5 | 31.8 0.8 | 9.8 0.9 | |
| Si I | 1551.930 | 1551.8030 0.0018 | -1.1 0.3 | 28.1 1.4 | 18.6 0.7 | |
| Si I | 1552.209 | 1552.0868 0.0023 | -0.2 0.4 | 40.5 0.9 | 11.5 0.9 | |
| 1552.6396 0.0022 | 13.2 1.0 | 12.7 0.8 | Sandlin 1552.757 | |||
| Si I + H2 | 1552.950/.958 | 1552.8254 0.0025 | 12.0 0.7 | 9.4 1.0 | ||
| Si I | 1553.370 | 1553.2487 0.0024 | 0.0 0.5 | 15.7 0.8 | 10.3 0.9 | |
| Si I | 1554.702 | 1554.5873 0.0023 | 1.3 0.4 | 25.0 0.9 | 11.5 0.9 | |
| Si I | 1555.516 | 1555.3906 0.0020 | -0.7 0.4 | 15.0 1.2 | 15.2 0.8 | |
| Si I | 1555.660 | 1555.5422 0.0023 | 0.7 0.4 | 15.0 0.9 | 11.5 0.9 | |
| Si I+Fe IV+Ni II | 1555.946/.950/.957 | 1555.8601 0.0019 | 6.9 1.3 | 16.6 0.7 | ||
| Si I | 1556.160 | 1556.0364 0.0025 | -0.4 0.5 | 22.8 0.7 | 9.7 1.0 | |
| Si I + Si I | 1556.527/.547 | 1556.4149 0.0021 | 26.4 1.1 | 14.0 0.8 | ||
| 1556.9186 0.0034 | 7.7 0.4 | 5.2 1.3 | Sandlin-1 1557.044 | |||
| CO + Si I | 1557.380/.382 | 1557.2502 0.0019 | 13.1 1.2 | 16.1 0.7 | ||
| 1557.4197 0.0020 | 7.5 1.2 | 15.7 2.0 | Sandlin-1 1557.53 | |||
| 1557.7454 0.0018 | 6.7 1.4 | 18.2 0.7 | Sandlin-1 1557.86 | |||
| Si I | 1558.240 | 1558.1143 0.0023 | -0.7 0.4 | 24.6 0.9 | 11.3 0.9 | |
| Fe II | 1558.542 | 1558.4161 0.0017 | -0.8 0.3 | 56.7 1.6 | 20.6 0.7 | |
| Fe II | 1558.690 | 1558.5800 0.0015 | 2.3 0.3 | 81.5 2.1 | 27.6 0.6 | |
| Fe II | 1559.084 | 1558.9678 0.0014 | 1.1 0.3 | 193.7 2.4 | 30.9 0.5 | |
| 1559.1445 0.0028 | 5.4 0.6 | 7.9 1.1 | ||||
| Si I | 1559.364 | 1559.2352 0.0022 | -1.3 0.4 | 32.4 0.9 | 12.2 0.8 | |
| Si I | 1559.705 | 1559.5873 0.0025 | 0.8 0.5 | 11.5 0.8 | 9.9 0.9 | |
| Si I | 1560.072 | 1559.9551 0.0022 | 1.0 0.4 | 43.2 1.0 | 12.8 0.8 | |
| C I | 1560.310 | 1560.1909 0.0015 | 0.6 0.3 | 209.0 4.4 | 27.6 0.6 | CR |
| C I + C I | 1560.683/.708 | 1560.5730 0.0014 | 243.1 6.8 | 30.2 0.5 | CR | |
| Ni II | 1561.015 | 1560.8961 0.0024 | 0.6 0.5 | 4.8 0.8 | 10.7 0.9 | |
| Fe II | 1561.067 | 1560.9480 0.0033 | 0.6 0.6 | 10.1 0.4 | 5.6 1.2 | |
| C I + C I + C I | 1561.341/.367/.438 | 1561.2780 0.0010 | 340.3 4.3 | 56.0 0.4 | CR | |
| Si I | 1561.822 | 1561.6981 0.0026 | -0.3 0.5 | 20.1 0.7 | 8.7 1.0 | |
| Si I + Si I | 1562.002/.006 | 1561.8812 0.0024 | 28.9 0.8 | 11.0 0.9 | ||
| Si I | 1562.286 | 1562.1493 0.0019 | -2.8 0.4 | 18.9 1.3 | 16.6 0.7 | |
| Si I | 1563.364 | 1563.2338 0.0024 | -1.5 0.5 | 14.9 0.8 | 10.8 0.9 | |
| Fe II | 1563.788 | 1563.6748 0.0015 | 1.8 0.3 | 171.2 2.2 | 28.9 0.6 | |
| Al IV | 1564.164 | 1564.0623 0.0035 | 4.0 0.7 | 3.4 0.4 | 5.1 1.3 | NIST |
| Si I | 1564.614 | 1564.4858 0.0022 | -1.1 0.4 | 39.3 1.0 | 13.1 0.8 | |
| H2 | 1565.232 | 1565.1031 0.0026 | -1.2 0.5 | 3.2 0.7 | 9.2 1.0 | |
| Si I + Si I | 1565.322/.395 | 1565.2421 0.0019 | 28.7 1.3 | 16.6 0.7 | ||
| 1565.3983 0.0028 | 4.6 0.6 | 8.0 1.0 | Sandlin-1 1565.52 | |||
| Fe II | 1566.819 | 1566.7079 0.0016 | 2.2 0.3 | 123.2 1.9 | 25.1 0.6 | |
| Si I | 1567.465 | 1567.3174 0.0024 | -4.8 0.5 | 5.4 0.8 | 10.7 0.9 | |
| 1567.4459 0.0026 | 5.1 0.7 | 9.0 1.0 | Sandlin-1 1567.576 | |||
| Si I | 1567.726 | 1567.6029 0.0025 | -0.1 0.5 | 16.1 0.8 | 10.2 0.9 | |
| Fe II | 1568.016 | 1567.9043 0.0018 | 2.1 0.3 | 65.1 1.5 | 19.5 0.7 | |
| Si I | 1568.196 | 1568.0742 0.0023 | 0.2 0.4 | 29.3 0.9 | 11.4 0.9 | |
| Si I | 1568.618 | 1568.5015 0.0023 | 1.2 0.4 | 13.1 0.9 | 11.9 0.9 | |
| Si I | 1569.319 | 1569.1970 0.0024 | 0.2 0.5 | 21.3 0.8 | 10.8 0.9 | |
| Fe II | 1569.674 | 1569.5615 0.0016 | 2.0 0.3 | 96.0 1.7 | 22.7 0.6 | |
| Si I | 1570.027 | 1569.8998 0.0025 | -0.8 0.5 | 11.4 0.8 | 10.2 0.9 | |
| Fe II | 1570.242 | 1570.1281 0.0016 | 1.7 0.3 | 141.1 1.8 | 23.8 0.6 | |
| Si I | 1570.517 | 1570.3961 0.0020 | 0.4 0.4 | 16.0 1.2 | 15.1 0.8 | |
| Si I + Ni II | 1570.810/.878 | 1570.7087 0.0017 | 8.0 1.6 | 20.4 0.7 | ||
| Fe II | 1571.137 | 1571.0139 0.0022 | -0.0 0.4 | 46.4 1.0 | 12.9 0.8 | |
| Si I | 1571.406 | 1571.2794 0.0019 | -0.7 0.4 | 38.9 1.3 | 16.5 0.7 | |
| 1571.4072 0.0024 | 5.7 0.8 | 10.8 0.9 | Sandlin-1 1571.55 | |||
| Si I | 1571.796 | 1571.6766 0.0020 | 0.7 0.4 | 19.9 1.2 | 15.6 0.7 | |
| 1572.0121 0.0019 | 7.2 1.3 | 17.0 0.7 | ||||
| 1572.3070 0.0017 | 8.9 1.6 | 21.0 0.6 | ||||
| Ni II | 1572.646 | 1572.5190 0.0030 | -0.8 0.6 | 7.8 0.5 | 7.0 1.1 | |
| Si I + Fe II | 1572.717/.750 | 1572.6188 0.0015 | 36.0 2.1 | 27.5 0.6 | ||
| Fe II | 1573.000 | 1572.8910 0.0017 | 2.7 0.3 | 16.3 1.7 | 22.6 0.6 | |
| 1573.3136 0.0021 | 6.5 1.1 | 14.2 0.8 | Sandlin-1 1573.44 | |||
| Si I | 1573.635 | 1573.5109 0.0022 | -0.2 0.4 | 45.8 1.0 | 12.9 0.8 | |
| Fe II | 1573.825 | 1573.6866 0.0021 | -2.9 0.4 | 39.8 1.0 | 13.4 0.8 | |
| Si I | 1573.884 | 1573.7612 0.0022 | 0.1 0.4 | 61.3 1.0 | 12.9 0.8 | |
| 1574.4445 0.0023 | 14.3 0.9 | 11.3 0.9 | Sandlin-1 1574.544 | |||
| Fe II | 1574.768 | 1574.6482 0.0018 | 0.7 0.3 | 35.6 1.5 | 20.0 0.7 | |
| Fe II+Ni II | 1574.923/.976/5.003 | 1574.7968 0.0048 | 199.5 11.6 | 37.7 1.4 | ||
| Si I | 1575.127 | 1575.0049 0.0025 | 0.2 0.5 | 23.0 1.3 | 10.2 0.9 | |
| Si I | 1576.825 | 1576.6951 0.0023 | -1.2 0.4 | 24.5 0.9 | 11.7 0.9 | |
| Si I | 1577.044 | 1576.9181 0.0028 | -0.5 0.5 | 6.2 0.6 | 7.7 1.1 | |
| Fe II | 1577.166 | 1577.0435 0.0018 | 0.2 0.3 | 62.5 1.5 | 19.0 0.7 | |
| Fe II | 1578.219 | 1578.1040 0.0026 | 1.6 0.5 | 8.0 0.7 | 9.0 1.0 | |
| Si I + Fe II | 1578.478/.495 | 1578.3770 0.0021 | 34.2 1.0 | 13.6 0.8 | ||
| Si I | 1580.300 | 1580.1733 0.0024 | -0.6 0.5 | 16.5 0.8 | 10.9 0.9 | |
| Fe II | 1580.625 | 1580.5162 0.0017 | 2.8 0.3 | 120.8 1.8 | 22.9 0.6 | |
| Fe II | 1581.274 | 1581.1536 0.0023 | 0.6 0.4 | 38.0 0.9 | 11.5 0.9 | |
| Fe I | 1583.600 | 1583.4723 0.0027 | -0.7 0.5 | 13.6 0.6 | 8.4 1.0 | Kelly (1982) |
| Fe IV | 1584.117 | 1584.0118 0.0024 | 3.6 0.4 | 8.9 0.9 | 11.2 0.9 | Kelly (1982) |
| 1584.1162 0.0024 | 10.8 0.8 | 10.9 0.9 | ||||
| Si I | 1584.346 | 1584.2223 0.0024 | 0.1 0.5 | 19.9 0.8 | 10.7 0.9 | |
| Fe II | 1584.949 | 1584.8344 0.0016 | 1.8 0.3 | 112.9 1.8 | 23.6 0.6 | |
| Fe II | 1585.999 | 1585.8878 0.0018 | 2.4 0.3 | 19.6 1.4 | 18.4 0.7 | |
| Si I | 1586.137 | 1586.0048 0.0025 | -1.5 0.5 | 9.1 0.7 | 9.7 1.0 | |
| Si I | 1586.791 | 1586.6700 0.0023 | 0.6 0.4 | 12.0 0.9 | 11.4 0.9 | |
| Si I | 1587.762 | 1587.6406 0.0024 | 0.5 0.5 | 13.0 0.8 | 10.9 0.9 | |
| Fe II | 1588.286 | 1588.1697 0.0017 | 1.5 0.3 | 147.8 1.7 | 21.9 0.6 | |
| Fe II | 1588.688 | 1588.5590 0.0024 | -0.9 0.4 | 20.5 0.9 | 11.2 0.9 | |
| H2 + Si I | 1589.153/.173 | 1589.0321 0.0027 | 6.8 0.7 | 8.9 1.0 | ||
| 1590.0020 0.0024 | 24.9 0.8 | 10.8 0.9 | Sandlin-1 1590.10 | |||
| Si I | 1590.477 | 1590.3448 0.0017 | -1.5 0.3 | 18.4 1.8 | 22.9 0.6 | |
| Si I | 1590.576 | 1590.4575 0.0033 | 1.1 0.6 | 6.5 0.5 | 5.9 1.2 | |
| Fe IV | 1590.863 | 1590.7412 0.0025 | 0.5 0.5 | 5.2 0.8 | 9.9 0.9 | Kelly (1982) |
| Si I | 1591.123 | 1590.9769 0.0029 | -4.1 0.5 | 9.6 0.6 | 7.6 1.1 | |
| Fe IV | 1591.509 | 1591.3608 0.0026 | -4.5 0.5 | 4.0 0.7 | 9.3 1.0 | Kelly (1982) |
| Si I | 1592.020 | 1591.8876 0.0027 | -1.5 0.5 | 5.7 0.7 | 8.7 1.0 | |
| Si I | 1592.423 | 1592.2952 0.0026 | -0.6 0.5 | 39.7 0.7 | 9.7 1.0 | |
| Si I | 1594.566 | 1594.4390 0.0024 | -0.4 0.5 | 49.3 0.8 | 11.0 0.9 | |
| Si I + Si I | 1594.949/.951 | 1594.8247 0.0022 | 48.2 1.0 | 13.1 0.8 | ||
| Si I | 1595.755 | 1595.6283 0.0022 | -0.4 0.4 | 26.5 1.0 | 12.7 0.8 | |
| Si I | 1597.720 | 1597.5842 0.0031 | -2.0 0.6 | 6.6 0.5 | 6.6 1.2 | |
| Si I | 1597.962 | 1597.8450 0.0018 | 1.5 0.3 | 37.7 1.5 | 19.5 0.7 | |
| 1598.0725 0.0036 | 4.7 0.4 | 5.1 1.3 | Sandlin-1 1598.19 | |||
| Fe II | 1598.455 | 1598.3361 0.0017 | 1.2 0.3 | 16.9 1.7 | 21.8 0.6 | |
| 1598.9319 0.0020 | 9.1 1.3 | 16.8 0.7 | Sandlin-1 1599.07 | |||
| Fe II | 1600.013 | 1599.8939 0.0027 | 1.1 0.5 | 25.5 0.7 | 8.7 1.0 | |
| Ni II | 1600.268 | 1600.1565 0.0026 | 2.6 0.5 | 14.1 0.7 | 9.4 1.0 | |
| C I | 1600.818 | 1600.6877 0.0026 | -0.9 0.5 | 7.7 0.8 | 9.8 0.9 | |
| CO | 1600.940 | 1600.8009 0.0026 | -2.6 0.5 | 25.5 0.7 | 9.6 1.0 | |
| CO | 1601.230 | 1601.1184 0.0022 | 2.6 0.4 | 15.2 1.1 | 13.8 0.8 | |
| Fe IV | 1601.826 | 1601.6906 0.0026 | -1.9 0.5 | 7.0 0.7 | 9.2 1.0 | Kelly (1982) |
| Cl II | 1602.010 | 1601.8856 0.0028 | 0.2 0.5 | 17.6 0.6 | 8.4 1.0 | Kelly (1982) |
| Fe II | 1602.210 | 1602.0900 0.0018 | 1.0 0.3 | 50.4 1.9 | 20.2 0.7 | |
| 1602.4025 0.0018 | 87.3 1.5 | 19.1 0.7 | ||||
| 1602.5874 0.0024 | 4.8 0.9 | 11.1 0.9 | ||||
| C I | 1602.972 | 1602.8510 0.0021 | 0.8 0.4 | 52.7 1.2 | 15.3 0.8 | |
| Fe II | 1604.583 | 1604.4462 0.0023 | -2.1 0.4 | 9.6 0.9 | 11.7 0.9 | |
| Fe II | 1605.318 | 1605.2067 0.0025 | 2.7 0.5 | 21.0 0.8 | 10.4 0.9 | |
| Ni II + C I | 1606.917/.960 | 1606.8337 0.0025 | 18.1 0.8 | 10.2 0.9 | ||
| C I + Fe II | 1608.438/.456 | 1608.3516 0.0014 | 120.5 2.4 | 31.3 0.5 | ||
| Fe II | 1610.921 | 1610.8033 0.0017 | 1.6 0.3 | 128.3 1.8 | 23.4 0.6 | |
| Fe II | 1611.201 | 1611.0746 0.0019 | -0.1 0.4 | 83.9 1.4 | 17.8 0.7 | |
| Fe II | 1612.802 | 1612.6881 0.0016 | 2.3 0.3 | 160.5 2.1 | 26.7 0.6 | |
| 1612.9030 0.0022 | 13.1 1.0 | 13.5 0.8 | Sandlin-1 1613.02 | |||
| C I | 1613.376 | 1613.2455 0.0023 | -0.8 0.4 | 71.5 0.9 | 12.2 0.8 | |
| C I | 1613.803 | 1613.6770 0.0023 | 0.0 0.4 | 69.5 1.0 | 12.4 0.8 | |
| C I | 1614.507 | 1614.3784 0.0022 | -0.4 0.4 | 79.0 1.0 | 13.1 0.8 | |
| Fe II | 1616.652 | 1616.5317 0.0021 | 1.2 0.4 | 44.7 1.1 | 14.4 0.8 | |
| Fe II | 1618.470 | 1618.3435 0.0016 | 0.0 0.3 | 100.8 1.9 | 24.8 0.6 | |
| Fe II + Fe II | 1618.955/.961 | 1618.8680 0.0028 | 11.2 0.7 | 8.6 1.0 | ||
| Fe II | 1620.061 | 1619.9468 0.0022 | 2.3 0.4 | 28.6 1.1 | 13.8 0.8 | |
| Ni II | 1620.331 | 1620.2047 0.0013 | 0.1 0.2 | 27.3 3.1 | 39.9 0.5 | |
| Fe II | 1621.252 | 1621.1321 0.0020 | 1.3 0.4 | 51.0 1.3 | 16.4 0.7 | |
| Fe II | 1621.685 | 1621.5604 0.0016 | 0.4 0.3 | 40.6 2.0 | 25.5 0.6 | |
| Fe II | 1621.867 | 1621.7515 0.0022 | 2.1 0.4 | 67.8 1.0 | 13.6 0.8 | |
| Si I | 1622.881 | 1622.7548 0.0020 | 0.1 0.4 | 26.1 1.3 | 17.0 0.7 | |
| Fe II | 1623.091 | 1622.9700 0.0016 | 1.1 0.3 | 115.5 1.9 | 24.9 0.6 | |
| Fe II | 1623.705 | 1623.5789 0.0020 | 0.2 0.4 | 47.2 1.2 | 15.8 0.7 | |
| Fe II | 1625.520 | 1625.4011 0.0016 | 1.5 0.3 | 190.9 2.1 | 27.1 0.6 | |
| Fe II | 1625.909 | 1625.7876 0.0019 | 1.1 0.4 | 83.4 1.4 | 17.8 0.7 | |
| Fe II | 1627.130 | 1627.0128 0.0025 | 1.9 0.5 | 26.1 0.8 | 10.7 0.9 | |
| Fe II | 1627.382 | 1627.2643 0.0020 | 1.8 0.4 | 74.7 1.3 | 16.9 0.7 | |
| Fe II | 1628.722 | 1628.6051 0.0024 | 1.9 0.4 | 12.5 0.9 | 11.5 0.9 | |
| Fe II | 1629.154 | 1629.0222 0.0016 | -0.8 0.3 | 50.6 2.0 | 26.0 0.6 | |
| Fe II+Si I+Si I | 1629.376/.404/.438 | 1629.2841 0.0018 | 53.1 1.6 | 20.5 0.7 | ||
| Fe II | 1629.948 | 1629.8147 0.0023 | -1.1 0.4 | 37.4 1.5 | 12.2 0.9 | |
| Fe II | 1631.120 | 1630.9895 0.0016 | -0.5 0.3 | 36.0 2.0 | 26.6 0.6 | |
| Fe II | 1632.307 | 1632.1735 0.0021 | -1.1 0.4 | 43.8 1.1 | 14.8 0.8 | |
| Fe II | 1632.668 | 1632.5454 0.0018 | 0.9 0.3 | 152.3 1.6 | 20.7 0.7 | |
| Fe II | 1633.908 | 1633.7960 0.0016 | 2.9 0.3 | 150.2 2.0 | 26.4 0.6 | |
| Fe II | 1634.345 | 1634.2269 0.0018 | 1.8 0.3 | 50.5 1.5 | 19.6 0.7 | |
| Ni II | 1635.340 | 1635.2153 0.0026 | 0.6 0.5 | 11.6 0.7 | 9.6 1.0 | |
| Fe II | 1636.331 | 1636.2148 0.0016 | 2.2 0.3 | 27.4 2.0 | 25.8 0.6 | |
| Fe II | 1637.397 | 1637.2806 0.0016 | 2.2 0.3 | 199.3 2.0 | 25.8 0.6 | |
| Si I | 1638.282 | 1638.1654 0.0025 | 2.1 0.5 | 12.2 0.8 | 10.3 0.9 | |
| P I | 1638.657 | 1638.5206 0.0020 | -1.5 0.4 | 11.7 1.3 | 16.3 0.7 | Kelly (1982) |
| P I | 1639.075 | 1638.9143 0.0040 | -5.9 0.7 | 3.6 0.3 | 4.3 1.4 | Kelly (1982) |
| Fe II | 1640.152 | 1640.0334 0.0017 | 1.8 0.3 | 211.9 2.0 | 22.4 0.6 | |
| He II | 1640.400 | 1640.2777 0.0011 | 1.1 0.2 | 253.1 6.8 | 52.1 0.6 | () |
| P I | 1640.723 | 1640.5986 0.0028 | 0.7 0.5 | 14.7 2.4 | 17.8 1.9 | Kelly (1982) |
| S I + O I | 1641.292/.305 | 1641.1757 0.0024 | 27.8 0.9 | 11.2 0.9 | NIST | |
| Fe II | 1642.496 | 1642.3752 0.0021 | 1.4 0.4 | 36.6 1.2 | 15.3 0.8 | |
| Fe II | 1643.576 | 1643.4460 0.0018 | -0.3 0.3 | 183.6 1.7 | 22.0 0.6 | |
| Fe II | 1645.016 | 1644.8940 0.0022 | 1.2 0.4 | 56.4 1.1 | 14.0 0.8 | |
| Fe II | 1648.403 | 1648.2714 0.0026 | -0.5 0.5 | 14.9 0.8 | 10.0 0.9 | |
| Fe II | 1649.423 | 1649.2988 0.0017 | 0.9 0.3 | 123.0 1.7 | 22.5 0.6 | |
| Fe II | 1653.403 | 1653.2793 0.0026 | 1.0 0.5 | 9.4 1.8 | 10.1 0.9 | |
| Ni II + Ni II | 1653.687/.779 | 1653.5928 0.0018 | 38.0 4.2 | 21.5 1.5 | ||
| CO + CO | 1653.800/.85 | 1653.7313 0.0033 | 13.3 0.8 | 6.4 1.2 | ||
| Fe II | 1654.263 | 1654.1438 0.0019 | 1.9 0.3 | 90.1 3.3 | 18.5 0.7 | |
| Fe II | 1654.476 | 1654.3540 0.0018 | 1.4 0.3 | 94.2 3.2 | 20.0 0.7 | |
| Fe II | 1654.670 | 1654.5380 0.0027 | -0.5 0.5 | 49.8 0.7 | 9.3 1.0 | |
| C I | 1656.266 | 1656.1218 0.0014 | -2.6 0.2 | 686.5 2.9 | 37.1 0.5 | CR |
| Fe IV | 1656.649 | 1656.5199 0.0015 | 0.1 0.3 | 117.0 2.3 | 29.8 0.5 | Kelly (1982) |
| C I + C I | 1656.928/7.008 | 1656.8385 0.0011 | 545.1 4.5 | 58.4 0.4 | CR | |
| C I | 1657.380 | 1657.2523 0.0014 | 0.4 0.3 | 614.4 2.7 | 35.2 0.5 | CR |
| C I | 1657.907 | 1657.7655 0.0016 | -2.1 0.3 | 405.5 2.2 | 28.4 0.6 | CR |
| C I | 1658.122 | 1657.9967 0.0015 | 0.8 0.3 | 496.2 2.3 | 30.5 0.5 | CR |
| Fe II | 1658.401 | 1658.2783 0.0025 | 1.3 0.5 | 37.8 13.5 | 11.0 2.2 | |
| 1658.4500 0.0018 | 40.8 1.7 | 22.2 0.6 | ||||
| Fe II | 1658.771 | 1658.6545 0.0017 | 2.4 0.3 | 205.6 1.9 | 24.2 0.6 | |
| Fe II | 1659.483 | 1659.3677 0.0016 | 2.6 0.3 | 307.8 2.1 | 27.4 0.6 | |
| O III | 1660.803 | 1660.7052 0.0018 | 5.8 0.3 | 70.3 1.6 | 20.8 0.6 | |
| Fe II | 1661.324 | 1661.1921 0.0020 | -0.3 0.4 | 59.3 1.3 | 17.1 0.7 | |
| Fe II | 1662.369 | 1662.2347 0.0026 | -0.8 0.5 | 51.1 0.8 | 10.2 0.9 | |
| Fe II | 1663.221 | 1663.1025 0.0016 | 2.1 0.3 | 168.8 2.0 | 26.6 0.6 | |
| Fe II | 1663.697 | 1663.5721 0.0029 | 0.9 0.5 | 19.9 0.6 | 8.0 1.0 | |
| O III | 1666.153 | 1666.0386 0.0012 | 2.9 0.2 | 126.9 3.5 | 45.2 0.4 | |
| S I | 1666.688 | 1666.5465 0.0020 | -2.0 0.4 | 51.7 1.7 | 16.8 0.7 | |
| Fe II | 1667.913 | 1667.7634 0.0015 | -3.4 0.3 | 43.1 2.2 | 29.2 0.6 | |
| 1668.1093 0.0052 | 6.5 0.2 | UL | ||||
| Fe II | 1669.663 | 1669.5385 0.0021 | 1.1 0.4 | 91.5 1.3 | 16.5 0.7 | |
| Al II | 1670.787 | 1670.6689 0.0013 | 2.3 0.2 | 725.4 3.4 | 44.1 0.4 | ISM, CR |
| P I | 1671.070 | 1670.9059 0.0027 | -6.0 0.5 | 18.1 0.7 | 9.3 1.0 | |
| Fe II | 1673.462 | 1673.3394 0.0019 | 1.5 0.3 | 94.4 1.5 | 19.6 0.7 | |
| Fe II | 1674.254 | 1674.1332 0.0018 | 1.8 0.3 | 163.3 1.6 | 20.7 0.7 | |
| Fe II | 1674.440 | 1674.3193 0.0021 | 1.9 0.4 | 29.0 1.2 | 15.3 0.8 | |
| Fe II | 1674.716 | 1674.5833 0.0016 | -0.3 0.3 | 117.7 2.1 | 27.7 0.6 | |
| Fe II | 1676.361 | 1676.2305 0.0019 | 0.1 0.3 | 57.6 1.5 | 19.7 0.7 | |
| 1676.6241 0.0021 | 29.5 1.2 | 16.0 0.7 | ||||
| Fe II | 1676.856 | 1676.7385 0.0021 | 2.5 0.4 | 108.4 1.3 | 16.4 0.7 | |
| Fe IV | 1677.124 | 1676.9733 0.0031 | -3.5 0.5 | 10.0 0.6 | 7.4 1.1 | Kelly (1982) |
| 1677.2212 0.0023 | 23.4 1.0 | 12.8 0.8 | ||||
| Fe II | 1677.847 | 1677.7040 0.0024 | -2.1 0.4 | 33.9 1.0 | 12.6 0.8 | |
| Fe II | 1678.629 | 1678.5144 0.0017 | 3.0 0.3 | 36.0 2.0 | 25.5 0.6 | |
| Fe II | 1679.381 | 1679.2548 0.0021 | 0.9 0.4 | 82.1 1.2 | 15.5 0.8 | |
| Fe II | 1679.494 | 1679.3868 0.0200 | 4.3 3.6 | 33.7 1.2 | 16.0 0.7 | |
| Ni IV | 1680.678 | 1680.5477 0.0026 | 0.2 0.5 | 29.9 0.8 | 10.6 0.9 | |
| Fe II | 1681.111 | 1680.9872 0.0019 | 1.4 0.3 | 161.5 1.5 | 19.2 0.7 | |
| Fe IV | 1681.285 | 1681.1437 0.0016 | -1.8 0.3 | 58.5 2.1 | 26.8 0.6 | Kelly (1982) |
| Fe II | 1683.315 | 1683.1772 0.0020 | -1.1 0.4 | 44.0 1.3 | 17.4 0.7 | |
| Fe II | 1684.005 | 1683.8538 0.0017 | -3.5 0.3 | 66.1 1.9 | 24.7 0.6 | |
| Fe II + Ni II | 1685.954/.965 | 1685.8533 0.0017 | 119.9 1.8 | 23.8 0.6 | ||
| Fe II | 1686.455 | 1686.3281 0.0017 | 0.9 0.3 | 177.5 1.8 | 23.8 0.6 | |
| Fe II | 1686.692 | 1686.5676 0.0017 | 1.3 0.3 | 243.1 1.9 | 25.0 0.6 |
Note. —
Line identification is according to Sandlin et al. (1986) unless differently noted in the last column.
Radial velocity shifts corrected for the stellar radial velocity
of –23.45 km s-1, computed using the orbital parameters and ephemeris given by
Pourbaix et al. (2002);
UL means unresolved line;
CR means line with Central Reversal; ISM means presence
of an absorption component due to interstellar medium absorption;
emd means that the line was used to derive the differential emission
measure distribution; NC and BC means that the line profile can be fit by a
broad plus a narrow components.
Not identified lines present also in the solar spectrum, and
classified by Sandlin et al. (1986) in four classes, are listed with the
name Sandlin-class_number and the observed wavelentgh in the Solar
spectrum; NIST means that the line has been identified according to the NIST
Atomic Spectra Database, NIST Standard Reference Database #78
(http://physics.nist.gov/cgi-bin/AtData/main_asd)
For the laboratory wavelengths of O IV] and S IV] lines in the 1400 Å region see Harper et al. (1999).
He II multiplet: 1640.332/.345/ .375/.391/.474/.490/.533