The impact of cluster mergers on arc statistics
Abstract
We study the impact of merger events on the strong lensing properties of galaxy clusters. Previous lensing simulations were not able to resolve dynamical time scales of cluster lenses, which arise on time scales which are of order a Gyr. In this case study, we first describe qualitatively with an analytic model how some of the lensing properties of clusters are expected to change during merging events. We then analyse a numerically simulated lens model for the variation in its efficiency for producing both tangential and radial arcs while a massive substructure falls onto the main cluster body. We find that: (1) during the merger, the shape of the critical lines and caustics changes substantially; (2) the lensing cross sections for long and thin arcs can grow by one order of magnitude and reach their maxima when the extent of the critical curves is largest; (3) the cross section for radial arcs also grows, but the cluster can efficiently produce this kind of arcs only while the merging substructure crosses the main cluster centre; (4) while the arc cross sections pass through their maxima as the merger proceeds, the cluster’s X-ray emission increases by a factor of . Thus, we conclude that accounting for these dynamical processes is very important for arc statistics studies. In particular, they may provide a possible explanation for the arc statistics problem.
1 Introduction
The abundance of strong gravitational lensing events produced by galaxy clusters is determined by several factors. Since light deflection depends on the distances between observer, lens and source, gravitational lensing effects depend on the geometrical properties of the universe. On the other hand, gravitational arcs are rare events caused by a highly nonlinear effect in cluster cores. They are thus not only sensitive to the number density of galaxy clusters, but also to their individual internal structure. Since these factors depend on cosmology and in particular on the present value of the matter density parameter and the contribution from the cosmological constant , arc statistics establishes a highly sensitive link between cosmology and our understanding of cluster formation.
Using the ray-tracing technique for studying the lensing properties of galaxy clusters obtained from N-body simulations, Bartelmann et al. (1998) showed that the number of giant arcs, commonly defined as arcs with length-to-width ratio larger than and -magnitude smaller than (Wu, 1993), which is expected to be detectable on the whole sky, differs by orders-of-magnitudes between high- and low-density universes, strongly depending even on the cosmological constant. In particular, they estimated that the number of such arcs in a CDM cosmological model (, ) is of the order of some hundreds on the whole sky, while roughly ten times more arcs are expected in an OCDM cosmological model (, ).
Although still based on limited samples of galaxy clusters, observations indicate that the occurrence of strong lensing events on the sky is rather high (Luppino et al., 1999; Zaritsky & Gonzalez, 2003; Gladders et al., 2003). For example, searching for giant arcs in a sample of X-ray luminous clusters selected from the Einstein Observatory Extended Medium Survey, Luppino et al. (1999) found that their frequency is about arcs per massive cluster. Despite the obvious uncertainties in the observations, the only cosmological model for which the number of giant arcs expected from numerical simulations of gravitational lensing comes near the observed number is the OCDM model. In particular the observed incidence of strongly lensed galaxies exceeds the predictions of a CDM model by about a factor of ten. On the other hand, based on the observations of type Ia supernovae (Perlmutter et al., 1999; Tonry et al., 2003) and the recent accurate measurements of the temperature fluctuations of the Cosmic Microwave Background obtained with balloon experiments (e.g. Stompor et al. 2001; Jaffe et al. 2001; Abroe et al. 2002; Benoît et al. 2003) or by the mission (e.g. Bennett et al. 2003; Spergel et al. 2003), the CDM model has become the favourite cosmogony. This is known as the arc statistics problem: the mismatch between the observed number of arcs and the number expected in the CDM model preferred by virtually all other cosmological experiments hints at a lack of understanding of cluster formation.
Several extensions and improvements of the numerical simulations failed in finding a solution to this problem in the lensing simulations. Meneghetti et al. (2000) studied the influence of individual cluster galaxies on the ability of clusters to form large gravitational arcs, finding that their effect is statistically negligible. Cooray (1999) and Kaufmann & Straumann (2000), using spherical analytic models and the Press-Schechter formalism for modelling the lens cluster population, predicted a weaker dependence of arc statistics on , but Meneghetti et al. (2003b), comparing numerical models of galaxy clusters and their analytical fits, showed that analytic models are inadequate for quantitative studies of arc statistics. Finally, Meneghetti et al. (2003a) found that the presence of central cD galaxies can increase the cluster efficiency for producing giant arcs by not more than a factor of about two.
As alternative solution of the arc statistics problem, Bartelmann et al. (2003) recently investigated arc properties in cosmological models with more general forms of dark energy than a cosmological constant. Several studies showed that haloes should be more concentrated in these models than in cosmological-constant models with the same dark energy density today (Bartelmann et al. 2002; Mainini et al. 2003; Klypin et al. 2003; Dolag et al. 2003), allowing them to be more efficient for strong lensing. Using simple models with constant quintessence parameter, Bartelmann et al. (2003) found that the relative change of the halo concentration is not sufficient to produce an increment of one order of magnitude in the expected number of giant arcs. Nonetheless, other more elaborate dark-energy models need to be evaluated numerically and will be discussed in a future paper (Meneghetti et al. in preparation).
In this paper we investigate another possible effect which could not be properly considered in the previously mentioned numerical simulations of gravitational lensing by galaxy clusters. In those works, the lensing cross sections for giant arcs of each numerical model were evaluated at different redshifts, with a typical time separation between two consecutive simulation outputs of approximately Gyr. Therefore all the dynamical processes arising in the lenses on time scales smaller than were not resolved.
N-body simulations show that dark matter haloes of different masses continuously fall onto rich clusters of galaxies (Tormen, 1997). The typical time scale for such events is Gyr, which therefore might be too short for having been properly accounted for in the previous lensing simulations.
However, the effects of mergers on the lensing properties of galaxy clusters may potentially be very important. As discussed by Bartelmann et al. (1995) and Meneghetti et al. (2003b), substructures play a very important role for determining the cluster efficiency for lensing. Indeed, analytic models, where substructures and asymmetries in the lensing mass distributions are not properly taken into account, systematically underestimate the lensing cross sections of the numerical models. The main reason is that mass concentrations around and within clusters enhance the shear field, increasing the length of the critical curves, and consequently the probability of forming long arcs becomes higher.
Given the strong impact of substructures on the lensing properties of galaxy clusters, it is reasonable to expect that during the passage of a massive mass concentration through or near the cluster centre, the lensing efficiency might sensitively fluctuate. While the substructure is approaching the main cluster clump, the intensity of the shear field and, consequently, the shape of the critical curves may substantially change. Moreover, while the infalling dark matter halo gets closer to the cluster centre, the projected surface density increases, making the cluster much more efficient for strong lensing.
This paper describes a case study on how much the lensing cross sections change during the infall of a massive dark matter halo on the main cluster progenitor. For doing so, we investigate the lensing properties of a numerically simulated galaxy cluster during a redshift interval when a major merging event occurs. The general aim is to understand if mergers can enhance the cluster lensing efficiency sufficiently to provide a solution to the arc statistics problem.
The plan of the paper is as follows. In Section 2 we use a simple analytic model based on the NFW density profile for computing the strong lensing properties produced by cluster mergers. In Section 3 we describe our lensing simulations utilizing a numerical model obtained from a high-resolution N-body simulation; a method for evaluating the dynamical state of the cluster is also introduced. In Section 4 we present our results for critical lines and caustics, and we estimate the expected number of tangential and radial arcs. Section 5 is devoted to a discussion of the observational implications of our results, and we summarize the results and present our conclusions in Sect. 6.
2 Analytic models
We begin by investigating with the help of analytic models how the lensing properties of a cluster lens are expected to change while a massive substructure passes through its centre. We will model both the main cluster clump and the infalling substructure as spherical bodies with the density profile found in numerical simulations by Navarro et al. (1996, hereafter NFW).
2.1 NFW model
The NFW density profile is given by
| (1) |
where and are the characteristic density and the distance scale, respectively (see Navarro et al. 1997). The logarithmic slope of this density profile changes from at the centre to at large radii.
We briefly summarize here the main features of NFW haloes. First, and are not independent. Second, the ratio between the radius , within which the mean halo density is times the critical density, and defines the halo concentration, . Numerical simulations show that this parameter systematically changes with the halo virial mass, which is thus the only free parameter. Several algorithms exist for computing the concentration parameter from the halo virial mass (Navarro et al., 1997; Eke et al., 2001; Bullock et al., 2001). In the following analysis we adopt the method proposed by Navarro et al. (1997). Third, the concentration also depends on the cosmological model, implying that the lensing properties of haloes with identical mass are different in different cosmological models if they are modelled as NFW spheres. The lensing properties of haloes with NFW profiles have been discussed in several papers (Bartelmann, 1996; Wright & Brainerd, 2000; Wyithe et al., 2001; Li & Ostriker, 2002; Perrotta et al., 2002; Bartelmann et al., 2002; Meneghetti et al., 2003a, b).
Due to axial symmetry, lensing by an NFW sphere reduces to a one-dimensional problem. We define the optical axis as the straight line passing through the observer and the centre of the lens, and introduce the physical distances perpendicular to the optical axis on the lens and source planes, and , respectively. We introduce dimension-less coordinates and by means of the coordinate scales and , where and are the angular diameter distances to the source and lens planes, respectively.
Using this notation, the density profile (1) implies the surface mass density (Bartelmann, 1996)
| (2) |
with
| (3) |
The lensing potential is given by
| (4) |
where
| (5) |
and . here is the critical surface mass density for strong lensing and is the angular diameter distance between lens and source. This implies the deflection angle
| (6) |
with
| (7) |
2.2 Expectations


In this analytic computation, the main cluster body has a mass of . It merges with a massive substructure of mass , which is a fairly typical ratio for merging halo masses. In this simple test, we keep the lens plane at the fixed redshift , while the source plane is placed at redshift . We assume a background CDM cosmological model, with , , and Hubble constant (in units of 100 km/s/Mpc) .
We simulate the infall of the substructure onto the main clump, starting from the initial configuration when the smaller halo is placed at distance from the larger one, where is the scale radius of the most massive clump. For a halo of mass in a CDM model, corresponds to kpc. Then, we reduce the distance between the two haloes by moving the smaller towards the larger one by per time step, until the two haloes are exactly aligned.
For any new configuration, we trace a bundle of light rays through a regular grid on the lens plane which covers a region whose side length is . This is large enough to encompass the critical lines of both the clumps.
Using (6), we compute the contributions and of both the main clump and the substructure to the deflection angle of each ray. Being linear in mass, the total deflection angle of a ray passing through the mass distribution is the sum of the contributions from each mass element of the deflector. Thus, the deflection angle of each ray parametrized by its grid indices on the lens plane is given by
| (8) |
The convergence and the shear maps of the lens system are reconstructed from the deflection angles. The true position of the source on the source plane, , and its observed position on the lens plane, , are related by the lens equation
| (9) |
The local properties of the lens mapping are described by the Jacobian matrix of (9),
| (10) |
where is the Kronecker symbol. The convergence and the shear components and are found from through the standard relations
| (11) | |||||
| (12) | |||||
| (13) |
The Jacobian matrix is symmetric and can be diagonalised. Its two eigenvalues are
| and | (14) |
where . Radial and tangential critical lines are located where the conditions
| and | (15) |
are satisfied, respectively. The corresponding caustics in the source plane, close to which sources are imaged as large arcs, are obtained by applying the lens equation to the critical curves.
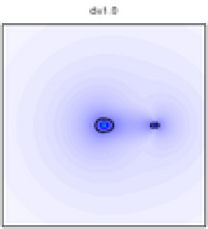
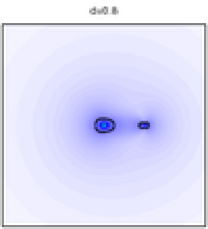
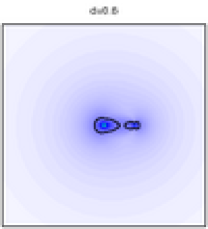
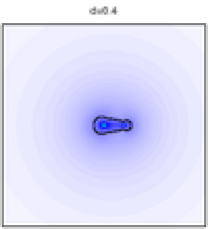
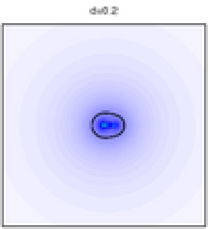
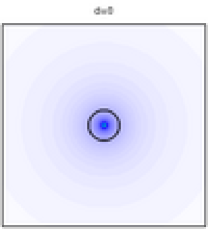
We are particularly interested in understanding by how much the cluster efficiency for producing tangential arcs changes during the merger phase. The size of the lensing cross sections for the formation of tangential arcs is strictly connected to the extent of the tangential critical curves and caustics: the longer the critical curves and the corresponding caustics are, the larger are the lensing cross sections. Therefore, we first investigate the shape of the tangential critical lines and caustics. In Fig. 1, we show the maps of the tangential eigenvalue for all configurations of the main clump relative to the infalling substructure. In each map, we over-plot the tangential critical lines. As the two haloes approach each other, their critical lines widen and stretch along the approaching direction. When the distance is , the critical lines touch and merge to form a single critical line. While the substructure overlaps with the main cluster body, it shrinks in the direction along which the merger proceeds, while it widens perpendicular to it.
We can explain the evolution of the critical lines as follows. As the two haloes approach each other, the shear in the region between them grows. This stretches the critical lines in the direction along which the two haloes are approaching. When the critical lines merge, the shear continues growing in the region inside the unique critical line. At this point the critical curve stops growing in a privileged direction. It shrinks only in the direction along which the haloes merge because of the decreasing distance between their centres. On the other hand, it expands almost isotropically by the effect of the increasing convergence. We show in Fig. 2 how the convergence and the shear evolve along the axis connecting the halo centres, where shrinking and stretching effects are most evident. The main clump is kept at . Different curves show the results for different distances between the two haloes, in units of the scale radius of the largest clump.
The caustics are shown in Fig. 3. Their evolution reflects that of the critical lines. As the shear grows between the two clumps, they are stretched and develop cusps. Then, after they merge, the single caustic shrinks and reduces to a point when the two haloes are exactly aligned.
In the case of merging haloes, where very complicated structures develop in the caustics, it is difficult to say whether the cross sections for long and thin arcs scale as the area enclosed by the caustics or as the caustic length. In Fig. 4 we show the evolution of both the area (solid lines) and the length (dashed lines) of the caustics while the merger proceeds. Thick lines in the left panel refer to the configuration of lenses and sources described earlier. For completeness, in the same panel we also show the corresponding curves for sources at redshift (thin lines). In the right panel, the corresponding curves for lenses at are shown. As expected, the size of the caustics is larger for sources more distant from the lens because of its increased convergence. All curves in each panel are normalized to the maximum value of length and enclosed area for sources at redshift . Of course the area enclosed by the caustics grows more steeply compared to the length of the caustics. It is interesting that caustics reach their maximum length before they reach their maximum area. This is due to the stretching of the caustics of the two individual merging haloes towards each other: the cusps become very peaked and pronounced until they touch, with large change of length. The maximum value of the area enclosed is reached only shortly thereafter, when the caustics have already started to enlarge isotropically.
3 Numerical methods
3.1 Numerical model
We now turn to a numerical cluster model in order to quantify how the strong lensing efficiency changes during a merger of a realistic cluster mass distributions embedded into the tidal field of the surrounding large-scale structure.
The numerical model we investigate here is part of a set of 17 objects obtained using the technique of re-simulating at higher resolution a patch of a pre-existing cosmological simulation. The re-simulation method is described in (Tormen, 1997). A detailed discussion of the dynamical properties of the whole sample of these simulated clusters is presented elsewhere (Tormen et al., 2003; Rasia et al., 2003).
The parent N-body simulation, with particles in a box of side Mpc, has been produced by N. Yoshida for the Virgo Consortium (see also Jenkins et al. 1998). It assumes a flat universe with , and . The initial conditions correspond to a cold dark matter power spectrum normalised to have today. The particle mass is , which allows to resolve a cluster-sized halo by several thousand particles; the gravitational softening is kpc. From the final output of this simulation we randomly extracted some spherical regions containing a cluster-sized dark matter halo. Each of these regions was re-sampled to build new initial conditions for a higher number of particles - on average dark matter particles and the same number of gas particles. The mass of the dark matter particles is , while the mass of the gas particles is times smaller. The softening length for dark matter and gas is kpc and kpc, respectively. These initial conditions were evolved using the publicly available code GADGET (Springel et al., 2001) from a starting redshift to redshift zero.
In our sample of 17 objects we selected a simulated cluster undergoing a major merger at . At redshift , when their viral regions merge, the main cluster clump and the infalling substructure have virial masses of and , respectively. In order to have a very good time resolution for resolving the complete merger in detail, we decided to re-simulate the cluster between and , obtaining 101 equidistant outputs which we use for our following lensing analysis.
3.2 Dynamical state of the cluster
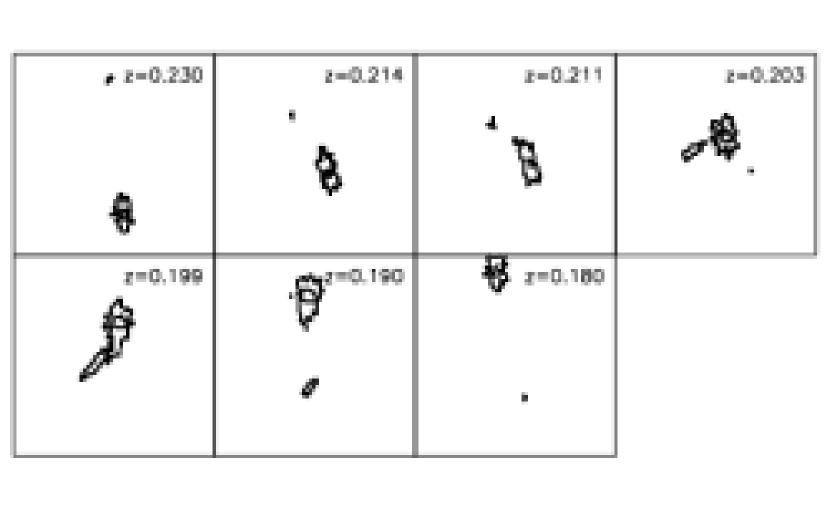
We show in Fig. LABEL:figure:mergsurfmaps some projected density maps of the simulated cluster at several redshifts during the merger. As is easily seen, a large substructure crosses the cluster centre at . The (comoving) side length of the displayed region is . We quantify the dynamical state of the cluster using the multipole expansion technique of the surface density field discussed by Meneghetti et al. (2003b). Briefly, we place the origin of our reference frame on the centre of the main cluster clump. Starting from the particle positions in the numerical simulations, we compute the surface density at discrete radii and position angles taken from and , respectively. For any , each discrete sample of data is expanded into a Fourier series in the position angle,
| (16) |
where the coefficients are given by
| (17) |
and can be computed using fast-Fourier techniques.
We define the power spectrum of the multipole expansion as . As discussed by Meneghetti et al. (2003b), the amount of substructure and the degree of asymmetry in the mass distributions of the numerically simulated cluster at any distance from the main clump can be quantified by defining an integrated power as the sum of the power spectral densities over all multipoles, from which we subtract the monopole and the quadrupole in order to remove the axially symmetric and elliptical contributions,
| (18) |
This quantity measures the deviation from an elliptical distribution of the surface mass density at a given distance from the cluster centre.
The results are shown in Fig. LABEL:figure:mergpspec: the total integrated power is shown as a function of redshift for five different distances from the centre of the main cluster body. The peaks in each plot arise when the infalling substructure enters or exits a circle of radius . Therefore, through the location of the peaks, we can determine with precision the distance between the two merging clumps at each redshift. The merger occurs between and . In order to follow in detail this event, we pick simulation snapshots equidistant in redshift between and . The redshift interval between two consecutive snapshots therefore is . In a CDM model, this corresponds to a time interval of approximately Myr.
At redshift , the virial mass of our numerical halo is . In order to increase the lensing efficiency and thus to reduce uncertainties in the numerically determined arc cross sections, we artificially rescale the cluster mass by multiplying the particle masses by a factor . Recalling that the virial radius of a halo scales as , where is the virial mass, to obtain a halo of mass which is dynamically stable, we also need to rescale the distances by a factor . This means that while the three-dimensional density remains fixed, the halo surface density is enhanced by a factor . For this reason we expect that, increasing its mass, the numerical cluster will become much more able to produce strong lensing effects.
3.3 Lensing simulations
Using each of the snapshots, we perform ray-tracing simulations. Our method is described in detail elsewhere (Meneghetti et al., 2000, 2001, 2003a, 2003b), but some parameters differ from the simulations described earlier.
For each snapshot, we select again from the simulation box a cube of Mpc side length, containing the high-density region of the cluster. The centre of the cube is defined such that the selected region contains both merging clumps. A third smaller substructure enters the field at . In the lensing simulations performed using the snapshots at higher redshift the effect of this small clump of matter is not taken into account, because it is out of the considered region. We checked its influence on the cluster strong lensing properties by selecting a larger region. We found that the effect of this substructure is negligible when its distance from the main clump is larger than Mpc.
We then determine the three-dimensional density field of the cluster from the particle positions, by interpolating the mass density within a regular grid of cells, using the Triangular Shaped Cloud method (Hockney & Eastwood, 1988). We then produce surface density fields by projecting along three coordinate axes. We chose our reference frame such that one axis is perpendicular to the direction of merging. By projecting along this coordinate axis, we minimize the impact parameter of the infalling substructure with respect to the main cluster clump. Hereafter this projection will be called “optimal”. For comparison, we also investigate the projection along a second axis, where the minimal distance between the merging clumps is never smaller than kpc. The third projection, which is not interesting for the purpose of this paper, since the substructure moves almost exactly along the line of sight, will be neglected in the following analysis.
The lensing simulations are performed by tracing a bundle of light rays through the central quarter of the lens plane and computing for each of them the deflection angle. Then, a large number of sources is distributed on the source plane. We place this plane at redshift . Keeping all sources at the same redshift is an approximation justified for the purposes of the present case study, but the recent detections of arcs in high-redshift clusters (Zaritsky & Gonzalez, 2003; Gladders et al., 2003) indicate that more detailed simulations will have to account for a wide source redshift distribution.
The sources are elliptical with axis ratios randomly drawn from . Their equivalent diameter (the diameter of the circle enclosing the same area of the source) is . Unlike previous studies, we do not distribute the elliptical sources on the central quarter of the source plane, since we need to investigate a region large enough to contain the caustics of both the merging clumps. Nevertheless, we keep the same spatial resolution of the source grids in the previous simulations, because sources are initially distributed on a regular grid of instead of cells. Then, we adaptively increase the source number density in the high magnification regions of the source plane by adding sources on sub-grids whose resolution is increased towards the lens caustics. This increases the probability of producing long arcs and thus the numerical efficiency of the method. In order to compensate for this artificial source-density increase, we assign for the following statistical analysis to each image a statistical weight proportional to the area of the grid cell on which the source was placed. We refine the source grid four times, and the total number of sources is typically .
Using the ray-tracing technique, we reconstruct the images of background galaxies and measure their length and width. Our technique for image detection and classification was described in detail by Bartelmann & Weiss (1994) and adopted by Bartelmann et al. (1998) and Meneghetti et al. (2000, 2001, 2003a, 2003b). It results in a catalogue of simulated images which is subsequently analysed statistically.
4 Results
In the following sections we show how the lensing properties of our numerical model change during the merger. We focus on the “optimal” projection of the numerical cluster, i.e. the projection along the axis perpendicular to the direction of the merger, where the effects of the merger are expected to be strongest. We refer to the second projection only in passing.
4.1 Critical lines and caustics
As expected, the critical lines and the caustics of the numerical lens evolve strongly during the merger.
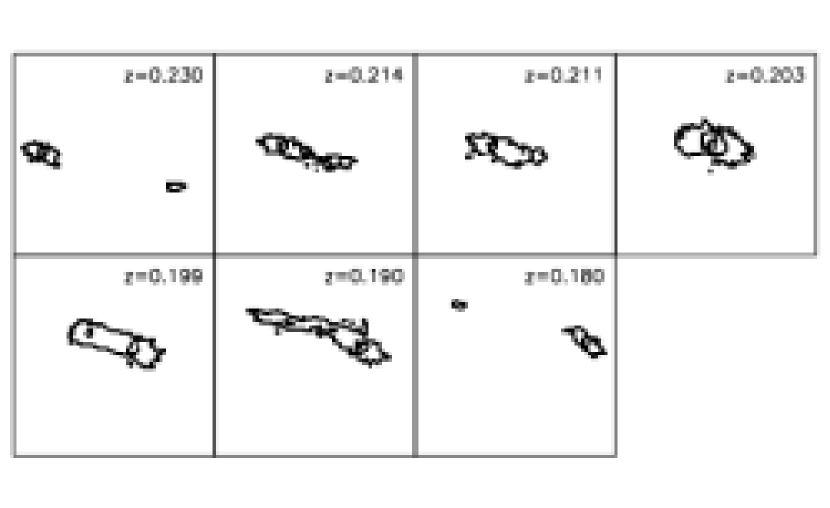
First, we discuss the results for the “optimal” projection. We show the critical lines at some relevant redshifts in Fig. 7. At redshift , the main cluster clump and the infalling substructure develop separate critical lines. The largest mass concentration also produces a small radial critical line (enclosed by the more extended tangential critical line). As the merger proceeds, the tangential critical lines are stretched towards each other. As discussed in Sect. 2.2, this is due to the increasing shear in the region between the mass concentrations. The critical lines merge approximately at redshift . After that, there exists a single critical line, which, after a short phase of shrinking, expands isotropically while the two clumps overlap. This happens at .
Note that the radial critical line grows during the merging event, reaching the maximum extension when the clumps are exactly aligned and the surface density is highest. Indeed, in order to develop a radial critical line, the lens must reach a sufficiently high central surface density.
When the substructure moves to the opposite side of the main cluster body, the tangential critical line stretches again and reaches its maximum elongation at . Then, separate critical lines appear around each clump. Their size decreases for decreasing because both the shear and the convergence between the two mass concentration decrease as their distance grows. Similarly, the radial critical lines shrink.
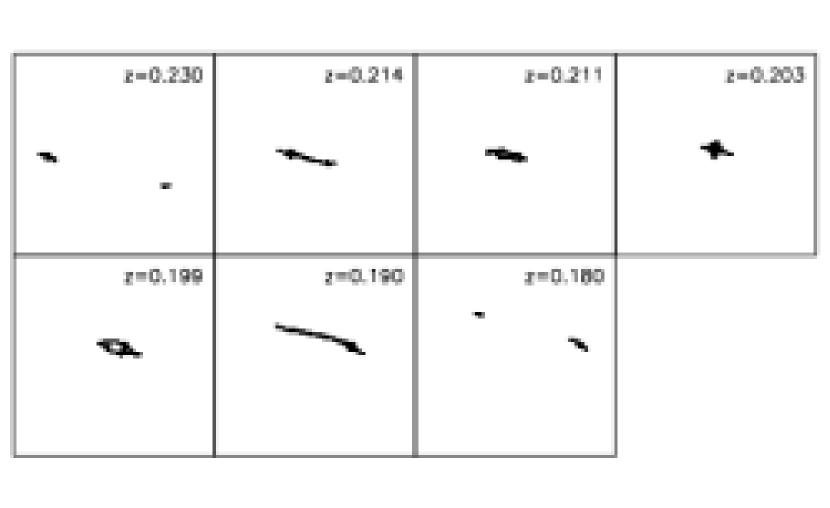
During the merger phase, the magnification pattern on the source plane changes as shown in Fig. LABEL:figure:mergmupdsmaps. The highest magnifications are reached during the phase of maximum overlap, but the extent of the highest magnification regions is largest at redshifts and . Therefore, at these redshifts even the caustics are most elongated. In Fig. 9 we show the caustics at the same redshifts as in Fig. LABEL:figure:mergmupdsmaps. Their evolution reflects that of the critical lines. Before redshift , two separated caustics exist; as the distance between the two clumps shrinks, their elongation in the direction of merging grows. Then the caustics merge into a single line, shrink along their long axis and widen perpendicular to it. When the two mass concentrations overlap, it has a diamond shape with four pronounced cusps. Finally, when the distance between the substructure and the main cluster clump grows again, the caustic shrinks, elongates in the direction of relative motion of the substructure, and finally splits into two small separate caustics.
In the second projection we have considered, the substructure does not pass through the cluster centre. In this case its distance from the main cluster clump is always kpc. We show in Fig. 10 the critical lines for this projection. As in the case of the “optimal” projection, while the merger proceeds, the critical lines of the two merging clumps are stretched towards each other by the effect of the increasing shear in the region between the two mass concentrations. The largest elongation is reached at redshift . However, the substructure does not cross the region enclosed by the critical lines of the main cluster clump and therefore the critical lines do not shrink in the direction of merging and never expand isotropically. After reaching the maximal elongation, it shrinks while the distance between the two clumps grows. The caustics (not shown) reflect the same evolution.
4.2 Tangential and radial arcs
Since the extent of the high-magnification regions and caustics changes during the infall of the substructure onto the main cluster clump as shown in the previous section, we expect that the lensing efficiency for producing both tangential and radial arcs changes accordingly. We quantify the influence of merging on the cluster’s strong lensing efficiency by measuring its cross sections for different arc properties.
First, we consider tangential arcs, which can be identified among the lensed images due to their large length-to-width ratio . By definition, the lensing cross section is the area on the source plane where a source must be located in order to be imaged as an arc with the specified property. As explained in Sect. 3.3, each source is taken to represent a fraction of the source plane. We assign a statistical weight of unity to the sources which are placed on the sub-grid with the highest resolution. These cells have area . The lensing cross section is then measured by counting the statistical weights of the sources whose images satisfy a specified property. If a source has multiple images with the required characteristics, its statistical weight is multiplied by the number of such images. Thus, the formula for computing cross sections for arcs with a property , , is
| (19) |
where is the number of images of the -th source satisfying the required conditions, and is the statistical weight of the source. Using this method, we compute the lensing cross sections for arcs with and , respectively.
The results are shown in the first three panels of Fig. LABEL:figure:mergcsec. The solid lines refer to the “optimal” projection. All curves exhibit the same redshift evolution. Their main properties can be summarized as follows:
-
•
The cross sections grow by a factor of two between and , as shown in Fig. LABEL:figure:mergpspec. Then, the cross section further increases by a factor of five between and , i.e. within Gyr.
-
•
The curves have three peaks, located at redshifts , and . The peaks at and correspond to the maximum extent of caustics and critical curves along the merging direction before and after the moment when the merging clumps overlap; the peak at occurs when the distance of the infalling substructure from the merging clump is minimal.
-
•
Two local minima arise between the three maxima at redshifts and , where the cross sections are a factor of two smaller than at the peaks. At these redshifts, the critical lines have shrunk along the merging direction and the caustics are less cuspy than at .
-
•
The cross sections reduce by more than one order of magnitude after . At redshift , when the distance between the merging clumps is Mpc, the cross section sizes are comparable to those before .
“Optimal” projection
Second projection
Therefore, during the merger, our simulated cluster becomes extremely more efficient in producing tangential arcs. The infalling substructure starts affecting the cross sections for long and thin arcs when its distance from the main cluster clump is approximately equivalent to the cluster virial radius (Mpc), and the largest effects are seen at three different times:
-
•
When the critical lines (and the corresponding caustics) merge, i.e. when the shear between the mass concentrations is sufficient to produce the largest elongation of the critical lines along the direction of merging. This happens Myr before and after the substructure crosses the cluster centre;
-
•
when the two clumps overlap, i.e. when the projected surface density or convergence is maximal, producing the largest isotropic expansion of the critical lines and of the caustics.
A different behaviour is found in the second projection. The results are shown again in the first three panels of Fig. LABEL:figure:mergcsec as dashed lines. In this case the critical lines and caustics reach a maximal elongation at and shrink at lower redshifts. Again the lensing cross sections reflect the evolution of the critical curves and caustics: they reach a maximum extent at and then their size decreases. A very important result is that, even if the merging clumps never get closer than kpc, the cross sections still grow by roughly a factor of five within approximately Myr.
We now consider the effects of merging on the cross section for radial arcs. These are identified from the complete sample of distorted images using the technique described in Meneghetti et al. (2001). It consists in selecting those arcs for which the measured radial magnification at their position exceeds a given threshold.
The cross section for this type of arcs as a function of redshift is shown in the fourth panel of Fig. LABEL:figure:mergcsec. In both projections, at redshifts , the cross section for radial arcs keeps constant and fluctuates around Mpc2. Then, in the “optimal” projection, it grows by a factor of five, reaching the highest value at . This is the same redshift where the cross sections for tangential arcs peak. The enhancement of the convergence due the overlapping of the merging clumps thus makes the cluster substantially more efficient for producing radial arcs.
Then, the cross section rapidly drops to zero for smaller redshifts. Note that the redshift interval where our cluster is very efficient for producing radial arcs is quite small (). Radial arcs have so far been reported in only five galaxy clusters (MS 2137, Fort et al. 1992; A 370, Smail et al. 1996; MS 0440, Gioia et al. 1998; AC 114, Natarajan et al. 1998; A 383, Smith et al. 2001). Our results contribute to explaining why radial arcs are so rare: if they form preferentially during the crossing of large substructures through the cluster centre, when the central lens surface density is higher, the visibility window of such events is very narrow ( Myr per merger).
Note that, in the second projection (dashed line), the cross section for radial arcs has some strong fluctuations during the merger but never reaches very high values. As for the “optimal” projection, it peaks at the same redshift where the cross section for tangential arcs is largest, but it changes by less than a factor of two with respect to redshifts . This confirms that only large enhancements of the central surface density produce a substantial increase of the cluster’s efficiency for forming radial arcs.
As mentioned before, assuming a single source redshift is justified for the purpose of this work. Indeed, the critical surface density changes by per cent when moving the sources from redshift one to redshift two, while keeping the lens redshift at . Thus the extent of the critical lines and caustics (and consequently of the lensing cross sections) is not expected to change very much for sources at redshifts above unity. Nevertheless, we show in Fig. LABEL:figure:mergcsec the cross sections obtained by placing the source plane at for some characteristic snapshots of our simulations. Filled and open circles refer to the “optimal” and the second projections, respectively. As expected the relative change in the amplitude of the cross sections is modest (less than a factor of ) for both tangential and radial arcs. Moreover, the amplitude of the fluctuations induced by the merger event on the lensing cross sections seems to depend very weakly on the source redshift.
5 Observational implications
Our results show that cluster mergers could play an important role for arc statistics. In particular, since the lensing efficiency grows by one order of magnitude during mergers, they may offer a solution for the arc statistics problem.
It is quite important to notice that mergers might have some other important observational implications to account for. In fact the largest sample of clusters used for arc statistics studies (Luppino et al., 1999) was selected in the X-ray band, where the luminosity is due to bremsstrahlung emission. This is very sensitive to the dynamical processes going on in the cluster, since it is proportional to the square gas density. Therefore, we expect that the cluster X-ray luminosity has large variations during a merging phase.
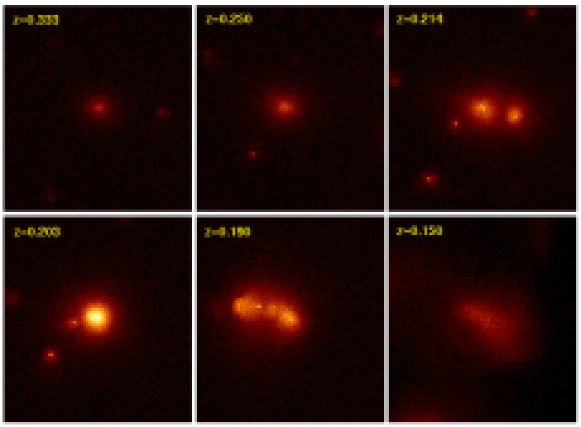
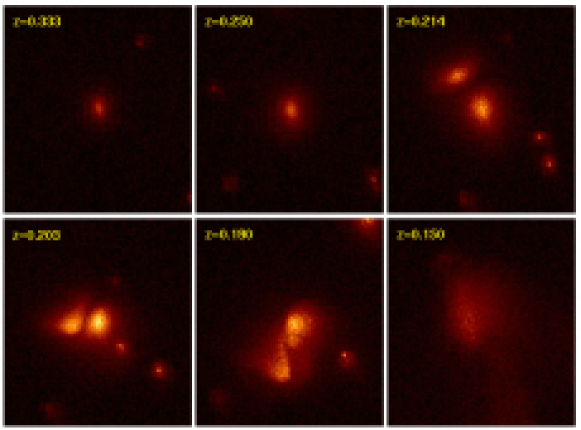
In Fig. 12 we show simulated X-ray observations of our cluster. These were obtained by using X-MAS, a code for simulating data taken with the Chandra satellite (Gardini et al., 2003). The cluster emissivity is calculated integrating over the gas density and temperature distribution within the cluster simulation, adopting the MEKAL plasma model (Kaastra & Mewe, 1993) with a metallicity of . The upper panels present the results in the “optimal” projection at six different redshifts. The upper left panel shows the cluster at , before the merger starts. The second panel shows the cluster at , when the virial regions merge. The third, fourth and fifth panels show the cluster just before, at and just after the maximum overlap of the merging clumps, respectively. Finally, in the sixth panel, the cluster is observed after the end of the merger. Since the colour scale is the same for all images, it can be easily seen that the X-ray luminosity is highest when the merging clumps are closest. Simular results for the second projection are shown in the bottom panels.
In Fig. 13 we show the observed X-ray luminosity of the numerical cluster as function of redshift. The curve has a narrow and almost symmetric peak located at . The X-ray luminosity grows by more than a factor of four between and , by roughly a factor of between and and by roughly a factor of between and . The width at half maximum of the peak is approximately . Note that the X-ray luminosity peak is wider than the maxima in the arc cross sections, thus the X-ray emission increases earlier and decreases later than the arc cross sections during the merger.

If a cluster sample is built by collecting all the objects with X-ray luminosity larger than a given threshold, we expect that many merging clusters are present among them, since they are stronger X-ray emitters. Since these are all very efficient clusters for producing gravitational arcs, this could introduce a bias in the observationally determined frequency of giant arcs, which could become larger than predicted by previous numerical lensing simulations in CDM model. However, it is quite difficult to make more robust conclusions here since only one cluster has been analysed. Further investigations are needed here. In any case, our results show that much caution must be applied when selecting clusters for arc statistics studies through their X-ray emission (cf. also Bartelmann & Steinmetz 1996).
6 Summary and conclusions
In this paper we have investigated how the lensing properties of a galaxy cluster change during merging events. Similar dynamical processes were not resolved in the previous lensing simulations but they might play a relevant role for determining the strong lensing efficiency of cluster lenses.
We address this problem first by using analytic models. When simulating a collision between spherical haloes with NFW density profiles, we find that both the critical lines and the caustics of the lens system strongly evolve during the merger. This behaviour is explained by the change of the shear and of the convergence induced by the infalling clump. Indeed, while the distance between the merging mass concentrations decreases, the shear intensity grows in the region between the halo centres. The individual critical lines and caustics of the main cluster clump and the infalling substructure are stretched towards each other until they merge.
To obtain a quantitative estimate of the impact of mergers on the lensing cross sections, we have studied the strong lensing properties of a numerically simulated galaxy cluster. Within this numerical model, a massive substructure falls onto the main cluster clump between and . We have studied the merger in detail, picking a large number of simulation snapshots within this redshift range. The time separation between consecutive snapshots is approximately Gyr. Two different projections of the cluster where analysed: in the “optimal” projection, the substructure passes through the centre of the main cluster clump, while in the second projection the distance between the two mass concentrations is always larger than kpc.
The main results of this study can be summarized as follows:
-
•
As expected from the results of the analytic tests, the shapes of critical lines and caustics substantially change during the merger. At the beginning, the two clumps develop individual critical lines and caustics. These are stretched towards each other while the distance between the mass concentrations decreases, because the intensity of the shear field grows in the region between the approaching clumps. In the “optimal” projection, when they merge, the resulting single critical line and caustic shrink along the merging direction and then expand isotropically, because of the increasing convergence. The same behaviour is observed when the substructure moves far away from the main cluster clump after crossing its centre. In the other projection the maximum extent of the critical lines is reached when the distance between the mass concentrations is such that the effect of the shear is largest. After that, the size of the critical lines drops.
-
•
In the “optimal” projection, the lensing cross sections for tangential arcs change by one order of magnitude during the merger. The effect of the infalling substructure starts to be relevant when its distance from the main cluster clump is Mpc. The cross sections have three peaks located at the redshifts where the critical lines have the largest extent along the merging direction, or when the shear effect induced by the infalling substructure is largest, and at the redshift where the two clumps overlap and consequently the maximum convergence is reached. Although the effects of the merger on the lensing cross sections are important within a time interval of Gyr, the strongest impact is thus observed during the central part of the merging phase, on a time scale of Myr. In the second projection, the lensing cross section for long and thin arcs change by a factor of five within a time interval of Myr.
-
•
The numerical cluster is highly efficient in producing radial arcs only during the merger. The cross section for this type of arcs has only one peak, located at the redshift were the infalling substructure crosses the centre of the main cluster clump.
Thus, our results show that mergers have a strong impact on the strong lensing efficiency of galaxy clusters. Since the lensing cross sections for long and thin arcs change by one order of magnitude during the mergers, these dynamical processes could be a possible solution to the arc statistics problem.
This picture is in principle supported by the fact that samples of clusters used in arc statistics studies are selected through their X-ray luminosity, which is very sensitive to the dynamical processes arising in the cluster. In particular, we expect that many merging clusters are present in these samples, since they are strong X-ray emitters. For example, Randall et al. (2002) estimate that the number of clusters with luminosities erg/sec can be increased by a factor of 8.9 due to merger boosts.
In addition, by surveying clusters in the LCDCS and in the RCS, Zaritsky & Gonzalez (2003) and Gladders et al. (2003) have recently found a high incidence of giant arcs in clusters at high redshift. Their results are particularly interesting since a large number of clusters merging at high redshift are predicted by the commonly accepted theory of structure formation. In particular, Gladders et al. (2003) speculate that a subset of clusters with low mass and large arc cross sections may be responsible for large numbers of arcs in distant clusters. One possibility is that such “super-lenses” are clusters in the process of merging.
Detailed conclusions are, however, pending on further studies quantifying the frequency of mergers and the dependence on arc cross sections on the detailed merger parameters, such as the impact parameter of the collision, the mass ratio of the merging haloes and so forth. Such studies are now under way.
In recent studies, Wambsganss et al. (2003) and Dalal et al. (2003) suggest that arc statistics in CDM models can be reconciled with the observed abundance of gravitational arcs by adopting a broader distribution of source redshifts. Certainly, cross sections can change substantially for a cluster of a given mass depending on its dynamical state, which makes earlier and current statements about the theoretical expectations highly insecure. Moreover, numerous observational effects need to be taken into account in addition for a reliable comparison between numerical simulations and observations.
Acknowledgements
This work has been partially supported by Italian MIUR (Grant 2001, prot. 2001028932, “Clusters and groups of galaxies: the interplay of dark and baryonic matter”), CNR and ASI. MM thanks EARA for financial support and the Max-Planck-Institut für Astrophysik for the hospitality during the visits when part of this work was done. We are grateful to A. Gardini for the possibility of using the code X-MAS simulating Chandra observations, and to S. Matarrese, N. Dalal and J. Kempner for useful discussions.
References
- Abroe et al. (2002) Abroe M., Balbi A., Borrill J., Bunn E., et al., 2002, MNRAS, 334, 11
- Bartelmann (1996) Bartelmann M., 1996, A&A, 313, 697
- Bartelmann et al. (1998) Bartelmann M., Huss A., Colberg J., Jenkins A., Pearce F., 1998, A&A, 330, 1
- Bartelmann et al. (2003) Bartelmann M., Meneghetti M., Perrotta F., Baccigalupi C., Moscardini L., 2003, A&A, 409, 449
- Bartelmann et al. (2002) Bartelmann M., Perrotta F., Baccigalupi C., 2002, A&A, 396, 21
- Bartelmann & Steinmetz (1996) Bartelmann M., Steinmetz M., 1996, MNRAS, 283, 431
- Bartelmann et al. (1995) Bartelmann M., Steinmetz M., Weiss A., 1995, A&A, 297, 1
- Bartelmann & Weiss (1994) Bartelmann M., Weiss A., 1994, A&A, 287, 1
- Bennett et al. (2003) Bennett C., Bay M., Halpern M., Hinshaw G., et al., 2003, ApJ, 583, 1
- Benoît et al. (2003) Benoît A., Ade P., Amblard A., Ansari R., et al., 2003, A&A, 399, L25
- Bullock et al. (2001) Bullock J., Kolatt T., Sigad Y., Somerville R., Kravtsov A., Klypin A., Primack J., Dekel A., 2001, MNRAS, 321, 559
- Cooray (1999) Cooray A., 1999, ApJ, 524, 504
- Dalal et al. (2003) Dalal N., Holder G., Hennawi J. F., 2003, ApJ, submitted; preprint astro-ph/0310306
- Dolag et al. (2003) Dolag K., Bartelmann M., Perrotta F., Baccigalupi C., Moscardini L., Meneghetti M., Tormen G., 2003, A&A, submitted; preprint astro-ph/0309771
- Eke et al. (2001) Eke V., Navarro J., Steinmetz M., 2001, ApJ, 554, 114
- Fort et al. (1992) Fort B., Le Fèvre O., Hammer F., Cailloux M., 1992, ApJ, 399, L125
- Gardini et al. (2003) Gardini A., Rasia E., Mazzotta P., Tormen G., De Grandi S., Moscardini L., 2003, MNRAS, submitted; preprint astro-ph/0310844
- Gioia et al. (1998) Gioia I. M., Shaya E. J., Le Fèvre O., Falco E. E., Luppino G. A., Hammer F., 1998, ApJ, 497, 573
- Gladders et al. (2003) Gladders M., Hoekstra H., Yee H., Hall P., Barrientos L., 2003, ApJ, 593, 48
- Hockney & Eastwood (1988) Hockney R., Eastwood J., 1988, Computer simulation using particles. Bristol: Hilger, 1988
- Jaffe et al. (2001) Jaffe A., Ade P., Balbi A., Bock J., et al., 2001, Phys. Rev. Lett., 86, 3475
- Jenkins et al. (1998) Jenkins A., Frenk C., Pearce F., Thomas P., et al., 1998, ApJ, 499, 20
- Kaastra & Mewe (1993) Kaastra J. S., Mewe R., 1993, A&AS, 97, 443
- Kaufmann & Straumann (2000) Kaufmann R., Straumann N., 2000, Annalen der Physik, 9, 384
- Klypin et al. (2003) Klypin A., Macciò A., Mainini R., Bonometto S., 2003, ApJ submitted; preprint astro-ph/0303304
- Li & Ostriker (2002) Li L., Ostriker J., 2002, ApJ, 566, 652
- Luppino et al. (1999) Luppino G., Gioia I., Hammer F., Le Fèvre O., Annis J., 1999, A&AS, 136, 117
- Mainini et al. (2003) Mainini R., Macciò A., Bonometto S., 2003, NewA, 8, 173
- Meneghetti et al. (2003a) Meneghetti M., Bartelmann M., Moscardini L., 2003a, MNRAS in press; preprint astro-ph/0302603
- Meneghetti et al. (2003b) Meneghetti M., Bartelmann M., Moscardini L., 2003b, MNRAS, 340, 105
- Meneghetti et al. (2000) Meneghetti M., Bolzonella M., Bartelmann M., Moscardini L., Tormen G., 2000, MNRAS, 314, 338
- Meneghetti et al. (2001) Meneghetti M., Yoshida N., Bartelmann M., Moscardini L., Springel V., Tormen G., White S., 2001, MNRAS,, 325, 435
- Natarajan et al. (1998) Natarajan P., Kneib J.-P., Smail I., Ellis R. S., 1998, ApJ, 499, 600
- Navarro et al. (1996) Navarro J., Frenk C., White S., 1996, ApJ, 462, 563
- Navarro et al. (1997) Navarro J., Frenk C., White S., 1997, ApJ, 490, 493
- Perlmutter et al. (1999) Perlmutter S., Aldering G., Goldhaber G., Knop R., et al., 1999, ApJ, 517, 565
- Perrotta et al. (2002) Perrotta F., Baccigalupi C., Bartelmann M., De Zotti G., Granato G., 2002, MNRAS, 329, 445
- Randall et al. (2002) Randall S. W., Sarazin C. L., Ricker P. M., 2002, ApJ, 577, 579
- Rasia et al. (2003) Rasia E., Tormen G., Moscardini L., 2003, MNRAS, submitted; preprint astro-ph/0309405
- Smail et al. (1996) Smail I., Dressler A., Kneib J.-P., Ellis R. S., Couch W. J., Sharples R. M., Oemler Jr. A., 1996, ApJ, 469, 508
- Smith et al. (2001) Smith G., Kneib J., Ebeling H., Czoske O., Smail I., 2001, ApJ, 552, 493
- Spergel et al. (2003) Spergel D., Verde L., Peiris H., Komatsu E., et al., 2003, ApJS, 148, 175
- Springel et al. (2001) Springel V., Yoshida N., White S., 2001, NewA, 6, 79
- Stompor et al. (2001) Stompor R., Abroe M., Ade P., Balbi A., et al., 2001, ApJL, 561, L7
- Tonry et al. (2003) Tonry J., Schmidt B., Barris B., Candia P., et al., 2003, ApJ, 594, 1
- Tormen (1997) Tormen G., 1997, MNRAS, 290, 411
- Tormen et al. (2003) Tormen G., Moscardini L., Yoshida N., 2003, MNRAS, submitted; preprint astro-ph/0304375
- Wambsganss et al. (2003) Wambsganss J., Bode P., Ostriker J. P., 2003, ApJ Letters, submitted; preprint astro-ph/0306088
- Wright & Brainerd (2000) Wright C., Brainerd T., 2000, ApJ, 534, 34
- Wu (1993) Wu X., 1993, A&A, 270, L1
- Wyithe et al. (2001) Wyithe J., Turner E., Spergel D., 2001, ApJ, 555, 504
- Zaritsky & Gonzalez (2003) Zaritsky D., Gonzalez A., 2003, ApJ, 584, 691