Transient Relativistically-Shifted Lines as a Probe of Black Hole Systems
Abstract
X-ray spectra of Seyfert galaxies have revealed a new type of X-ray spectral feature, one which appears to offer important new insight into the black hole system. XMM revealed several narrow emission lines redward of Fe K in NGC 3516. Since that discovery the phenomenon has been observed in other Seyfert galaxies, e.g. NGC 7314 and ESO 198-G24. We present new evidence for a redshifted Fe line in XMM spectra of Mrk 766. These data reveal the first evidence for a significant shift in the energy of such a line, occurring over a few tens of kiloseconds. This shift may be interpreted as deceleration of an ejected blob of gas traveling close to the escape velocity.
1 Introduction
Active Galactic Nuclei (AGN) are believed to be powered by accretion of material onto a black hole. UV photons from the disk are thought to be upscattered by relativistic electrons, providing the hard X-ray continuum. These hard X-rays illuminate the disk surface, undergoing photoelectric absorption or Compton scattering. High abundance and fluorescence yield make Fe K the strongest line in the X-ray band-pass, emitted via fluorescence or recombination processes between 6.4 – 7.0 keV, depending on the ionization-state of the gas. This line is commonly observed in AGN (Nandra et al., 1997) with both narrow and broad components. The former has long been thought to be dominated by contributions from cool material at or beyond the optical broad-line-region while the latter is thought to originate close to the black hole. Lines emitted very close to the black hole will show shifted, broadened and skewed profiles due to the combination of Doppler and relativistic effects (see Fabian et al. 2000 and references therein). Infalling material which is not part of the disk structure will also suffer the effects of strong gravity, and may achieve velocities which are a significant fraction of the speed of light, causing significant displacement of emission lines from their rest energy. Many astrophysical sources show evidence for emission (SS 433, e.g. Marshall, Canizares & Schulz 2002) and absorption from material traveling at relativistic velocities (e.g. Broad Absorption Line Quasars; Weyman 1997).
Overlapping Chandra and XMM-Newton observations from 2001 November revealed unexpected narrow emission lines at 5.6 and 6.2 keV in the Seyfert galaxy NGC 3516 (Turner et al., 2002). Narrow emission lines, redshifted relative to Fe K had never before been seen in the X-ray spectrum of an AGN. The high-throughput of XMM and the excellent energy-resolution afforded by the Chandra HETG made possible the first unambiguous detection of these weak lines. With hindsight ASCA data show the appearance of narrow iron lines to be a frequently recurring phenomenon in NGC 3516 (Nandra et al., 1999) over a wide range in source luminosity. Turner et al. (2002) found variability in the flux of the new lines on timescales of a few tens of ksec. The apparent variability of the 5.6 keV component was most interesting as it could be attributed either to the line flux varying or the line energy shifting from 5.4 to 5.6 keV. A similar line at 5.86 keV has now been detected in NGC 7314 (Yaqoob et al., 2003) and at 5.7 keV in ESO 198-G24 (Guainazzi, 2003) – the phenomenon may be a characteristic of AGN. Here we present data from an XMM observation of Mrk 766 which shows characteristically similar redshifted emission to that observed in NGC 3516, offering new insight into the origin of these lines.
2 The case of Mrk 766
XMM has three CCD detectors (EPIC) operating in the keV band. The collecting area of the EPIC detector and telescope combination is approximately an order of magnitude higher than the CCDs flown on ASCA. The energy resolution is eV (FWHM) at 6.4 keV. This combination of capabilities has opened up a new regime of Fe K profile studies. High S/N spectra can be accumulated in much shorter integration times than ever before, allowing significant progress in studying variable spectral features and in detection of detailed structure to Fe line profiles. We analyzed the archival XMM data for Mrk 766. Two XMM observations of Mrk 766 are available in the archives, from 2000 May 20 and 2001 May 20-21. EPIC pn data were screened using SAS v5.3 software to select only events with patterns in the range 0 - 4. We also applied energy cuts to discard data below 0.2 keV and above 15.0 keV. The pn data yielded a useful exposure of 130 ksec for the 2001 observation and 60 ksec for the 2000 data. The 2001 observation utilized the Small Window mode and there was no region for extraction of MOS2 background spectra, unfortunately this background level becomes significant at and above the Fe K emission line. The 2001 MOS1 data were taken in timing mode, with the central chip off. In timing mode, spectra must be extracted based upon the histogram of counts versus RAWX coordinate. This allows the user to extract a spectrum for a given range of RAWX. While the histogram allows selection of source and background spectra, the source spectrum has to include some background dominated channels in the compressed spatial dimension. For weak sources such as Mrk 766 the resulting background-subtracted spectrum is somewhat inaccurate, especially at high energies. We extracted the timing-mode spectra for MOS1 and confirmed that those data were consistent with our PN results, but we do not present those data here.
In the 2000 observation pileup hardened the MOS spectra but did not affect the pn data. Thus the MOS data were not used from either observation. Source spectra were extracted from both epochs using circular extraction cells of radii centered on Mrk 766. Background spectra were taken from an offset position close to the source. Source spectra were grouped to have at least 20 counts per spectral bin for fitting using the statistic. Response matrices were generated for the source spectra using SASv5.3.

Figure 1 shows the light curve from 2001 May, as first presented by Pounds et al. (2003). We confirm the general findings of Pounds et al. (2003) regarding the mean spectrum, i.e. that the spectrum is steep and shows a broad component of Fe K at rest-energy keV, with a narrower component at 6.4 keV. Our initial spectral fits parameterized the hard X-ray continuum in the 3-11.0 keV range using a powerlaw continuum form, but ignoring data in the 5-7 keV band where the Fe K line resides. We assumed a redshift z=0.012929 for Mrk 766 (McMahon et al., 2002).
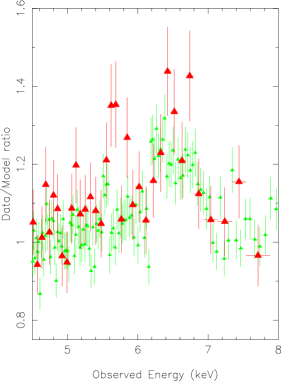
We also performed time-resolved spectroscopy, accumulating spectra before (high-state) and after (the dip) a drop in source flux (Fig. 1). We adopted the general model of a powerlaw with broad and narrow components to model the complex Fe K line which is evident in the 6.4 – 7.0 keV band. In addition, we find a significant feature at 5.60 keV, not discussed by Pounds et al. (2003).
Figure 2 shows the data/model line ratios for the two sections of data. An emission line is detected at 5.60 keV in the high-state spectrum and at 5.75 keV in the dip-state. Both lines are detected at confidence. The lines at 5.60 and 5.75 keV had photon fluxes photons cm-2 s-1 and photons cm-2 s-1, respectively (errors represent 90% confidence). Subdivision of the high-state data into six time-resolved spectra of equal duration and the low-state into two halves revealed no other significant changes in line energy within each flux-state.
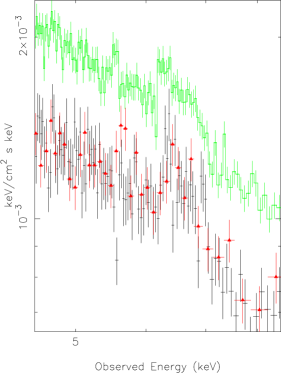
We also compared the spectra of these two ‘states’ with that from an XMM observation 1 year earlier. Figure 3 shows the unfolded spectra from these three data sections. The apparent energy shift of the 5.60 keV feature is again evident by comparison of the top (green) and center (red triangles) lines. For comparison we include the 2000 May data (bottom line, black crosses), catching the source at a flux state similar to that denoted the “dip” in 2001 May data. Those earlier data do not show a significant feature in the range 5.60 - 5.75 keV. The 2000 May spectrum yields an upper limit on the flux of a line at 5.75 keV photons cm-2 s-1. Thus the source is inconsistent with the presence of the same line in both 2000 May and 2001 May spectra accumulated during the low flux-state.
To further investigate the narrow redshifted lines we examined the significance of features in the Fe K regime. We slid a Gaussian model template across data between 3.0 - 11.0 keV, testing for an improvement to the fit at every resolution element, compared to a powerlaw model for the underlying continuum. The background spectrum was subtracted before the test, so features in Figure 4 are attributable to Mrk 766.
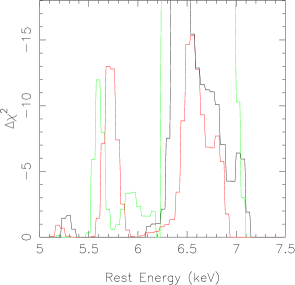
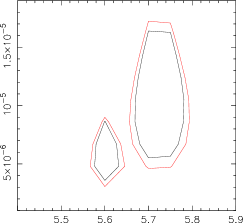
In the resulting fit-statistic, of 9.21 represents a feature which is significant at 99% confidence. Fig. 4 illustrates the newly discovered lines and also traces out the stronger Fe lines reported by Pounds et al. (2003). The green line represents the 2001 high-state, the red line 2001 dip data and the black line the 2000 May observation. Fig. 4 provides supporting evidence that the peak of the emission shifts from 5.60 to 5.75 keV in the rest-frame, and that there is no significant feature in the 2000 May spectrum. Figure 5 shows the contours for the energy and intensity of this line in the high and dip states. An apparent shift in line energy is significant at 95% confidence (while the apparent change in line intensity turns out to be insignificant). Our analysis of a 90 ks Chandra HEG observation of Mrk 766 from another epoch did not show significant redshifted, narrow Fe lines.
3 Discussion
Several cases of narrow and redshifted lines have now been found in Seyfert galaxies and these features may be a characteristic of black hole systems, currently detectable only in the relatively bright Seyfert type AGN.
Spectra of Mrk 766 show a narrow, redshifted Fe line which changes from 5.60 to 5.75 keV within a few tens of kiloseconds. These data provide the first ever observation of a significant shift in energy for a line of this type. We dismiss the possibility that the observed change in energy is due to an increase in ionization-state of the emitter. In that picture an increase in line energy should be correlated with an increase, rather than a decrease in central luminosity.
Spallation, which is the breakdown of Fe atoms into lower Z metals by energetic protons, has been disfavored as an explanation of the lines in NGC 3516 (Turner et al., 2002) on the basis of line ratios and rapid line variability. The energy shift detected in the line from Mrk 766 seems inconsistent with the spallation scenario, pushing it further from favor.
In the case of NGC 3516 Turner et al. (2002) discuss an origin from narrow radii which are sporadically illuminated on the surface of the accretion disk. The “Thundercloud” model may be applicable, where the accretion disk is illuminated in patches from magnetic reconnection events (Merloni & Fabian, 2001). If the redshifted lines observed in Mrk 766 are red horns of disklines then peak energies in the range 5.60-5.75 keV would occur from a radius gravitational radii. For a disk inclined at 30 degrees to our line-of-sight there should be an associated blue horn at keV, which would be stronger than the red horn due to relativistic effects (Fabian et al. 1989, Laor 1991). This is true for both the Schwarzschild and Kerr metrics, which produce similar lines at such radii. If the disk is inclined at 60 degrees then the blue horn would be expected at 7.25 keV with twice the strength of the red horn. The data are inconsistent with the latter line. Without an independent constraint on disk inclination it is difficult to make a conclusive comment on the consistency of the data with a blue horn and thus with the disk model. For the case of a disk inclined close to face-on the blue horn would be lost in the broad line component noted by Pounds et al. (2003), or in the wings of the strong Fe K component at 6.4 keV. A disk origin remains an interesting possibility. Shifts in line energy might be expected to be correlated with flux as new magnetic reconnections would likely light up different parts of the disk. Alternatively, the observation of a rapid energy shift for the emission line in Mrk 766 is suggestive of a decelerating blob of gas, and we now explore this possibility in detail.
3.1 Outflow?
That the line is redshifted could indicate either an origin in material expelled from the nucleus, in which case we are seeing material on the far side of the black hole, or material falling into the nucleus, where we are viewing gas on the near side of the black hole. The observation that the line is getting less redshifted with time is indicative of deceleration of the emitter. Deceleration might be expected as expelled material would be likely slowed by gravity. While there may exist deceleration mechanisms which can slow infalling material (e.g. magnetic field pressure or drag forces) the outflow scenario seems a likely model and so we restrict ourselves to a discussion of this possibility. NGC 3516 may show a similar deceleration, as there is some suggestion of a line which moves from 5.4 to 5.6 keV in a few tens of kiloseconds (Turner et al., 2002). Understanding gas inflow/outflow is to get insight into the accretion/expulsion processes, two of the most fundamental questions regarding black hole systems. Disk winds are a natural consequence of the accretion process, and so it is particularly compelling to look at these new observations in light of such models.
One can use the observed shift in line energy to constrain the parameters of gas ejected ballistically from the disk surface. Consider a blob of gas propelled outward just above the plane of the disk. The propulsion could be driven in an number of ways, magnetically, or by the pressure gradient which must exist in the radial direction. The material is expelled and then decelerates under gravity.
If the material is decelerating under gravity then , where is the time under which the deceleration was observed, and is the radius at which the material is situated at that time. Assuming the line originates from neutral iron then the implied initial velocity of the emitting blob is km/s for the line at 5.60 keV in Mrk 766. The observed change in velocity is km/s in .
Taking an estimate of the mass of the black hole to be for Mrk 766 (Wandel, 2002) yields an estimate of the radius to be cm. The escape velocity at this radius is 28000 km/s, close to the (ejection) velocity observed. This ties in nicely with the suggested outflow picture as blobs would have to achieve the escape velocity in order to be ejected and blobs not achieving this velocity would fall back to the disk. Application of the same arguments to the tentative energy shift in NGC 3516 yields a velocity of 47000 km/s, with km/s compared to an escape velocity of 41000 km/s at approximately the same radius (and central mass ).
Interestingly, King & Pounds (2003) note that the outflow velocity for the X-ray absorber in PG 1211 is close to the escape velocity for that inferred radius, suggesting these are related phenomena, where viewing angle determines whether one sees the ejected gas in emission or absorption. We also note evidence for outflow of gas with velocity km/s in PDS 456, where Reeves, O’Brien & Ward (2003) estimated a launch radius of gravitational radii for the absorbing gas, if the outflow velocity is approximately equal to the escape velocity.
The apparent link between the energy of the redshifted line, and the source flux-state during the 2001 observation is intriguing. However, the lack of a comparable feature in the earlier observation (2000 May) indicates there is no long-term relation between the line and source luminosity. One possible explanation is that the emitting cloud responds to luminosity changes on short timescales, but that blobs do not exist on long timescales. This conjures a slightly more complex picture than noted above. The blob may be driven outwards by radiation pressure and maintain a constant velocity so long as that pressure is balanced by gravity. When the radiation field drops to half the previous value we obtain yielding cm, and an escape velocity of 40,000 km/s. In this picture the blob is initially traveling outwards at a constant velocity approximately equal to the escape velocity. The source flux then drops by a factor 2 and the blob decelerates, dropping below the escape velocity. The evolution of the blob then depends on how the central luminosity continues to vary. If the source does not brighten again, the blob will fall back onto the black hole. This picture is appealing, but does not explain why the flux changes within the high-state did not show significant line shifts, leaving it unclear whether this picture is indeed more compelling than the simpler case of a blob driven magnetically or by pressure gradients. It is clear from the above estimates that observations with a long baseline which allow us to monitor these lines across several large changes in central luminosity could allow us to distinguish between radiative and other mechanisms driving the ejecta.
While an ejection model might be expected to yield both blue and redshifted emission lines, assuming gas is symmetrically ejected towards and away from us, the blue lines will be harder to observe in available data. The blueshifted lines from a blob on the near-side of the black hole, traveling outward at the same velocity, would be observed at keV. Interestingly the data show a couple of high points at 7.3 keV (Figs. 2, 3) however there are no significant lines present (Fig. 4). Upper limits on the flux of a narrow line are photons cm-2 s-1 ( eV) and photons cm-2 s-1 ( eV) for the high and low states, respectively. The emitting gas is likely to have a column (George & Fabian, 1991) and hence will absorb much of the fluorescent line emitted on the illuminated side of the blobs on the near side of the hole, whereas we view the illuminated face of the receding blobs directly. This makes it difficult to rule out symmetric outflow. Interestingly, lines have been observed blueward of 6.4 keV in sources such as NGC 7314 (Yaqoob et al., 2003). In that case there was ambiguity as to whether the lines were redshifted H-like and He-like species of Fe or blueshifted lines from neutral Fe.
In Mrk 766 the line at keV has mean equivalent width eV. The strongest component of Fe K, at 6.4 keV, likely has contributions from the optical broad line clouds with in Mrk 766 (Netzer & Laor, 1993). Adding contributions from the narrow-line region and torus yields . The ratio of strengths of the components at 6.4 and 5.6 keV is . Thus the redshifted line likely has covering fraction . Taking our derived radii and column densities, a mass is lost in the blob. The kinetic energy in the outflow is approximately , a few percent of the gravitational potential energy available in the disk at these radii.
Pounds et al. (2003) found a similar covering factor for the variable warm absorber in Mrk 766, and suggested that gas could contribute to the He-like Fe K emission. We prefer a neutral origin for our emission line (if the line originated in He-like Fe then we would expect some H-like Fe and so would expect a pair of redshifted lines). However, in general the Pounds et al. (2003) picture of flare ejecta is consistent with the new result presented here. The variable absorption may be seen in the component of gas on the near side of the flow, and emission is observed from the component on the far side.
Titarchuk, Kazanas & Becker (2003) discuss line photon propagation in bulk outflows from AGN where Thomson scattering in the divergent flow redshifts photons to produce the broad red wing observed on the line profile of most AGN. Similar arguments could be applied to produce the narrow redshifted lines observed in NGC 3516, Mrk 766 and other AGN, although in the latter case the rapid shift in line energy may require a more complex explanation than the decelerating emitter, suggested above.
4 Conclusions
Data from several Seyfert galaxies show narrow, redshifted emission most likely explained as Fe K lines, shifted by relativistic effects. Mrk 766 provides the first detection of a significant shift in the energy of such a line. The timescale of the energy shift is a few tens of kiloseconds, indicating a possible origin in blobs of gas expelled from the nucleus and then gravitationally decelerated. The nature of the ejection mechanism is unknown at this time, but this may be a newly detectable signature of black hole systems.
5 Acknowledgments
We thank Ian George and the anonymous referee for useful comments which improved the paper. T.J. Turner acknowledges support from NASA grant NAG5-7538.
References
-
Fabian et al. (1989)
Fabian, A.C., Rees, M.J., Stella, L, White, N.E.,
1989, MNRAS, 238, 729
-
Fabian et al. (2000)
Fabian, A.C., Iawsawa, K., Reynolds, C.S., Young, A.J.,
2000, PASP, 112, 1145
-
George & Fabian (1991)
George, I. M., Fabian, A. C., 1991, MNRAS, 249, 352
-
Guainazzi (2003)
Guainazzi, M., 2003, A&A 401, 903
-
Laor (1991)
Laor, A., 1991, ApJ, 376, 90
-
King & Pounds (2003)
King, A.R. & Pounds, K.A., 2003, MNRAS, in press
-
Marshall, Canizares & Schulz (2002)
Marshall, H.L., Canizares, C.R., & Schulz, N.S., 2002,
ApJ, 564, 941
-
McMahon et al. (2002)
McMahon, R. G., White, R., L., Helfand, D. J., Becker, R. H.,
2002, ApJS, 143, 1
-
Merloni & Fabian (2001)
Merloni, A. & Fabian, A.C., 2001, MNRAS, 328, 958
-
Miller et al. (2002)
Miller, J.M. et al. 2002, ApJ, 578, 348
-
Nandra et al. (1997)
Nandra, K. George, I.M., Mushotzky, R.F.,
Turner, T.J., Yaqoob, T. 1997,
ApJ, 477, 602
-
Nandra et al. (1999)
Nandra, K., George, I.M., Mushotzky, R.F., Turner, T.J., Yaqoob, T.
1999, ApJ, 523, 17
-
Netzer & Laor (1993)
Netzer, H., Laor, A., 1993, ApJ, 451, 51
-
Pounds et al. (2003)
Pounds, K.A., Reeves, J.N., Page, K.L., Wynn, G.A.,
O’Brien, P.T., 2003, MNRAS, 342, 1147
-
Reeves, O’Brien & Ward (2003)
Reeves, J. N., O’Brien, P. T., Ward, M. J., 2003, astro-ph/00307127
-
Titarchuk, Kazanas & Becker (2003)
Titarchuk, L., Kazanas, D., Becker, P. A., 2003, astro-ph/0307486
-
Turner et al. (2002)
Turner, T.J., et al. 2002, ApJL 574, 123
-
Wandel (2002)
Wandel, A., 2002, ApJ, 565, 762
-
Yaqoob et al. (2003)
Yaqoob, T, George, I.M., Kallman, T.R., Padmanabhan, U.,
Weaver, K.A., Turner, T.J., 2003, submitted to ApJ
- Weyman (1997) Weyman, R.J. 1997