The spectra of short Gamma–Ray Bursts
We present the results of the spectral analysis of a sample of short bright –ray bursts (GRB) detected by BATSE and compare them with the average and time resolved spectral properties of long bright bursts. While the spectral parameters of short GRBs confirm, as expected from previous works based on the hardness ratio, that they are harder than long events, we find that this difference is mainly due to a harder low energy spectral component present in short bursts, rather than to a (marginally) different peak energy. Intriguingly our analysis also reveals that the emission properties of short GRBs are similar to the first 2 s of long events. This might suggest that the central engine of long and short GRBs is the same, just working for a longer time for long GRBs. We find that short bursts do not obey the correlation between peak frequency and isotropic emitted energy for any assumed redshift, while they can obey the similar correlation between the peak frequency and isotropic emitted luminosity. This is consistent with (although not a proof of) the idea that short GRBs emit a –ray luminosity similar to long GRBs. If they indeed obey the peak frequency – isotropic luminosity relation, we can estimate the redshift distribution of short bursts, which turns out to be consistent with that of long bursts just with a slightly smaller average redshift.
Key Words.:
Gamma rays: bursts, observations – X–rays: general – Radiation mechanisms: non–thermal, thermal1 Introduction
The possible existence of different classes of GRBs was considered since their discovery, and the strongest evidence for different populations is their bimodal duration distribution, with 1/3 of ‘short’ events with a mean duration of 0.3 s, and the majority of ‘long’ events with mean duration of 20 s (Kouveliotou et al. Kouveliotou1993 (1993), Norris et al. Norris2000 (2000)). Further support to such a bimodal behavior emerges from the analysis of their spectral and temporal properties: short bursts seem to be harder than long ones (Kouveliotou et al. Kouveliotou1993 (1993), Hurley et al. Hurley1992 (1992)) and their distributions of pulse width, separation and number of pulses per bursts also indicate that the two classes might be physically distinct (Norris et al. Norris2000 (2000), Nakar & Piran Nakar2002 (2002)). The distinction between short and long bursts has been also considered as indication of the existence of two distinct progenitors. If the duration of the GRB emission (as predicted by the internal shock model - see e.g. Piran Piran1999 (1999) for a review) is linked to the duration of the inner engine activity, short bursts might be produced by the merger of compact objects (Ruffert & Janka Ruffert1999 (1999)) while the core collapse of massive stars would give raise to long duration GRBs. While the properties of long events (e.g. redshifts, broad band spectral emission and evolution, environment etc., see Hurley et al. Hurley 2003 (2003) for a recent review) have been unveiled with increasing details, the understanding of short bursts is still limited. Recently, Schmidt (Schmidt2001 (2001)) suggested that short bursts have a similar luminosity to long events. So far the characterization of the spectral properties of short bursts detected by BATSE has been based on the comparison of the ratio of the fluxes emitted in different (broad) energy bands (Cline et al. 1999; Yi–ping Qui 2001). The spectrum of long GRBs, typically represented by smoothly connected power laws, is different for different bursts (Band et al. Band1993 (1993)) and it may also considerably evolve in time within the same burst (Ford et al. Ford1995 (1995), Crider et al. Crider1997 (1997)). This complex behaviour compels to consider the complete spectrum of any GRB with high time and spectral resolution in order to describe and compare the emission properties of long and short bursts. Clearly the main difficulty when fitting short burst spectra is their low signal to noise ratio due to their small duration. Paciesas et al. (Paciesas2001 (2001)) compared the spectral parameters of short and long bursts obtained from spectral fits: they found that in short bursts the low energy spectral index and the peak energy are harder than in long events. However, the time resolution (2 s) of the spectra used to describe the class of short bursts was much larger than their typical duration (0.3 s) and also the spectral resolution of their data was low compared to that of the data presented in this work. Also the distance scale of short GRBs is still a matter of debate. Their spatial distribution seems to be consistent with low redshift sources (e.g. Magliocchetti et al. Magliocchetti2003 (2003), Che et al. Che1997 (1997)), but nothing is directly known due to the lack of any redshift measurement. On the other hand, possible correlations among the spectral properties of long bursts have been recently claimed (Amati et al. Amati2002 (2002), see also Yonetoku et al. Yonetoku2003 (2003)) and confirmed by the Hete–II long GRBs and X–Ray Flashes (Lamb 2003a ). These relations might be key in explaining the still obscure energy conversion mechanism operating in long GRBs and it is thus interesting to investigate whether similar correlations also hold for short bursts.
2 Sample selection and spectral analysis
From the BATSE on–line catalog111http://cossc.gsfc.nasa.gov/cossc/batse/ we have selected bright short ( s) events as those with a peak flux (computed on the 64 ms timescale and integrated over the energy range 50–300 keV) exceeding 10 phot cm-2 s-1. The hardness ratios of these 36 selected short GRBs, computed over the energy ranges 1=25–50 keV, 2=50–100 keV, 3=100–300 keV, are and . These values are larger than the corresponding HRs of the population of long bursts ( and ), in agreement with the hardness–duration relation (Kouveliotou et al. Kouveliotou1993 (1993)). The average fluences (for energies keV) of the selected short GRBs is erg s-1 (i.e., only a factor 2.5 lower than for long bursts). We analyzed their spectra using the Large Area Detector (LAD) data and applied the standard spectral analysis technique (e.g. Preece et al. Preece2000 (2000), hereafter P00). Each spectrum was fitted over the energy range keV – 1.8 MeV. Due to their short duration, the minimum integration time (S/N limited) of the LAD spectra is typically s, so that we could analyze in most cases one single spectrum per short GRB. In 7 cases out of 36, the spectrum had a low S/N over the entire energy range which resulted in poorly constrained best fit parameters. These cases were not included in the final sample. In one case the analysis was not possible because of missing data. The remaining 28 sources (with 100-300 keV fluence erg/cm2), although belonging to a complete peak flux limited sample, do not form themselves a complete sample.
The spectral properties of short bursts have been compared with the results of the spectral analysis of a sample of bright long BATSE bursts (Ghirlanda et al. 2002 – hereafter G02) whose spectra (time averaged and time resolved) were fitted with different spectral models. The sample of G02 was selected on the basis of the burst peak flux, similarly to the criterion applied for the sample of short events presented in this work.
2.1 Spectral results
The spectrum of the selected short bursts is in most cases well fitted by a single power law with an exponential cutoff at high energies. The spectral parameters are the low energy power law photon index and the peak energy (in keV) of the spectrum. This model fit resulted in a lower reduced and in better constrained spectral parameters compared with the Band function, single power law and broken power law models. In most cases the statistics in the high energy channels of the spectra is too poor to constrain the high energy power law component of the Band model (Band et al. Band1993 (1993)). In 5 cases out of the 28 analyzed the reduced of the powerlaw cutoff model is high and excludes the fit at 99% confidence level. In these cases, however, the Band model resulted in even higher reduced and we adopted the parameters of the powerlaw cutoff model for homogeneity with the rest of the sample. Tab. 1 222This is available in electronic form at …….. lists our selected bursts, together with the spectral results and their errors at 99% confidence level. As also found by Paciesas et al. (Paciesas2001 (2001)), there is no evidence for any correlation between , and the burst duration represented by the parameter given in the BATSE catalog of Paciesas et al. (Paciesas1999 (1999)). The short duration of most bursts ( s) does not allow a time resolved spectral analysis, but in 5 cases we could extract at least two (in one case even three) time resolved spectra within the interval. Nonetheless, the low statistics of these time resolved spectra results in large uncertainties on the spectral parameters, with only a weak indication of a hard–to–soft spectral evolution similar to what found in long GRBs (e.g. Ford et al. Ford1995 (1995)). This supports the trend found from the analysis of the time resolved hardness ratio (e.g. Cline et al. Cline1999 (1999)).
In 6 short GRBs the low energy spectrum is harder than the optically thin synchrotron limit (Katz 1994). In one case . A similar fraction of long bursts violating these limits has been found in the population of long GRBs (Crider et al. Crider1997 (1997), P00, Ghirlanda et al. Ghirlanda2003 (2003)).
3 Short vs Long GRBs
We compared the spectral properties of our short GRBs with those of the long–bright events of G02. For homogenity we considered the spectral parameters of long bright bursts obtained from the fits of the same model, i.e. a cutoff–powerlaw, adopted for the short ones.
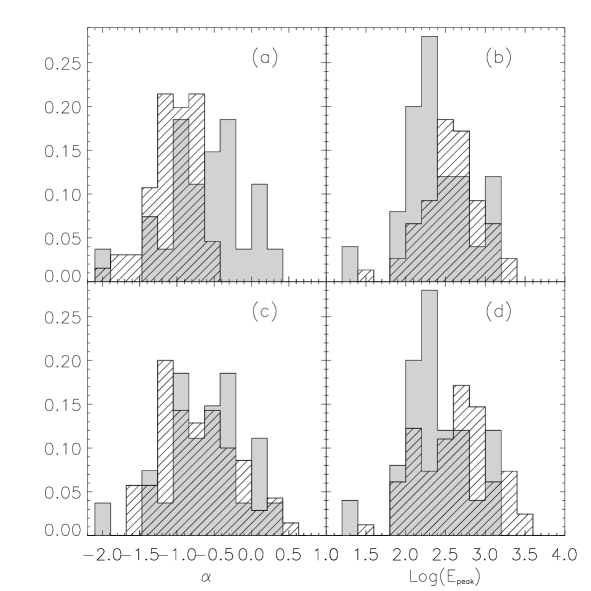
Firstly we compare the time integrated spectral parameters. The distributions of and for long and short bursts are reported in Fig. 1 (top panels). Long bursts have an average peak energy ( keV) slightly larger than that of short events ( keV). The distribution of the latter ones spreads between a few keV and a few MeV. A Kolmogorov–Smirnov (KS) test gives a probability of 0.8% that the two samples are drawn from the same parent population. A more significant diversity results from the comparison of the distributions of : the average values are and for long and short GRBs, respectively (KS probability of 0.04%).
Then we conclude that the hardness–duration relation, discussed for the BATSE bursts (Kouveliotou et al. Kouveliotou1993 (1993), Cline et al. 1999, Yi-ping Qui 2001), is caused more by short bursts having a harder low energy spectral slope rather than a higher peak energy. Indeed, if was the only parameter characterizing the spectral hardness, short events would be softer than long ones. This conclusion is further supported by the search of correlations between the hardness ratios and the spectral parameters of our short bursts. The only significant trend is of harder for larger HR32 (Spearman’s correlation coefficient with null hypothesis probability of ). A larger sample of bright BATSE long bursts was studied by Preece et al. (Preece2000 (2000)). Although their sample has not been fitted homogeneously with the same model their spectral results also confirm our finding that short bursts are harder than long GRBs because of a harder index rather than a higher .
The average spectral parameters give only an indication of the spectrum, which is likely to evolve in time, in all its spectral parameters (e.g., , etc., Crider et al. Crider1997 (1997)). Therefore, in order to test the tantalizing hypothesis that the spectrum of short bursts is similar to the initial emission phases of long events, we considered the time resolved spectral parameters reported for the G02 sample relative to the first seconds since the burst onset.
The spectrum of short bursts, as described by and , is more similar to the first 2 s than the integrated spectrum of long events, as shown in Fig. 1 (bottom panels): the low energy spectral index distributions are similar (with a KS probability of 83%) while the peak energy distributions still indicate that short events are softer than long ones (with a KS probability of 10%).
Another appealing possibility is that short bursts might be similar to the peak spectra of long bursts (i.e. they represent the ‘tip of the iceberg’ in the long GRB light curve). To this aim we extracted from the catalog of Preece et al. (2000) only those spectra accumulated around the peak with an integration time (centered around the peak time) at least as long as the average duration of short bursts (0.3 s). From the comparison of the spectral parameters distributions we conclude that short bursts are still different – especially for the value – from the peak of long GRBs as also indicated by the small KS probability (0.4%). The low energy spectral index instead, similarly to what found from the comparison with the first 2 seconds of long events, presents a distribution similar to that for the peak spectra of long events (with a KS probability of 23%). Moreover, we stress that if the fits were performed with the Band model (regardless of the indetermination of the high energy spectral slope) we should find a systematically lower peak energy than what found with the powerlaw cutoff model (e.g. Preece et al. Preece2000 (2000), Ghirlanda et al. Ghirlanda2002 (2002)). This would strengthen our conclusions.
4 The energy and luminosity of short bursts
To further test the relationship between short and long GRBs, we considered the recently found spectral correlations for long GRBs between and the equivalent isotropic energy in the source reference frame (Amati et al. Amati2002 (2002)). A similar result was found from a sample of BATSE bursts (Lloyd et al. Lloyd2000 (2000), Bloom et al. Bloom2001 (2001)) and also by the Hete–II long bursts, with the inclusion of 2 X–Ray Flashes, extending this relation to low energies (Lamb et al. 2003a ). Moreover Yonetoku et al. (Yonetoku2003 (2003)) found a similar correlation between the isotropic luminosity and of the BATSE and BeppoSAX samples. If short GRBs are similar to long events they might satisfy the above correlations. However, the redshift of short bursts is unknown. Thus we can only verify whether the observed spectral properties of short bursts, scaled in the source rest frame (for any ), are consistent with the above correlations. In other words, from the spectral fits of short bursts we can derive the peak energy () and the fluence () integrated over the same band used by Amati et al. (Amati2002 (2002)) and Bloom et al. (2001), i.e. 1 keV – 10 MeV. These can be converted in the source reference frame for any redshift: , and [for cosmological parameters ]. These were compared with the relation found by Amati et al. (Amati2002 (2002)) for a redshift range 0.001-10. The same was done for the luminosity . We find that for any given (up to 10) short bursts (except for 2 cases) populate a region below the – correlation of long GRBs. The luminosity of short events 333 Note that for short bursts is obtained from the spectrum integrated over their typical duration (0.5 sec). Similarly Yonetoku et al. (2003) derive this luminosity for long bursts either from the spectrum integrated around the GRB peak on a comparable timescale (for BATSE GRBs) or by dividing for the burst duration (for SAX GRBs). is instead consistent with the correlation proposed for long bursts (Yonetoku et al. Yonetoku2003 (2003)). Following the spectral results suggesting that short GRB might be similar to the first s of long ones, we scaled the – correlation (computed for the peak spectra of long events) to the first second of their emission by considering the typical ratios between fluxes and estimated at the peak and those integrated over the first second. The curves of of short bursts are still consistent with this relation. Although neither obvious nor unique to interpret, these results are at least consistent with the hypothesis that the luminosity of short GRBs is comparable to that of long bursts within the first seconds, with instead a lower isotropic equivalent energy. In this case the different duration might be responsible for a lower total energy emitted in short bursts. Under such hypothesis it is also possible to tentatively infer the redshift distribution of (our) short bursts by assuming that they satisfy the – correlation. The resulting distribution (Fig. 2) is compared to that of a sample of long bursts for which the redshift has been inferred from the claimed correlation between the variability properties of their prompt emission light curve and their luminosity (Fenimore & Ramirez–Ruiz 2001). Short bursts have a slightly smaller average redshift compared to the sample of long events.
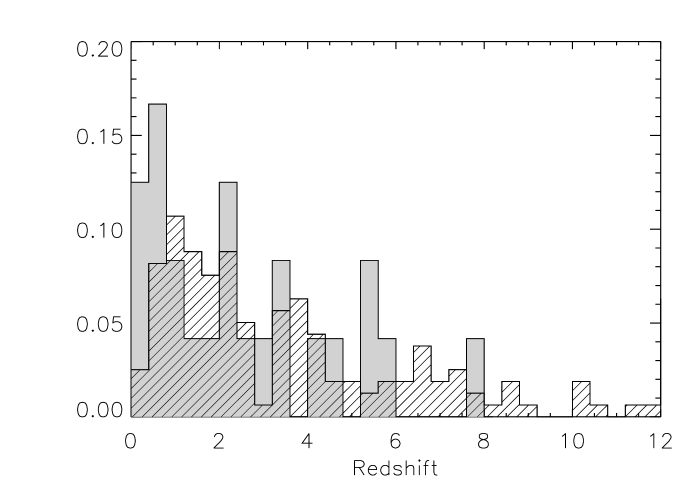
We stress that this result is heavily dependent on the assumptions that short GRBs i) have the same luminosity of long ones, and ii) obey the same – correlation followed by long GRBs. Both these assumptions will be tested when a reasonable number of redshift of short GBRs will be known.
5 Conclusions
We selected a sample of short bright bursts from the BATSE catalog and performed a standard spectral analysis in order to characterize their spectrum. No correlation was found between the spectral parameters and the global properties (duration and flux) of these bursts. The low energy spectral index is distributed between –2 and small positive values and the peak energy is between 20 keV and 2 MeV. Similarly to long bursts (e.g. Preece et al. 2000), some short bursts have a low energy spectrum harder than the optically thin synchrotron limit.
The comparison of the spectral properties of short and long GRBs (G02 sample) revealed that: (i) the higher hardness of short GRBs with respect to long events (typically described in terms of fluence hardness ratio) is the effect of a harder low energy spectrum rather than of a marginally different peak energy; (ii) the spectral properties of short bursts are similar to those of the first 2 s of long GRBs.
Short bursts are then harder than the time–average spectra of long GRBs, but their properties are compatible with a similar mechanism operating at the beginning of all bursts, independently of their duration.
Short bursts cannot obey the energy–peak frequency correlation found for long bursts (Amati et al. Amati2002 (2002), Lamb et al. 2003a ), but they could obey the similar correlation found by Yonetoku et al. (Yonetoku2003 (2003)) between the luminosity and the peak frequency. This may suggest that short bursts have the same luminosity, but lower total energy, than long bursts. If this is the case the redshift distribution inferred for the short bursts of our sample is similar to that of long events, with a slightly smaller average redshift.
Acknowledgements.
This research has made use of data obtained through the High Energy Astrophysics Science Archive Research Center Online Service, provided by the NASA/Goddard Space Flight Center. We thank F. Tavecchio for discussion and the referee for useful comments.References
- (1) Amati L., Frontera F., Tavani M., et al., 2002, A&A, 390, 81
- (2) Band D.L., Matteson, J., Ford, L., et al., 1993, ApJ, 413, 281
- (3) Bloom J., Frail, D. A., Sari, R., 2001, ApJ, 121, 2879
- (4) Che H., Yang Y., Wu M., et al., 1997, ApJ, 483, L25
- (5) Cline B. D., Matthey C. and Otwinowski S., 1999, ApJ, 527, 827
- (6) Crider A., Liang E. P., Smith I. A., et al., 1997, ApJ, 479, L39
- (7) Fenimore E. and Ramirez-Ruiz E., astro-ph/0004176
- (8) Ford L., Band D. L., Matteson J. L., et al., 1995, ApJ, 439, 307
- (9) Ghirlanda G., Celotti A. & Ghisellini G., 2002, A&A, 393, 409 (G02)
- (10) Ghirlanda G., Celotti A. & Ghisellini G., 2003, A&A, 406, 879
- (11) Hurley K. et al., AIP Conf. Proc., 1992, 265, 195
- (12) Hurley K., Sari R. & Djorgovski S. G., 2003, astro-ph/0211620
- (13) Lloyd M. N., Petrosian V., Mallozzi R. S., 2000, ApJ, 534, 227
- (14) Kouveliotou K., Meegan C. A., Fishman G. J., et al., 1993, ApJ, 413, L101
- (15) Kulkarni S., Goodrich R., Berger E., Fox D. W., Bloom J. S., Blake C. A., 2002, GCN, 1428
- (16) Lamb D., Ricker G. R., Atteia J.-L. et al., 2003, astro-ph/0206151
- (17) Lamb D., Ricker G. R., Atteia J.-L. et al., 2003a, astro-ph/0309462
- (18) Magliocchetti M., Ghirlanda G. & Celotti A., 2003, MNRAS, 343, 255
- (19) Nakar E. & Piran T., 2002, MNRAS, 330, 920
- (20) Norris J., Scargle J. & Bonnel J., 2000, BAAS,32,1244
- (21) Paciesas W. S., Preece R. D., Briggs M. S., Mallozzi R. S., 2001, Gamma Ray Bursts in the Afterglow Era, Conf. Proc. 2nd Rome Workshop, p.13
- (22) Paciesas W. S., Meegan C. A., Pendleton G. N., et al., 1999, ApJSS 122, 465
- (23) Piran T., 1999, Phys. Rep., 333, 529
- (24) Preece R. D., Briggs M. S., Mallozzi R. S., Pendleton G. N., Paciesas W. S., Band D. L., 2000, ApJS, 126, 19 (P00)
- (25) Ruffert M. & Janka H. T., 1999, A&A, 344, 573
- (26) Schmidt M., 2001, ApJ, 559, L79
- (27) Yonetoku D., Murakami T., Nakamura T., Yamazaki R., Inoue A. K., Iokaet K., astro-ph/0309217
| GRB | TR # | b | c | Fluenceh | ||||
|---|---|---|---|---|---|---|---|---|
| sec | phot/cm2 sec | keV | erg/cm2 sec | erg/cm2 | ||||
| 910609 | 298 | 0.4550.065 | 56.11.2 | -0.50.8 | 12253 | 113.5/102 | (2.60.1)E-07 | (1.820.07)E-07 |
| 910626 | 444 | 0.2560.091 | 28.60.7 | -0.80.2 | 12844 | 115.4/102 | (1.90.03)E-06 | (4.80.07)E-07 |
| 911119 | 1088 | 0.1920.091 | 11.90.6 | 0.11.0 | 143110 | 123.3/104 | (7.10.3)E-08 | (7.30.3)E-08 |
| 920229 | 1453 | 0.1920.453 | 11.90.6 | -0.150.08 | 173.889 | 87.6/108 | (2.50.1)E-07 | (1.760.07)E-07 |
| 920414 | 1553 | 0.960.143 | 13.70.5 | -0.50.3 | 548310 | 108/95 | (8.40.2)E-06 | (8.60.2)E-06 |
| 921123 | 2068 | 0.5910.06 | 15.60.6 | -0.20.3 | 17250 | 129/107 | (1.00.03)E-06 | (0.380.01)E-06 |
| 930110 | 2125 | 0.2230.013 | 150.5 | -0.50.2 | 583150 | 86/102 | (5.20.07)E-06 | (1.660.02)E-06 |
| 930329 | 2273 | 0.2240.066 | 18.50.6 | -0.180.21 | 290123 | 88/99 | (8.50.4)E-07 | (3.80.17)E-07 |
| 930428 | 2320 | 0.6080.041 | 110.5 | -0.60.1 | 18445 | 82/103 | (1.90.1)E-06 | (1.80.1)E-06 |
| 930905 | 2514 | 0.20.094 | 280.7 | -0.80.1 | 19438 | 112/100 | (4.30.1)E-06 | (1.10.02)E-06 |
| 931101 | 2614 | 0.2960.057 | 100.5 | -1.00.1 | 163240 | 90/108 | (4.60.1)E-06 | (1.470.03)E-06 |
| 931205 | 2679 | 0.2560.091 | 13.70.5 | -0.30.2 | 1025343 | 145/106 | (1.10.07)E-05 | (0.350.02)E-05 |
| 931229 | 2715 | 0.3840.091 | 10.40.5 | 0.140.11 | 1031319 | 111/107 | (2.70.4)E-05 | (0.90.1)E-05 |
| 940329 | 2896 | 0.4560.033 | 10.40.4 | -0.80.2 | 9029 | 113/106 | (1.80.05)E-06 | (0.570.01)E-06 |
| 940415 | 2933 | 0.320.091 | 10.70.4 | 0.20.6 | 232148 | 153/107 | (5.90.3)E-07 | (3.40.2)E-07 |
| 940717 | 3087 | 1.1520.091 | 18.60.5 | -1.10.1 | 20455 | 139/107 | (3.40.1)E-06 | (4.60.1)E-06 |
| 940902 | 3152 | 1.7930.066 | 25.30.7 | -0.20.3 | 937265 | 129/107 | (2.40.07)E-05 | (3.60.1)E-05 |
| 940918 | 3173 | 0.2080.025 | 14.90.6 | -1.00.1 | 561.8300 | 142/105 | (1.81)E-06 | (0.60.3)E-06 |
| 950211 | 3412 | 0.0680.006 | 54.80.7 | -1.30.5 | 75.560 | 92/103 | (8.91.5)E-07 | (2.60.4)E-07 |
| 960803 | 5561 | 0.1040.011 | 19.30.4 | -2.70.2 | 28 | 108/109 | (1.20.5)E-06 | (1.00.4)E-06 |
| 970315 | 6123 | 0.1860.042 | 12.80.4 | -0.21.0 | 135100 | 119/108 | (9.90.1)E-08 | (0.850.01)E-07 |
| 970704 | 6293 | 0.1920.091 | 88.51.0 | -1.20.02 | 1800 | 132/109 | (1.10.2)E-04 | (0.250.04)E-04 |
| 971218 | 6535 | 1.6640.143 | 11.80.3 | -0.90.08 | 1202407 | 150/108 | (6.10.2)E-06 | (7.20.2)E-06 |
| 980310 | 6635 | 1.1520.143 | 120.3 | -1.90.1 | 2015 | 109/108 | (2.00.01)E-06 | (4.420.02)E-06 |
| 980330 | 6668 | 0.1160.006 | 390.6 | -0.30.4 | 204118 | 126/107 | (8.20.4)E-07 | (5.00.2)E-07 |
| 981226 | 7281 | 1.6640.143 | 16.80.4 | -0.80.1 | 14828 | 138.6/107 | (9.11.0)E-07 | (7.80.8)E-07 |
| 991002 | 7784 | 1.90.5 | 10.20.3 | -0.80.3 | 16480 | 154/108 | (4.10.2)E-07 | (5.60.2)E-07 |
| 000108 | 7939 | 1.0390.072 | 10.70.3 | -0.00.2 | 12890 | 143/107 | (2.20.05)E-06 | (0.70.01)E-06 |
-
a
GRB trigger number (BATSE catalog).
-
b
GRB duration (BATSE catalog).
-
c
Integrated flux in the energy range 50 keV - 300 keV.
-
d
Observed energy flux from the best fit model over the energy range 1 keV – 10 MeV.
-
h
Fluence in the range 50-300 keV.