Ultraviolet Emission from the Millisecond Pulsar J04374715111Based on observations made with the NASA/ESA Hubble Space Telescope, obtained at the Space Telescope Science Institute, which is operated by the Association of Universities for Research in Astronomy, Inc., under NASA contract NAS 5-26555. These observations are associated with program # GO-9098.
Abstract
We observed PSR J04374715 with the FUV-MAMA detector of the Hubble Space Telescope Imaging Spectrometer (STIS) to measure the pulsar’s spectrum and pulsations. For the first time, UV emission from a millisecond pulsar is detected. The measured flux, erg s-1 cm-2 in the 1150–1700 Å range, corresponds to the luminosity erg s-1, for the distance of 140 pc and negligible interstellar extinction. The shape of the observed spectrum suggests thermal emission from the neutron star surface with a surprisingly high temperature of about K, above the upper limit on the surface temperature of the younger “ordinary” pulsar J01081431. For the few-Gyr-old J04374715, such a temperature requires a heating mechanism to operate. The spectrum of J04374715 shows marginal evidence of an emission line at 1372 Å, which might be a gravitationally redshifted Zeeman component of the Hydrogen Ly line in a magnetic field G. No pulsations are detected, with a upper limit of 50% on pulsed fraction.
1 Introduction
Millisecond (recycled) pulsars are very old neutron stars (NSs) spun up by accretion in binary systems. So far, X-ray observations have been the only source of information about emission from millisecond pulsars (MSPs) outside the radio band (Becker & Pavlov 2001; Becker & Aschenbach 2002). Based on their X-ray pulse profiles and spectra, the X-ray emitting MSPs can be divided into two distinct groups. The pulsars from the first group (e.g., PSR B182124, B1937+21, J0218+4232) show X-ray pulse profiles with narrow peaks, resembling those seen in radio, and large pulsed fractions, . They have hard power-law spectra, with photon indices –2, and high spin-down luminosities, – erg s-1. The X-ray radiation from these MSPs is interpreted as nonthermal emission produced in the pulsar magnetosphere.
The second group consists of MSPs with smoother X-ray pulsations, lower pulsed fractions, and smaller (– erg s-1). In those few cases when the X-ray spectra are available (e.g., PSR J04374715 and J0030+0451), they cannot be fitted with a single power-law model. The fits with simple spectral models (power-law, blackbody) require at least two spectral components, one of which is very soft. Likely, this soft component can be interpreted as thermal emission from NS polar caps, with a temperature MK. Such polar caps, heated by a backward flow of relativistic particles accelerated in the magnetosphere above the NS magnetic poles, are predicted by virtually all pair-cascade pulsar models (e.g., Ruderman & Sutherland 1975; Arons 1981; Harding & Muslimov 2002). The thermal component cannot be seen in the first group of MSPs because it is buried under the stronger nonthermal component, similar to young ordinary pulsars (e.g., Pavlov, Zavlin, & Sanwal 2002).
Detailed X-ray studies of PSR J04374715, the brightest MSP of the second group, suggest that the thermal component of its radiation is emitted from a region with a nonuniform temperature, decreasing from the magnetic poles towards the equator (Zavlin & Pavlov 1998; Zavlin et al. 2002). Such a nonuniformity could be interpreted as due to a heat flow away from the polar cap. In addition to the external (polar-cap) heating, a variety of internal heating mechanisms can operate in the NS interiors, such as dissipation of the NS rotational energy and magnetic field (Schaab et al. 1999, and references therein). Consequently, the temperature distribution and, particularly, the lower value of the surface temperature depend on the thermal conductivity of the NS matter and the relative contributions from the external and internal heating. X-ray observations mainly probe thermal emission from the hot polar regions, being less sensitive to the emission from the rest of the NS surface with a lower temperature. This low-temperature emission can only be observed in the optical-UV range. Measuring the temperature of the NS surface in MSPs is important because it can constrain the NS heating models and provide information about the physical processes operating in the NS interior. If the magnetospheric component dominates in the optical-UV, its detection would help elucidate the properties of relativistic particles in the MSP magnetospheres.
Most MSPs reside in binary systems, usually with a low-mass white dwarf (WD) companion that, as a rule, is expected to be brighter in the optical than the MSP itself. Therefore, solitary MSPs look more suitable for studying the NS optical emission. However, no firm detections of optical/UV emission from solitary MSPs have been reported. Even very deep VLT observations of the solitary MSPs J0030+0451 (Koptsevich et al. 2003) and J21243358 (Mignani & Becker 2003) gave negative results, putting some constraints on the nonthermal emission in the optical. On the other hand, if the companion of a binary MSP is sufficiently cold, it is very faint in the UV range, which can be used to observe NSs in nearby binary MSPs, particularly their thermal emission.
The best target for such observations is PSR J0437–4715, the nearest and the brightest binary MSP ( ms, pc, Gyr, erg s-1 — van Straten et al. 2001). Its binary companion is a cold WD with the effective surface temperature of about 4000 K (Danziger et al. 1993) and orbital period of 5.5 days. Optical emission from the binary is dominated by the WD (, , ), making optical detection of the pulsar impossible. This prompted us to carry out observations of the system in the far-ultraviolet (FUV) range with the Hubble Space Telescope (HST). In this paper we report first detection of UV emission from a non-accreting MSP. The details of the observations and the data analysis are presented in §2 and §3. The results and their implications are discussed in §4 and summarized in §5.
2 Observations
PSR J04374715 (J0437 hereafter) was observed on 2001 August 24 (start date 52 145.23638667 MJD) with the Space Telescope Imaging Spectrograph (STIS). The source was imaged on the Far-Ultraviolet Multi Anode Micro-channel Array (FUV-MAMA). The low-resolution grating G140L (which covers the wavelength interval –1700 Å) with the slit were used. The data were taken during five consecutive orbits, including target acquisition. We used the WD companion of the pulsar as the acquisition target, centering it in the slit to a nominal accuracy. The total scientific exposure time was 14,150 s (2,150 s for the first exposure and 3,000 s for each of the subsequent exposures). FUV-MAMA was operated in TIME-TAG mode which allows the photon arrival times to be recorded with 125 s resolution.
3 Data analysis
For each exposure, we processed the raw, “high-resolution” images ( pixels; plate scale of per pixel — see §11 of the STIS Instrument Handbook 444http://www.stsci.edu/hst/stis/documents/handbooks/currentIHB/c11_datataking2.html , IHB hereafter) using the calibration files available on January 23, 2003. As an output, we obtained flat-fielded “low-resolution” ( pixels; plate scale pixel-1; spectral resolution 0.58 Å pixel-1) images and used them for the spectral analysis.
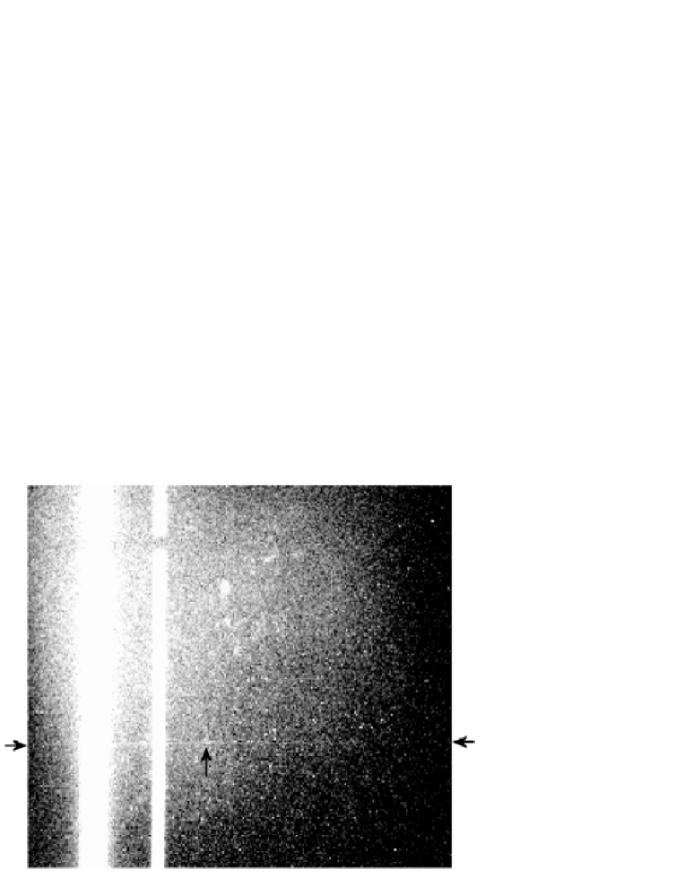
The processed images show a nonuniform detector background that consists of a flat (constant) component and the so-called “thermal glow” component (Landsman 1998) that dominates over most of the detector area. The thermal glow is the strongest in the upper-left quadrant of the detector (Fig. 1), where the dark count rate can exceed the nominal value, counts s-1 pixel-1, by a factor of 20. The brightness of the thermal glow increases exponentially with increasing the FUV-MAMA power supply temperature above 38.9 K (Landsman 1998). In our observation, this temperature was rising from 40.89 K during the first orbit to 42.36 K during the last orbit, resulting in brightening thermal glow. In addition, the overall shape and small-scale structure of the thermal glow varied slightly between the exposures.
Because of the high background, the dispersed source spectrum is hardly discernible in the separate exposures. Nevertheless, we find the spectrum centered at pixels in each of the flat-fielded images (the centroid slightly varies with ), where and are the image coordinates along the dispersion and spatial axes, respectively. This is within 2 pixels (005) of the nominal position where the target was expected to be acquired. At this location on the detector, the contribution of the thermal glow to the background is still quite large — the background averaged along the dispersion direction exceeds the nominal background by a factor of 10. To improve the signal-to-noise ratio (S/N), we combined the images from five exposures into a single image using the STSDAS555Space Telescope Data Analysis System available at http://stsdas.stsci.edu/STSDAS.html task “mscombine”. The -positions of the centroids differ by less than 3 pixels for different exposures and different wavelengths (-positions). The spectrum of the source is clearly seen in the summed image shown in Figure 1.
Accurate subtraction of the enhanced, nonuniform background is crucial to measure the spectrum of our faint target. The spectral extraction algorithm implemented in the standard STIS pipeline (task X1D) does not adequately correct for the nonuniform background while extracting the spectrum of such a faint source. Therefore, we developed an IDL routine with additional capabilities of grouping and fitting the background to reduce the data.
Since the source spectrum occupies only a small region on the detector, we do not attempt to subtract the background globally. Instead, we scan the count distribution within two strips, and , adjacent to the source region, . To obtain the spectrum with a sufficiently high S/N, we have to bin the spectrum heavily; after some experimenting, we chose four spectral bins (-bins): 1155–1187, 1248–1283, 1316–1376, and 1400–1702 Å. The first two -bins are chosen to avoid contamination by the geocoronal line emission (Ly line at 1216 Å and the Oxygen line at 1304 Å; the other geocoronal Oxygen line, at 1356 Å, is not seen in this observation). Because of an enhanced background at 1376–1400 Å, we also exclude this region from the spectral analysis, which determines the choice of the third -bin (1316–1376 Å). The remaining counts are grouped into a single bin (1400–1702 Å) to have comparable S/N in the second through fourth -bins.
For each of the -bins, we calculate the total number of counts, , within the extraction boxes of different heights (one-dimensional apertures): , 5, 7, 9, 11, 13, 15, and 17 pixels, centered at , 352, 353, and 352 for the 1st, 2nd, 3rd, and 4th -bins, respectively. To evaluate the background, we first clean the background strips (see above) from outstanding ( cts s-1 pixel-1) values (“bad pixels”) by setting them to local average values (median filtering or standard sigma-clipping algorithms are not applicable in this case — see IHB §7.4.2). Then, for each of the -bins, we fit the -distribution of the background counts with a first-order polynomial (interpolating across the source region), estimate the number of background counts within the source extraction aperture , and evaluate the number of source counts, (Table 1).
The uncertainty of the source counts can be evaluated as , where is the background uncertainty in the source aperture. For a uniform, Poissonian background, this quantity can be estimated as , where ( pixels) is the aperture where the background was measured. To account for the background nouniformity, we estimated directly from the image. We binned the distribution of background counts along the -axis with the bin sizes equal to (for , 5, and 7) and calculated as root-mean-square of the differences between the actual numbers of background counts in the bins and those obtained from the fit to the background. The background uncertainties obtained in this way are systematically larger (see Table 1) than the uncertainties estimated assuming a uniform, Poissonian background.
We find that the signal-to-noise ratio, , calculated for each -bin and for different extraction box heights, is the largest for or 5 pixels, depending on the -bin. Since the results at small heights are sensitive to the deviation of the spectrum from the straight line (along the dispersion direction) and possible small misalignments between the frames taken in the different orbits, we choose pixels as the optimal value. We adopt this source extraction aperture for further analysis, which contains 53%, 61%, 64%, and 65% of source counts for the first through the fourth -bins, respectively).
For each -bin, we calculate the average spectral flux defined as
| (1) |
where is the source count rate in the -th -bin, and is the system response (which includes the Optical Telescope Assembly throughput and accounts for the grating and slit losses and the finite size of the source extraction aperture; see §3.4.12 of the HST Data Handbook for STIS666 http://www.stsci.edu/hst/stis/documents/handbooks/currentDHB/STIS_longdhbTOC.html for details). The resulting flux values are given in Table 1, while the spectrum is shown in Figure 2. The total flux in the 1150–1700 Å range Å), can be estimated as erg s-1 cm-2, corresponding to the luminosity erg s-1.
In the original spectrum we see a brightening around 1372 Å (marked with a vertical arrow in Fig. 1), resembling an emission line. The count rate spectrum of the possible line and its vicinity, binned to 1.16 Å (4 high-resolution pixels) bins, is shown in Figure 3. The count excess, counts in the three bins, corresponds to the flux erg cm-2 s-1 in the 1370.1–1373.6 Å range. This spectral feature, detected at a 3 level, is clearly not of a geocoronal origin (the nearest geocoronal oxygen line, at 1356 Å, is not seen in this observation), but we cannot rule out the opportunity that it may be associated with an anomaly in the FUV-MAMA background seen right above the feature (in the cross-dispersion direction). Therefore, we consider this as a marginal detection until the feature is confirmed in another observation.
For the timing analysis, we used the so-called TIME-TAG data files that contain the photon arrival times, recorded at a s time resolution, and high-resolution detector coordinates (see §2) associated with each of the events. We extracted 2964 events from the above-defined four -bins, with the height of extraction box equal to 9 high-resolution pixels (% of these counts are expected to come from the source). Note that the background count rate in these data is about 3% higher than that in the data used for the spectral analysis where “outstanding pixels” were filtered out (see above). The arrival times of the events were corrected for the Earth and spacecraft motions and transformed to barycentric dynamical times (TDB) at the solar system barycenter, using the STSDAS task “odelaytime”. To correct the TDB arrival times for the effect of the binary orbital Doppler shift (Taylor & Weisberg 1989) and to extract the light curve, we used the pulsar and binary orbit ephemerides from van Straten et al. (2001).
Since the frequency of radio pulsations, Hz at the epoch of the STIS observation, is known with high precision, much higher than one can achieve in the time span s of our observation, there is no need to search for the period in the FUV data. We folded the corrected arrival times with the pulsar’s period and obtained the light curves for different numbers of phase bins. An example of the light curve for 4 phase bins, with an arbitrarily fixed reference phase (histogram) and averaged over the reference phase (smooth line; see Gregory & Loredo 1992 for a description of this procedure) is shown in Figure 4. The observed pulsed fraction can be estimated as , which means that the pulsations are not statistically significant.
The upper limit on the pulsed fraction can also be estimated from the test (e.g., Buccheri et al. 1983) that gives , 2.8, 5.2, 8.1, and 8.7 for , 2, 3, 4, and 5, respectively, at the radio pulsation frequency ( is the number of harmonics included). For randomly distributed arrival times, the probabilities of getting larger than these values are 0.26, 0.59, 0.52, 0.42, and 0.56, respectively, which confirms that no periodic signal is detected. An upper limit on the pulsed fraction can be estimated from the value, assuming sine-like pulsations. At a confidence level, the limit is 11%–12%, depending on the method used for estimation (e.g., Protheroe 1987; Vaughan et al. 1994; Brazier 1994). It translates into an upper limit –53% for the intrinsic pulsed fraction of J0437, corrected for the background contribution. The upper limit is close to the pulsed fraction at keV, and it exceeds the pulsed fraction, , observed in soft X-rays (Zavlin & Pavlov 1998). If the FUV radiation is thermal, as suggested by the spectrum (see §4), we expect the pulsed fraction to be even lower than 30% (because the FUV radiation is presumably emitted from a large fraction of the NS surface), so the limit is not truly restrictive. The reason for that is the very high detector background. We attempted to improve the S/N repeating the analysis for the first four orbits, with the lower detector background, but obtained approximately the same upper limit.
4 Discussion
4.1 Neutron star or white dwarf?
First of all, we should understand whether the observed FUV spectrum is emitted by the WD companion or by the NS. The results of the optical photometry (Danziger et al. 1993; Bailyn 1993) yield –4500 K for the WD. The dashed line in Figure 2 shows a blackbody spectrum (for K, , pc) that crudely fits the photometric data and clearly falls well below the FUV data points. More accurate comparison should use cool WD atmosphere spectra (e.g., Bergeron et al. 1995; Hansen 1999), which can be harder than the blackbody at UV frequencies. We have applied a number of such models (provided by P. Bergeron 2003, private communication) for various chemical compositions, effective temperatures and gravitational accelerations, scaling them to fit the optical data, and found that the observed FUV flux exceeds the WD atmosphere model predictions by several orders of magnitude in all the cases. Thus, we conclude that the observed FUV emission originates from the NS.
4.2 Thermal origin of the FUV spectrum
We fit the spectrum with the absorbed power-law model, , where the ultraviolet extinction curve is adopted from Seaton (1979). The (low) interstellar extinction in the direction of J0437 is poorly known; different authors use the color excess values from (Bell et al. 1993) to 0.07 (Danziger et al. 1993). We performed the fits for three values, , 0.03, and 0.07, and found the power-law indices , , and , and the normalizations , , and erg cm-2 s-1 Å-1, respectively (see Fig. 5). The inferred slope (albeit rather uncertain because of the strong detector background) is close to that of the Rayleigh-Jeans spectrum, . It indicates that, most likely, the observed radiation is thermal radiation from the NS surface rather than magnetospheric radiation. At pc, the normalization parameter of the Rayleigh-Jeans fit corresponds to the brightness temperature K, where , is the radius of the emitting sphere in units of 13 km. (Here and below, the temperature and the radius are given as measured by a distant observer.) Our fits (with fixed ) give , , and , for , 0.03, and 0.07, respectively.
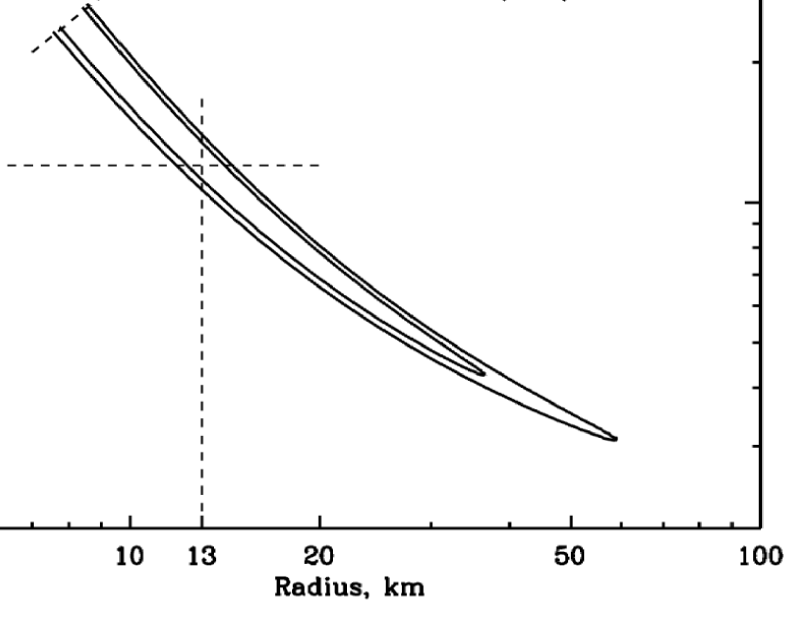
At K the blackbody spectrum deviates appreciably from the Rayleigh-Jeans limit in the FUV range. To investigate the range of lower temperatures, we also fit the absorbed blackbody model to the observed spectrum. The confidence contours in the - plane (Fig. 6) show that the lower limit on the surface temperature is K, corresponding to a radius of 37 km, at a 68% confidence level ( K and 59 km at a 90% level). For a typical NS radius km, the inferred surface temperature is , , and MK, for , 0.03, and 0.07, respectively. The corresponding bolometric luminosity can be estimated as erg s-1; for instance, erg s-1 for , km.
Because of the large uncertainties of the FUV data points, deviations of the source spectrum from the Rayleigh-Jeans limit cannot be established from the FUV data alone. Therefore, to infer the upper limit on (lower limit on ), we have to use the X-ray data. For the single-temperature blackbody model, we find that should be lower than MK ( km), for , in order not to exceed the observed soft X-ray spectral flux (see Fig. 7). It is clear from Figure 7 that the FUV and X-ray data cannot be described by a single-temperature model. Based on the X-ray observations, Zavlin et al. (2002) suggested a two-temperature model: MK, km; MK, km, where the “core” and the “rim” correspond to central and peripheral parts of the pulsar’s polar caps. We see from Figure 7 that extension of this model to the FUV range underestimates the observed FUV spectral flux. Most probably, this means that the NS surface temperature is a function of the polar angle, such that it decreases from MK at the magnetic poles to MK at the bulk of the surface. Of course, the estimates for the brightness temperature above do not imply a uniform surface temperature away from the polar caps. To determine the dependence of the surface temperature on magnetic colatitude, phase-resolved spectroscopy is required.
4.3 Internal heating
The inferred surface temperature, K, is much higher than the temperatures K expected for a passively cooling few-Gyr-old neutron star (e.g., Tsuruta 1998; Schaab et al. 1999 [S99 hereafter]). Therefore, it requires a heating mechanism to operate in J0437. If the sources of heat are in the highly conductive (hence almost isothermal) NS interiors, the surface temperature of 0.1 MK implies the interior temperature of order 1 MK (Gudmundsson, Pethick, & Epstein 1983). Various mechanisms of internal NS heating were investigated in a number of works (e.g., S99, and reference therein). The mechanisms relevant to MSP heating can be divided into two groups. Firstly, heat can be produced by the dissipation of energy of differential rotation caused by frictional interaction between the faster rotating superfluid core and the slower rotating outer solid crust (Shibazaki & Lamb 1989; Larson & Link 1999, and references therein). The heating mechanisms from the second group are associated with readjustment of the NS structure to a new equilibrium state as star rotation slows down. If the NS crust is solid, it will undergo cracking when the tension force exceeds a critical value, and the crust strain energy will be released as heat (Cheng et al. 1992). In addition, as the star spins down, the centrifugal force decreases and central density increases causing the shift in chemical equilibrium, which modifies the rate of nuclear reactions and may lead to heat release (Reisenegger 1995).
The high surface temperature of J0437 strongly constrains heating mechanisms. For instance, such a temperature rules out crust cracking and chemical heating of the crust as the main heat sources (cf. Fig. 7 of S99). Chemical heating of the core and frictional heating remain viable mechanisms. For the latter, one can constrain the excess angular momentum , residing in the superfluid, and the angular velocity lag , between the superfluid and the crust, averaged over superfluid moment of inertia. Using equation (9) of Larson & Link (1999), we obtain erg s, rad s-1, where rad s-2 is the time derivative of the angular frequency of the pulsar, g cm2 is the moment of inertia of the differentially rotating portion of the superfluid, estimated for the Friedman & Pandharipande (1981) equation of state. Because other mechanisms can contribute to heating of J0437, these estimates of and should be considered as upper limits.
4.4 External heating
In addition to the above-discussed internal sources, heat can be provided by relativistic particles created in the pulsar’s acceleration zones and bombarding the NS surface (e.g., Harding & Muslimov 2002, and references therein). The energy of these particles is released in polar caps at the NS magnetic poles, with a radius km. Moreover, inward-directed radiation from this particle population or even precipitating secondary particles created in the closed field line zone can heat the surface outside of the traditional polar caps (Wang et al. 1998). The energy dissipated in the NS polar regions per unit time (heating luminosity) depends on the geometry of the acceleration region and the degree of electric field screening. The numerical calculations, carried out by Harding & Muslimov (2002) for the case of MSPs, give heating rates somewhat lower than (but close to) the bolometric luminosity inferred from the X-ray observations of J0437, erg s-1 (Zavlin et al. 2002). A major fraction of the thermal energy deposited by the relativistic particles propagates towards the surface and is radiated in soft X-rays from the polar cap(s). However, some energy flows inwards, heating deeper NS layers beneath a larger surface area. If a fraction of this energy reaches the inner crust, it spreads over the whole interior of the NS because of its very high thermal conductivity, so eventually it will be radiated from the entire NS surface, together with the heat supplied by possible internal heating mechanisms. The effect of the external heating on the temperature distribution in an NS requires numerical solution of a complicated problem of heat transport, with allowance for radiation from the surface. This problem has not been solved, to the best of our knowledge, so it is hard to assess the contribution of the polar cap heating to the observed FUV radiation. We can only state that if the external heating dominates, then a fraction –0.5 of the energy deposited at the polar cap goes to heating of the NS. Crude estimates show, however, that such a large fraction of heat flowing inwards would require thermal conductivities much higher than calculated for the NS crust (e.g., Jones 1978), suggesting that particle precipitation only on the open field line zone cannot account for general surface heating of old NSs.
In principle, a very old NS could be heated by exotic particles (or products of their decay) captured in the NS matter. For instance, Hannestad, Keränen, & Sannino (2002) consider NS heating by products of decay of Kaluza-Klein majorons and gravitions, that form a halo around the NS, and conclude that the thermal luminosity of an old NS should reach a constant level corresponding to the energy deposited by decay particles. (See Pavlov, Stringfellow, & Córdova 1996 for references to earlier papers.) Although the Occam razor suggests that less exotic mechanisms should be explored first, the possibility to indirectly investigate exotic particles through thermal radiation from MSPs cannot be dismissed at the present stage.
4.5 Are millisecond pulsars hotter than ordinary old neutron stars?
It is interesting to compare the inferred surface temperature of J0437 with the temperatures (or upper limits) for other old pulsars, including MSPs. We compiled the results of the available UV-optical observations of old ( Myr), nearby ( pc) NSs in Table 2 and re-estimated the temperatures using the most recent results on the distances. In addition to the old pulsars, we included the famous “dim” isolated NS, RX J1856.53754, whose age is unknown, because it might be an MSP (Pavlov & Zavlin 2003). We see from Table 2 that the temperature of J0437 is the lowest measured temperature for a NS. The observations of the other two nearby MSPs, J21243358 and J0030+0451, were not nearly as deep as required to detect their thermal radiation at a similar temperature. All the upper limits on in Table 2 are also above the temperature of J0437 with one exception — for PSR J01081431, whose spin-down age is a factor of 30 smaller than that of J0437111Although the true age of a pulsar may differ substantially from its spin-down age, the low temperature of the WD companion implies (e.g., Hansen & Phinney 1998) that J0437 is older than 3 Gyr, that is a factor of 18 larger than the spin-down age of PSR J01081431.. Although the difference in the temperatures is not very large, it should be noted that the upper limit in Table 2 (see also Mignani et al. 2003b) is rather conservative, in the sense that it is obtained assuming pc, the largest among the distances, 60–200 pc, estimated from various models of Galactic electron distribution (Tauris et al. 1994; Taylor & Cordes 1993; Cordes & Lazio 2002). For instance, the limit is for pc (Mignani et al. 2003a). Even if the true distance is somewhat larger than 200 pc, the upper limit remains surprisingly low, given the much younger spin-down age of J01081431.
The higher temperature of the older J0437 cannot be attributed to accretion in the binary system because the accretion ceased about 3 Gyrs ago, while the time for a NS to cool to K, losing the accretion-generated heat, is Myr. The high temperature can possibly be explained by stronger frictional heating, consistent with a factor of 15 larger . It is also possible that “rotochemical heating” of the NS core (Reisenegger 1995,1997) has been turned on in this MSP, or J0437 is simply sufficiently old to accumulate enough heat by capturing exotic particles (see §4.4). Finally, the higher temperature of J0437 might be associated with stronger magnetospheric heating, since its is about 700 times larger than that of J01081431. In this case one should expect MSPs with higher (up to 3 orders of magnitude in most powerful MSPs, such as PSR B182124) to be even hotter than J0437, but it would be difficult to discern their surface emission since these pulsars are also strong sources of magnetospheric radiation.
Whatever is the reason of the higher temperature of J0437, it is tempting to assume that the surface temperatures of MSPs are generally higher than those of old “ordinary” pulsars of similar or even younger ages. Since ordinary isolated NSs cool down with age even in the presence of internal heating (Tsuruta 1998; S99), this assumption implies that the transition from ordinary pulsars to MSPs is accompanied by a considerable growth of NS temperature. Moreover, the temperature is maintained high in the course of the Gyr-long MSP thermal evolution by a heating process, probably associated with specific properties of MSPs, such as fast rotation or old age. To understand the apparently “nonmonotonous” thermal evolution of old NSs, thermal emission from a larger sample of these objects should be investigated.
4.6 Possible spectral line at 1372 Å
Although the detection of the emission line at 1372 Å ( eV) is marginal, it is interesting to speculate as to about its origin. Firstly, this could be an electron cyclotron line (e.g., formed in a corona above the polar cap) in the magnetic field G, where is the gravitational redshift. Such a field is close to the “conventional” magnetic field, G, at the magnetic poles of an NS losing energy via magnetodipole radiation ( cm and g cm2 are the NS radius and moment of inertia, is the angle between the magnetic and rotational axes). The main difficulty with this interpretation is the small width of the observed line, Å. First, it implies a very uniform field in (hence, a small size of) the emitting region, . For instance, if the emitting region is a hot spot at the magnetic pole, its size should be smaller than km. Second, the thermal (Doppler) width of the cyclotron line is Å, where is the angle between the line of sight and the direction of the magnetic field. For the thermal width to be smaller than , a phase-averaged must be ( for ), which is hard to reconcile with the constraints on the rotation and magnetic inclinations obtained from the radio polarimetry (e.g., Manchester & Johnston 1995).
Alternatively, if the NS surface is covered with a hydrogen atmosphere with overheated outer layers (e.g., due to convection), the observed line may be one of the three gravitationally redshifted Zeeman components of the Ly line in a magnetic field – G. For instance, at G, the wavelengths of the Zeeman components at the NS surface are 730, 1069, and 1334 Å (Ruder et al. 1994). If the observed line is the redshifted -component, the redshift is , so the wavelengths of the redshifted -components, 937 and 1712 Å, are outside of the observed FUV range. The thermal width of the Zeeman component, Å, is much smaller than the observed width. The line broadening can be caused by a magnetic field nonuniformity: Å corresponds to (estimated from Fig. A.2.1 of Ruder et al. 1994), that is the putative corona may spread over a substantial fraction of the NS surface. The luminosity in the line, erg s-1, is a small fraction, , of the observed FUV luminosity. If the emitting region is in collisional (coronal) equilibrium, the corresponding emission measure is – cm-3 for –1 MK. If the 1372 Å line is confirmed in a future FUV observation, the most convincing confirmation of the Ly interpretaion would be detection of another Zeeman component (e.g., the -component in the NUV range), which would allow one to measure both the magnetic field and the gravitational redshift.
4.7 Magnetospheric component
Zavlin et al. (2002) found that, in addition to the two-temperature thermal component, a power-law component with a photon index is needed to fit the X-ray spectrum at energies above 2 keV (Fig. 7). However, extension of this component with the best-fit to the FUV range is well above the observed FUV spectrum, and even for the extension is only marginally consistent with the FUV data (Fig. 7). We can crudely estimate the upper limit on the magnetospheric luminosity is the FUV range as erg s-1. The apparent discrepancy can be explained assuming that the spectrum of the magnetospheric radiation breaks down when the frequency decreases from X-rays to the FUV range. The optical upper limits for MSPs J0030+0451 (Koptsevich et al. 2003) and J21243358 (Mignani & Becker 2003), well below the extensions of their X-ray power-law components, suggest that it might be a common property of MSPs, contrary to, e.g, ordinary middle-aged pulsars. Alternatively, as Zavlin et al. (2002) noticed, it is possible that the excess counts at higher energies in MSP spectra might be interpreted as thermal radiation from a very hot, small area within the polar cap (e.g., –15 MK, –2 m for J0437). To understand which of the two interpretations is correct, deeper observations of J0437 in hard X-rays are required.
5 Summary and conclusions
The STIS/FUV-MAMA observation of J0437 provided first firm detection of an MSP in the optical-UV range. The FUV spectrum is best interpreted as thermal emission from the NS surface with a temperature of about 0.1 MK. This temperature exceeds the upper limit on the temperature of the younger, but less luminous, ordinary pulsar J0108–1431. This is likely associated with a difference in spindown-driven heating. If magnetospheric heating plays a role, it must be effectively communicated, perhaps by radiation or secondary particles, to the bulk of the NS surface. Evolutionary differences between ordinary pulsars and MSPs might plausibly affect the internal thermal history. To understand thermal evolution of old NSs, more MSPs and ordinary old pulsars should be observed in the optical-UV range.
Comparison of the FUV and X-ray spectra shows that the temperature is not uniformly distributed over the NS surface. The X-ray observations, sensitive to higher temperatures, show a smaller size of the emitting region, naturally interpreted as a pulsar polar cap, perhaps also with a nonuniform temperature. To understand the temperature distribution over the NS surface, phase-resolved spectroscopy in both X-rays and FUV is needed. We failed to detect FUV pulsations because the source was placed at a region of high detector background. An FUV observation of J0437 with an optimal positioning on the detector could detect pulsations (or put a stringent limit on the pulsed fraction) and provide information on the temperature distribution.
The FUV upper limit on the nonthermal (magnetospheric) component, observed in hard X-rays, suggests a spectral turnover of this component at EUV wavelengths, which can be a generic property of MSPs. However, the upper limit is not very strong because of large errors associated with the high detector background. To tightly constrain the nonthermal component, another FUV-MAMA observation with improved S/N as well as deep NUV and X-ray exposures are required.
The marginally detected emission line at 1372 Å can be interpreted as an electron cyclotron line or, more likely, a Zeeman component of the Hydrogen Ly line in a magnetic field of G. Confirming this line would be of profound importance as it provides an opportunity to directly measure the MSP magnetic field and gravitational redshift (if another Zeeman component is also detected).
References
- (1) Arons, J. 1981, ApJ, 248, 1099
- (2) Becker, W., & Aschenbach, B. 2002, Proc. 270 WE-Heraeus Seminar on Neutron Stars, Pulsars and Supernova Remnants, eds. W. Becker, H. Lesch, & J. Trümper, MPE-Report 278, 64 (astro-ph/0208466)
- (3) Becker, W., Pavlov, G. G. 2001, in The Century of Space Science, eds. J. A. M. Bleeker, J. Geiss, & M. C. E. Huber (Dordrecht: Kluwer) 721 (astro-ph/0208356)
- (4) Brazier, K. T. S. 1994, MNRAS, 268, 709
- (5) Bell, J. F., Bailes, M., & Bessell, M. S. 1993, Nature, 364, 603
- (6) Bergeron, P., Saumon, D., & Wesemael, F. 1995, ApJ, 443, 76
- (7) Braje, T. M., & Romani, R. W. 2002, ApJ, 580, 1043
- (8) Brisken, W. F., Benson, J. M., Goss, W. M., & Thorsett, S. E. 2002, ApJ, 571, 906
- (9) Buccheri, R., et al. 1983, A&A, 128, 245
- (10) Cheng, K. S., Chau, W. Y., Zhang, J. L., & Chau, H. F. 1992, ApJ, 396, 135
- (11) Cordes, J. M., & Lazio, T. J. W. 2002, astro-ph/0207156
- (12) Danziger, I. J., Baade, D., & della Valle, M. 1993, A&A, 276, 382
- (13) Friedman, B., & Pandharipande, V. R. 1981, Nucl. Phys. A., 361, 502
- (14) Gregory, P. C., & Loredo, T. J. 1996, ApJ, 473, 1059
- (15) Gudmundsson, E. H., Pethick, C. J., & Epstein, R. I. 1983, ApJ, 272, 286
- (16) Hannestad, S., Keränen, P., & Sannino, F. 2002, Phys. Rev. D 66, 045002
- (17) Hansen, B. M. S. 1999, ApJ, 520, 680
- (18) Hansen, B. M. S., & Phinney, E. S. 1998, MNRAS, 294, 557
- (19) Harding, A. K., & Muslimov, A. G. 2002, ApJ, 568, 862
- (20) Jones, P. B. 1978, MNRAS, 184, 807
- (21) Koptsevich, A. B., Lundqvist, P., Serafimovich, N. I., Shibanov, Yu. A., & Sollerman, J. 2003, A&A, 400, 265
- (22) Landsman, W. 1998, Characteristics of the FUV-MAMA Dark Rate, STIS IDT report
- (23) Larson, M. B., & Link, B. 1999, ApJ, 521, 271
- (24) Manchester, R. N., & Johnston, S. 1995, ApJ, 441, L65
- (25) Mignani, R. P., De Luca, A., Caraveo, P. A., & Becker, W. 2002, ApJ, 580, 147
- (26) Mignani, R. P., & Becker, W. 2003, A&A submitted, astro-ph/0301114
- (27) Mignani, R. P., Manchester, R. N., & Pavlov, G. G. 2003a, ApJ, 582, 978
- (28) Mignani, R. P., Pavlov, G. G., De Luca, A., & Caraveo, P. A. 2003b, ASpR, submitted (astro-ph/0301253)
- (29) Pavlov, G. G., Stringfellow, G. S., & Córdova, F. A. 1996, ApJ, 467, 370
- (30) Pavlov, G. G., Zavlin, V. E., & Sanwal, D. 2002, Proc. 270 WE-Heraeus Seminar on Neutron Stars, Pulsars and Supernova Remnants, eds. W. Becker, H. Lesch, & J. Trümper, MPE-Report 278, 273 (astro-ph/0206024)
- (31) Pavlov, G. G., & Zavlin, V. E. 2003, Proc. XXI Texas Symposium on Relativistic Astrophysics, eds. R. Bandiera (World Scientific), in press (astro-ph/0305435)
- (32) Pons, J. A., Walter, F. M., Lattimer, J. M., Prakash, M., Neuhäuser, R., & An, P. 2002, ApJ, 564, 981
- (33) Protheroe, R. J. 1987, in Proc. Astron. Soc. Australia, vol. 7, no. 2, 167
- (34) Reisenegger, A. 1995, ApJ, 442, 749
- (35) Reisenegger, A. 1997, ApJ, 485, 313
- (36) Ruder, H., Wunner, G., Herold, H., & Geyer, F. 1994, Atoms in Strong Magnetic Fields (Berlin: Springer)
- (37) Ruderman, M. A., & Sutherland, P. G. 1975, ApJ, 196, 51
- (38) Seaton, M. J. 1979, MNRAS, 187, 73
- (39) Schaab, Ch., Sedrakian, A., Weber, F., & Weigel, M. K. 1999, A&A, 346, 465
- (40) Shibazaki, N., & Lamb, F. K. 1989, ApJ, 346, 808
- (41) Tauris, T. M., et al. 1994, ApJ, 428, L53
- (42) Taylor, J. H., & Weisberg, J. M. 1989, ApJ, 345, 434
- (43) Taylor, J. H. & Cordes, J. M. 1993, ApJ, 411, 674
- (44) Tsuruta, S. 1998, Phys. Rep., 292, 1
- (45) van Straten, W., Bailes, M., Britton, M., Kulkarni, S. R., Anderson, S. B., Manchester, R. N., & Sarkissian, J. 2001, Nature, 421, 158
- (46) Vaughan, B. A., et al. 1994, ApJ, 435, 362
- (47) Walter, F. M., & Lattimer, J. M. 2002, ApJ, 576, L145
- (48) Wang, F. Y.-H., Ruderman, M., Halpern, J. P., & Zhu, T. 1998, ApJ, 498, 373
- (49) Zavlin, V. E., & Pavlov, G. G. 1998, A&A, 329, 583
- (50) Zavlin, V. E., Pavlov G. G., Sanwal, D., Manchester, R. N., Trümper, J., Halpern, J. P., & Becker, W. 2002, ApJ, 569, 894


| -bin | aaNumber of background counts scaled to the 5 pixel extraction box. | S/N | bbObserved average spectral flux, in units of erg s-1 cm-2 Å-1, corrected for the finite aperture. | |||||
|---|---|---|---|---|---|---|---|---|
| (Å) | ||||||||
| 1155-1187 | 367 | 313 | 9.3 | 6.2 | 54.3 | 21.3 | 2.5 | |
| 1248-1283 | 615 | 465 | 15.0 | 7.6 | 149.3 | 28.0 | 5.1 | |
| 1316-1376 | 816 | 609 | 22.6 | 8.7 | 206.7 | 36.5 | 5.8 | |
| 1400-1702 | 1369 | 1078 | 25.1 | 11.6 | 290.6 | 44.7 | 6.5 | |
| SummedccValues for summed -bins. | 3167 | 2466 | 38.2 | 17.5 | 700.8 | 68.0 | 10.3 |
| NS | aaBlackbody (brightness) temperature from optical/UV observations, for an NS radius of 13 km and quoted distance and color index. | DistancebbDistances estimated from parallaxes (with uncertainties; see Brisken et al. 2002; Walter & Lattimer 2002; van Straten et al. 2001) or from the dispersion measure (Cordes & Lazio 2002). | AgeccCharacteristic age of pulsars, . | ddObserved spectral flux (or upper limit), in units of Jy, at the wavelength quoted in the next column. | eeReference wavelength. | ffAdopted color index. | Ref.ggReferences for the spectral flux measurements.–(1) Mignani et al. 2002; (2) Pavlov et al. 1996; (3) Mignani et al. 2003b; (4) Pons et al. 2002; (5) this work; (6) Mignani & Becker 2003; (7) Koptsevich et al. 2003. |
|---|---|---|---|---|---|---|---|
| ( K) | (pc) | (Myr) | ( cgs) | (m) | |||
| B1929+10 | 3.2 | 5.4 | 0.24 | 0.10 | 1 | ||
| B0950+08 | 16 | 5.1 | 0.31 | 0.01 | 2 | ||
| J01081431 | 200 | 170 | 0.49 | 0.01 | 3 | ||
| J18563754 | 5.6hhLower temperatures, , corresponding to km, are required in a two-component blackbody model (Pavlov et al. 2002; Braje & Romani 2002). | ? | 240 | 0.15 | 0.03 | 4 | |
| J04374715 | 1.2 | 4900 | 20 | 0.15 | 0.03 | 5 | |
| J21243358 | 270 | 7200 | 0.49 | 0.05 | 6 | ||
| J0030+0451 | 320 | 7700 | 0.49 | 0.05 | 7 |