Proper Motion Catalog From SDSS USNO-B
Abstract
We present a catalog of 345,000 stars with proper motions and magnitudes , drawn from the intersection of the SDSS Data Release One and USNO-B. We first use SDSS quasars to correct the proper motions in each of the two source catalogs, finding that these corrections for systematics are comparable to the statistical errors. The combined proper motions have errors of , significantly better than any previous catalog at these magnitudes. While cross-correlating SDSS and USNO-B removes the vast majority of the very large number of spurious proper-motion stars in each, some contamination remains, especially at faint magnitudes, , and high proper motions. We present a diagrammatic method to estimate the level of contamination in selected subsets of the catalog, which should be useful for choosing appropriate selection criteria for various applications.
1 Introduction
Combining stellar proper motions with photometry has long been an efficient method to select otherwise elusive populations of stars. Proper motion surveys can be broadly divided into two classes: those that cover a large fraction of the sky and those that cover small areas but have faint limiting magnitudes.
All-sky surveys generally trade magnitude limits for proper motion precision or threshold. For example, the combined Hipparcos (ESA, 1997) and Tycho 2 (Høg et al., 2000) catalogs provide proper motions accurate to for essentially all stars with . The nearly completed USNO CCD Astrograph Catalogs (UCAC1,2) (Zacharias et al., 2000, 2001) have between and depending on magnitude for . The New Luyten Two Tenths (NLTT) Catalog (Luyten, 1979, 1980; Luyten & Hughes, 1980) is reasonably complete to over most of the sky, but at the price of being restricted to high proper-motion stars (). Moreover, at (Salim & Gould, 2003), its accuracy is substantially worse than catalogs at brighter magnitudes. However, the revised NLTT (rNLTT) improves this precision to for 44% of the sky (Gould & Salim, 2003; Salim & Gould, 2003). Most recently, Monet et al. (2003) have analyzed 4 decades of photographic plates to produce the monumental USNO-B, an all-sky proper-motion catalog with typical for all stars (no proper-motion threshold) down to . However, while this catalog is complete for high proper motion stars (), about of its entries in this regime are spurious (Gould, 2003c), so it cannot be directly accessed as a source of high proper motion stars.
Due to the relatively bright magnitude limits of these all sky surveys (other than USNO-B), other groups have been motivated to do smaller-area, deeper studies, focusing instead on a particular proper-motion or magnitude limit as opposed to all-sky coverage. The SuperCOSMOS catalog (Hambly et al., 2001a, b), covering a 5000 square degree patch of the southern Galactic cap, obtains proper motion measurements with at , and at . Fainter still, is the Calán-ESO proper motion catalog (Ruiz et al., 2001), which contains stars with to in a square degree field in the south. Also in the south is the Wroblewski & Costa (2001) survey of 147 stars with () over a 25 square degree field down to . Using the Digitized Sky Survey (DSS), Lépine, Shara, & Rich (2003) find proper motions for stars between accurate to with covering over of the northern sky.
Finally, several proper motion catalogs have been produced as byproducts of searches for halo dark matter and therefore have wholly different selection functions than the surveys mentioned above. The EROS 2 HPM catalog (Goldman et al., 1999) selects stars from 413 square degrees at high Galactic latitude to and with an accuracy of . The MACHO survey provided a catalog of 154 high proper-motion () stars from a total of 50 square degrees in fields towards the Galactic bulge and the LMC with an accuracy of . The Optical Gravitational Lensing Experiment (OGLE II) catalog (Sumi et al., 2003) yielded proper motions for 5,078,188 stars with and accuracy from a total imaging area of 11 square degrees towards the Galactic bulge.
These catalogs have fueled many different veins of study. Searches for a variety of distinct stellar populations including nearby stars (Reid, Liebert, & Schmidt, 2001; Jahreiss et al., 2001; Scholz, Meusinger, & Jahreiss, 2001; Gizis & Reid, 1997; Henry, et al., 1997), subdwarfs (Gizis & Reid, 1997; Ryan, 1992; Digby et al., 2003), white dwarfs (Reid, Sahu, & Hawley, 2001; Schmidt et al., 1999; Liebert et al., 1979; Jones, 1972; Luyten, 1970, 1977), brown and L dwarfs (Goldman et al., 1999), halo stars (Gould, 2003a), and wide binaries (Chaname & Gould, 2004) are all most effectively carried out using proper motion catalogs such as those described above. Proper motion catalogs have also been useful as a way to select candidates for future microlensing events detectable with next generation surveys (Salim & Gould, 2000) such as the Space Interferometry Mission as well as candidates for planetary transit searches (Gould & Morgan, 2003). Searches for dark matter in the halo in the form of white dwarfs (Oppenheimer et al., 2001; Reid, Sahu, & Hawley, 2001) and MACHOs (Yoo et al., 2004) have also benefited from proper motion catalogs. Finally, the structure of the stellar halo including the velocity ellipsoid parameters (Gould, 2003a) and the granularity of the stellar halo (Gould, 2003b) have both been made possible by the large samples of halo stars culled from high proper-motion catalogs.
In this paper, we construct a new proper-motion catalog by combining data from the Data Release One (DR 1) of the Sloan Digital Sky Survey (SDSS, http://www.sdss.org) and USNO-B1.0 (Monet et al., 2003). SDSS contains photometry and proper motions for stars over several disjoint areas at high Galactic latitude totaling several thousand square degrees. SDSS assigns proper motions to most of these stars by identifying each with the nearest entry in USNO-A2.0 (Monet, 1998), a position catalog based on circa 1950 simultaneous blue and red photographic plates. Many of these proper motions are spurious, either because the SDSS star has no counterpart in USNO-A (and so is identified with an unrelated star) or because it has moved so far that the nearest USNO-A entry is not the true counterpart of this star. Moreover, these proper motions suffer systematic errors due to small but significant zonal biases in USNO-A. USNO-B also contains many spurious high proper-motion entries that arise from inadvertent association of unrelated stars that have moved significantly between plate epochs, and it also suffers from zonal errors.
Here we use the SDSS quasars to remove the zonal errors from each of these two source catalogs. Because the SDSS spectroscopic survey covers only about half the area of the photometric survey, our catalog is restricted to this smaller region in which the quasars are reliably identified. We then combine the two corrected proper-motion measurements to form the single best estimates of the proper motions, which have errors of .
The very process of cross-identifying SDSS and USNO-B eliminates most of the spurious entries in each. We develop a graphical technique to estimate the remaining contamination in various subsets of the catalog in order to assist in the formulation of selection procedures appropriate to various applications. Our final catalog contains 345,000 entries with proper motions and magnitudes .
Digby et al. (2003) were the first to carry out a cross-identification of SDSS with an independent proper-motion catalog, namely SuperCOSMOS. They did not attempt to combine the two proper-motion measurements, but rather used the SDSS proper motions as a cross check. They were mostly interested in combining SDSS photometry with their proper motions in order to produce a reduced proper motion diagram from which halo stars could be identified. They achieved a precision of and set their catalog threshold at .
In § 2 we describe our initial SDSS sample selection. In § 3 we develop our method for correcting SDSS and USNO-B proper motions using SDSS quasars, and we use these quasars to evaluate the error properties of both these catalogs as well as of our final adopted proper motions. In § 4 we describe the construction of the stellar proper-motion catalog, and in § 5 we develop visual techniques for understanding its statistical properties. We also present reduced proper motion diagrams. Finally, in § 6 we describe the electronic catalog.
2 SDSS Selection
We select stars and quasars from the SDSS DR1 using the online query tools provided by SDSS. (For technical references, see http://www.astro.psu.edu/users/dps/sdsstechrefs.html.) We select all quasars that have matches within to corresponding sources within the USNO-A catalog and that are spectroscopically confirmed quasars . For our star sample, we initially select all objects within DR1 that 1) are classified as stars by SDSS photometrically, 2) have proper motions (measured from USNO-A and SDSS) in the range , and 3) have magnitudes . We then supplement this with an additional query covering but restricted to .
3 Quasar-Based Calibration
We use the quasars for three related purposes. First, to remove the (position-dependent) astrometric biases in SDSS/USNO-A and USNO-B proper motions. Second, to measure the errors in these proper motions and the covariances among them. Third, as a benchmark of accurately identified objects against which we can compare the distributions of variously selected stellar subsamples in order to judge whether they are significantly contaminated by spurious objects. The quasars have two characteristics that permit them to perform these three functions. First, they are spectroscopically confirmed by SDSS. Second, they have known proper motions: namely zero.
3.1 Individual Catalog Analyses
We begin by correcting the SDSS proper motions by using neighboring quasars to measure the local proper-motion bias. We determine this bias by taking the weighted average of all other quasars,
| (1) |
where is the vector position of the th quasar and is a smoothing length. We find that putting deg minimizes the residual scatter. In addition to excluding the star that is being corrected from the sum, we also exclude all those with or , although this has only a very minor effect. We find that this correction improves the scatter in the quasars by
| (2) |
for the sample of 14,740 quasars.
We then apply the same procedure to USNO-B. Of course, we exclude all quasars that are not detected in USNO-B, but we also exclude those that are recorded as having proper-motion errors exceeding in either direction, as well as those with zero errors in both components. About 99% of these latter objects are listed as having exactly zero proper motion. Since, as we show below, the bias at the location of these quasars is decidedly non-zero, these entries must be catalog artifacts rather than highly precise measurements. These two cuts reduce the sample to 3543 quasars, with more than 90% of the reduction being the exclusion of the zero-error quasars. Finally, because the quasar sample is now fairly sparse, it is possible that some quasars do not have enough near neighbors to accurately measure their bias. We therefore exclude an additional 175 quasars with , leaving a sample of 3368. For these,
| (3) |
Thus, the local bias (and hence the improvement when this bias is removed) is substantially larger for USNO-B than for SDSS/USNO-A. When we measure the bias for the zero-error quasars, it is similar, thus motivating their above-stated exclusion from the analysis.
3.2 Joint Catalog Analysis
Since we will eventually measure proper motions for our stellar sample using both SDSS/USNO-A and USNO-B, it is important to understand the joint error properties of all four quantities being measured, which we group together as a vector ,
| (4) |
where , and similarly for the component. We first evaluate the covariances of the averaging over the 3368 quasars common to both samples,
| (5) |
Note that while one would usually write , in the present case the are known a priori to vanish. We find errors
| (6) |
and correlation coefficients,
| (7) |
Note that the SDSS scatter is slightly reduced compared to equation (2), indicating that the quasars accessible to USNO-B are somewhat better behaved than the full sample. Since we will also only be considering stars with entries in both catalogs, the numbers quoted in equation (6) are the directly relevant ones.
Equation (7) shows that the SDSS/USNO-A and USNO-B measurements are correlated at the 55% level. Presumably, this is due to the fact that the first Palomar Observatory Sky Survey (POSS I) underlies the first (circa 1950) epoch of both measurements. Also note that the correlations between the and components, while small, are statistically significant because the uncertainties in these quantities are . We therefore keep these cross terms in our calculations, which we describe in the appendix. However, while this mathematical analysis is straightforward, it is a bit dense. We therefore present a simplified treatment here that ignores these small terms and so is much more transparent while yielding almost exactly the same results
The internal error is estimated by determining how well the SDSS/USNO-A and USNO-B measurements agree with each other, while the external error is estimated by determining how well the combined proper-motion measurements agree with reality (i.e., that the proper motions are actually zero).
The internal error is characterized by,
| (8) |
where , where is the uncertainty in this quantity, and similarly for the component. Since the two measurements are correlated, the error in their difference is given by . Substituting the values given in equations (6) and (7) yields
| (9) |
That is, because the correlation coefficients between the SDSS/USNO-A and USNO-B measurements (eq. [7]) are so large, the errors in the differences of these measurements are only of order the errors in each measurement separately (rather than being multiplied by ).
The distribution of for the 3368 quasars is shown in the lower panel of Figure 1. The straight line is the prediction for Gaussian statistics, i.e., a of two degrees of freedom, which is an exponential distribution, . This line is not a fit: it has no free parameters. The figure shows that the internal errors are Gaussian distributed in the core, , and then deteriorate to a much flatter distribution in the wings, . This deterioration is not unexpected and is typical of many types of astronomical observations.
Next we evaluate the external errors. Let be the best estimate of given the two correlated measurements from SDSS and USNO-B, respectively. Let be the uncertainty in this quantity, and similarly for the component. Since the quasar proper motion is known to vanish, these “best estimates” are exactly equal to the error in the measurement. Hence, the external errors are characterized by,
| (10) |
For two correlated measurements and of the same quantity, the best combined estimate and its uncertainty are given by,
| (11) |
These equations can be derived using the formalism presented in the Appendix. However, it is easy enough to verify that they reduce to familiar results when either or . Substituting the values in equations (6) and (7), yields
| (12) |
So, just as the error in the difference of measurements is not substantially bigger than the separate errors, so the error in the combined measurement is not substantially smaller. Again this is because of the strong correlation between the SDSS/USNO-A and USNO-B proper-motion measurements.
The upper panel of Figure 1 shows the mean as a function of . In the inner core (), which accounts for about 70% of the sample, , i.e., its expected value. It grows beyond that, as one would expect, because if is high, then at least one of the measurements must be seriously in error, which should then corrupt the combined estimate. However, the rise unexpectedly seems to saturate at , so that the most discrepant measurements in SDSS/USNO-A must be significantly anti-correlated with the the most discrepant ones in USNO-B. Further insight is gained by considering the behavior of the external errors of each catalog measurement separately (still plotted as a function of the combined internal error). These show similar behavior, indicating that they are about equally responsible for the problem measurements. They also track the combined external error in the Gaussian part of the distribution (), but at higher the individual external errors continue to rise roughly linearly, while the external errors flatten. The deviation is pronounced only for , which encompasses only about 35 quasars. It will be interesting to see if this pattern is maintained when larger areas of the SDSS catalog are made available.
4 Stellar Proper Motion Catalog
4.1 Construction
It is now straightforward to construct the catalog. We begin with our full sample of stars selected from the SDSS catalog that satisfy and , but excluding faint (), high proper-motion () stars for reasons described below. We first correct these proper motions for bias in the same way that we did for the quasars. See equation (1). However, since the quasars require spectroscopic confirmation, and the SDSS spectrographic catalog covers a smaller section of the sky than the photometric catalog, there are many stars that are too far from any quasars to be reliably de-biased. Therefore, we accept stars only if . At this point, having obtained a better estimate of the proper motion, we further restrict the proper motion criterion to . These two selection procedures, primarily the first, reduce our sample by more than half to .
We then search for the remaining stars in USNO-B, using a search radius to allow for both catalog errors and the motion of the star between the SDSS epoch and the (2000) epoch of USNO-B. We increase this radius to for stars with . As we did for the quasars, we exclude all entries with zero errors in both components, with errors greater than in either component, or with . This reduces the catalog to just under .
Finally, we impose two additional cuts
| (13) |
As we describe in § 5, the great majority of detections with are spurious. This is the reason for the first cut. The proper motion threshold is set by demanding “” detections. If the statistics were Gaussian, this would imply a probability that a zero-proper-motion star could scatter into our sample. However, as shown by Figure 1, the tail of the error distribution is decidedly non-Gaussian, with roughly 1% of the quasars showing internal errors, . While the initial evidence is that this large tail of internal errors is not reflected in a similar tail of external errors (see § 3.2 and Fig. 1), we nevertheless proceed conservatively and set a relatively high threshold to minimize contamination.
The sky coverage of the catalog is shown in Figure 2. The lightly shaded areas indicate the coverage of the photometrically selected stars, while the darker areas are the regions of the catalog. The difference is mostly due to the smaller region covered by the spectroscopic catalog, but is also affected by the failure to recover most quasars in USNO-B.
5 Catalog Characterization
In order to gain insight into the properties of the catalog as a function of magnitude and proper motion, we compare in Figure 3 the internal error distribution of the quasars (open circles) to that of various subsets of the stars (filled circles). For example, the lowest track compares the quasars to the stars with and . The two distributions are essentially the same, which corroborates one’s expectation that the errors are the same and that there are not a large number of spurious entries in this subsample. This is to be compared with the middle track, which shows and . This sample has about an order of magnitude increase in the fraction of stars with large internal errors, . Hence, either there are a large number of spurious entries in this subset or the faint magnitudes induce unusually large proper-motion errors in one or both catalogs. Comparison of the first and fifth tracks shows that the problem cannot be entirely faint magnitudes. These tracks represent the same magnitude range , but very different proper-motion cuts, and , respectively. The higher proper-motion sample has a much higher rate of large internal errors. Thus, it is likely that spurious detections play a major role at faint magnitudes, and more so when the proper motion is also high.
It is well-known that both SDSS and USNO-B separately contain large numbers of spurious high proper-motion stars. For USNO-B, roughly 99% of the entries with are spurious (Gould, 2003c). Since SDSS is merely matching to the nearest USNO-A entry, spurious entries are bound to occur, especially when the star is too faint to be recovered by USNO-A. While the chance that spurious entries will coincide in both catalogs within our search radius is small in each individual case, there are literally of order trials.
The implication is that one must carefully select from the catalog in accordance with one’s goals and guided by Figure 3. If for example, one wants a very clean sample, one might accept only stars in each magnitude range up to the maximum to which the stars track the quasars. On the other hand, if one were looking for common proper motion companions to brighter stars, one might search up to , recognizing that additional confirmation would be required for any candidates thus detected.
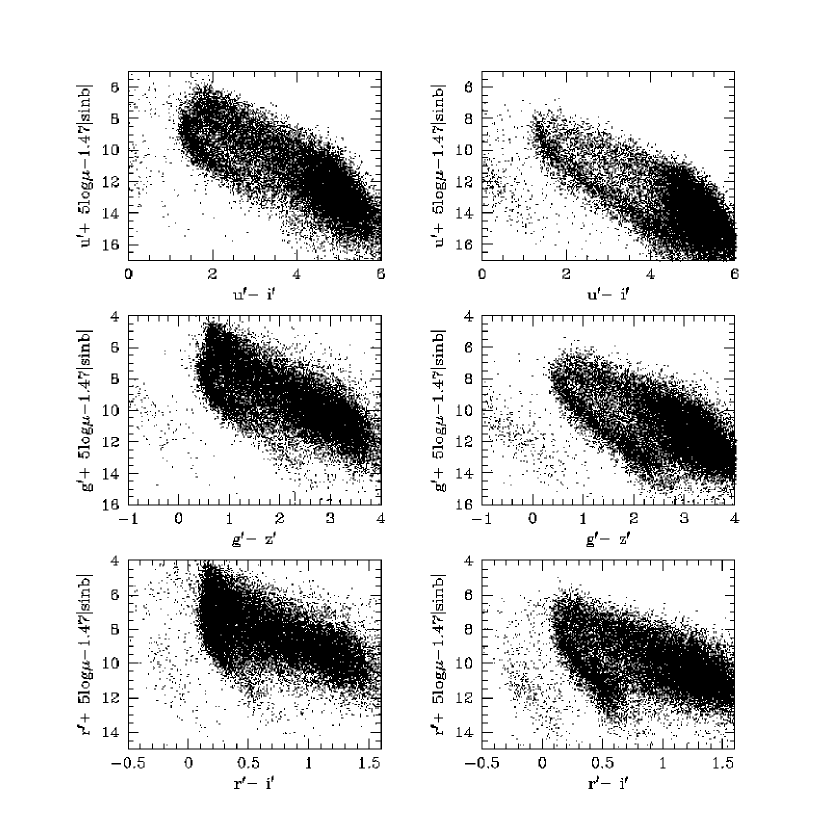
Figure 4 contains six reduced proper motion (RPM) diagrams. These have and thresholds for the left and right sides, respectively. All diagrams are restricted to . The ordinates in these diagrams are the adjusted RPMs, e.g.,
| (14) |
where is Galactic latitude. The first two terms are the standard RPM. These are related to the absolute magnitude by,
| (15) |
which causes an RPM diagram to simulate a color-magnitude diagram. Here is the transverse velocity and is the extinction. However, Salim & Gould (2003) showed that while RPM diagrams at different look similar, they are vertically offset from one another, . They therefore introduced , which has a -dependent term designed to compensate for this effect.
The figure illustrates the changing morphology of RPM diagrams with choice of color and proper-motion threshold. In the “high” threshold sample, the white dwarfs (lower left), red dwarfs (lower right), and subdwarfs (lower diagonal track) are all more pronounced. We have placed “high” in quotation marks because this sample has a lower proper-motion threshold than any previous RPM diagram at these magnitudes, except that of Digby et al. (2003) to which it is comparable. See in particular their figures 6 and 7. The low-threshold sample has a higher density of upper-main-sequence and turnoff stars. (The two sets of diagrams are drawn respectively from 9% and 60% of the catalog, so that they have a similar number of points, roughly 25,000.) Note also that in , the red subdwarfs tend to merge with the main-sequence red dwarfs, while in , the red ends of these tracks remain distinct.
6 Catalog Description
The first four columns of the catalog give the right ascension and declination of the star as reported in SDSS and USNO-B, respectively. Both are equinox 2000. USNO-B is also epoch 2000, while SDSS is at the epoch of the observations (which are circa 2000). Columns (5) and (6) give the east and north components of , the corrected SDSS proper motion as described by equations (1) and (4). Columns (7) and (8) give , the corrected USNO-B proper motion, while columns (9) and (10) give the weighted average of the two as described by equation (A5). Column (11) is the scalar proper motion, i.e., the root-sum-square of columns (9) and (10). Columns (12) through (16) give SDSS PSF photometry in , , , , and , while columns (17) and (18) give the blue and red magnitudes of the USNO-A star that SDSS has associated with this entry. Column (19) gives , the unadjusted band RPM (see eq. [15]), while column (20) gives the adjusted RPM, (see eq. [14]). Columns (21) and (22) give and , the total statistical weights of the quasars used in the local proper-motion correction. See equation (1). Finally, column (23) gives the internal-error indicator as described by equation (A3).
The fortran format statement for the catalog is (4f10.5,7f7.1,5f7.3,2f5.1,2f7.3,2f5.1,f7.2). The catalog can be found at http://www-astronomy.mps.ohio-state.edu/gould/SDSS-USNOB/cat.dat.gz
If the catalog is restricted to regions in which the stars track the quasars in Figure 3, then the errors can be expected to be similar to those of the quasars, namely in each direction.
Appendix A Covariant forms of and
In § 3.2, we evaluated and under the simplifying assumption (almost realized in practice) that the proper motion measurements in the and directions are not correlated. Here we present a more general treatment. The reader is referred to Gould & An (2002) or Gould (2003d) for the mathematical underpinnings of this appendix.
We first introduce the two-vector , defined by,
| (A1) |
where the constraint matrix is defined by and , and where we have introduced the Einstein summation convention. It is straightforward to show that the covariances of the are given by
| (A2) |
Hence, the internal errors are characterized by,
| (A3) |
Explicit evaluation of using equations (6) and (7),
| (A4) |
shows that it is almost exactly the same as given in the naive analysis of § 3.2.
Next we evaluate the external errors. The combined measurement of the proper motion is found by imposing the constraint , which yields best estimates for the parameters, ,
| (A5) |
and covariances,
| (A6) |
There are only two independent components of (one for each direction), and so is effectively a matrix. We therefore compress their representations,
| (A7) |
and evaluate
| (A8) |
Again, this is almost identical to the result obtained in the naive treatment. The external error is then characterized by,
| (A9) |
References
- Alcock et al. (2001) Alcock, C. et al. 2001, ApJ, 562, 337
- Chaname & Gould (2004) Chaname, J., & Gould, A. 2004, ApJin press, astro-ph/0307434
- Digby et al. (2003) Digby, A.P., Hambly, N.C., Cooke, J.A., Reid, I.N., & Cannon, R.D. 2003, MNRAS, 344, 583
- ESA (1997) European Space Agency (ESA). 1997, The Hipparcos and Tycho Catalogues (SP-1200; Noordwijk: ESA)
- Gizis & Reid (1997) Gizis, J. E. & Reid, I. N. 1997, PASP, 109, 849.
- Goldman et al. (1999) Goldman, B. and The EROS Collaboration 1999, A&A, 351, L5.
- Gould (2003a) Gould, A. 2003 ApJ, 583, 765
- Gould (2003b) Gould, A. 2003, ApJ, 592
- Gould (2003c) Gould, A. 2003, AJ, 126, 472
- Gould (2003d) Gould, A. 2003, preprint, astro-ph 0310577
- Gould & An (2002) Gould, A. & An, J. 2003, ApJ, 565, 1381
- Gould & Morgan (2003) Gould, A. & Morgan, C.W. 2003, ApJ, 585
- Gould & Salim (2003) Gould, A., & Salim, S., 2003, ApJ, 582, 1001
- Hambly et al. (2001a) Hambly, N. C. et al. 2001, MNRAS, 326, 1279
- Hambly et al. (2001b) Hambly, N.C., Davenhall, A.C., Irwin, M.J., & MacGillivray, H.T. 2001, MNRAS, 326, 1315
- Henry, et al. (1997) Henry, T.J., Ianna, P.A., Kirkpatrick, J.D., & Jahreiss, H. 1997, AJ, 114, 388
- Høg et al. (2000) Høg, E. et al. 2000, A&A, 355, L27
- Jahreiss et al. (2001) Jahreiss, H., Scholz, R., Meusinger, H., & Lehmann, I. 2001, A&A, 370, 967
- Jones (1972) Jones, E. M. 1972, ApJ, 177, 245
- Lépine, Shara, & Rich (2003) Lépine, S., Shara, M.M., & Rich, R.M. 2003, AJ, 126, 921
- Liebert et al. (1979) Liebert, J., Dahn, C.C., Gresham, M., & Strittmatter, P.A. 1979, ApJ, 233, 226
- Liebert, Dahn, & Monet (1988) Liebert, J., Dahn, C.C., & Monet, D.G. 1988, ApJ, 332, 891
- Luyten (1979, 1980) Luyten, W. J. 1979, 1980, New Luyten Catalogue of Stars with Proper Motions Larger than Two Tenths of an Arcsecond (Minneapolis: University of Minnesota Press)
- Luyten & Hughes (1980) Luyten, W. J. & Hughes, H. S. 1980, Proper Motion Survey wit h the Forty-Eight Inch Schmidt Telescope. LV. First Supplement to the NLTT Catalogue (Minneapolis: University of Minnesota)
- Luyten (1970, 1977) Luyten, W. J. 1970, 1977, Luyten’s White Dwarf Catalogues (Univ. of Minnesota, Minneapolis)
- Luyten (1979) Luyten, W. J. 1979, LHS Catalogue: a catalogue of stars with proper motions exceeding annually (Minneapolis: University of Minnesota Press)
- Monet (1998) Monet, D. G. 1998, American Astronomical Society Meeting, 193, 112003
- Monet et al. (2003) Monet et al. 2003, AJ, 125, 984
- Oppenheimer et al. (2001) Oppenheimer, B.R., Hambly, N.C., Digby, A.P., Hodgkin, S.T., & Saumon, D. 2001, Science, 292, 698
- Reid & Cruz (2002) Reid, I.N. & Cruz, K.L. 2002, AJ, 123, 2806
- Reid, Liebert, & Schmidt (2001) Reid, I. N., Liebert, J., & Schmidt, G.D. 2001, ApJ, 550, L61
- Reid, Sahu, & Hawley (2001) Reid, I.N., Sahu, K.C., & Hawley, S.L. 2001, ApJ, 559, 942
- Ruiz et al. (2001) Ruiz, M. T., Wischnjewsky, M.,Rojo, P.M.,& Gonzalez, L.E., 2001 ApJS, 133, 119
- Ryan (1992) Ryan, S.G. 1992, AJ, 104, 1144
- Salim & Gould (2000) Salim, S. & Gould, A. 2000, ApJ, 539, 241
- Salim & Gould (2003) Salim, S., & Gould, A. 2003 ApJ, 582, 1011
- Schmidt et al. (1999) Schmidt, G. D., Liebert, J., Harris, H.C., Dahn, C.C., & Leggett, S.K. 1999, ApJ, 512, 916
- Scholz, Meusinger, & Jahreiss (2001) Scholz, R.-D., Meusinger, H., & Jahreiss, H. 2001, A&A, 374, L12
- Sumi et al. (2003) Sumi, T. et al., 2003, astro-ph/0305315
- Wroblewski & Costa (2001) Wroblewski, H. & Costa, E., 2001, A&A, 367, 725
- Yoo et al. (2004) Yoo, J., Chaname, J., Gould, A., 2004, ApJ, in press, astroph/0307437
- Zacharias et al. (2000) Zacharias, N. et al. 2000, AJ, 120, 2131.
- Zacharias et al. (2001) Zacharias, N., Zacharias, M.I., Urban, S.E., Rafferty, T.J.,. 2001, AAS, meeting #129.08, vol 33, p1495