Supernova Spectra
Abstract
In this paper are summarized the main advances of the last years in the field of SN spectra . The arguments against a monodimensional sequence for SNIa are discussed as well as the efforts to improve the temporal and spectral coverage of this kind of SNe, with the aim to understand the physics of the explosions for their use as cosmological distance indicators. Although variety is the main character of core–collapse SNe, we have been recently surprised by both exceptionally under– and over–energetic explosions. The main properties of these two extreme subclasses are here reviewed.
1 Introduction
Spectra provide most of the physical information on Supernovae. Their early analysis has shown a variety of forms and evolutions. Indeed the identification of different spectral lines reveals the presence of several different ions in the layers above the photosphere, suggesting the existence of various progenitors and explosion models. Spectra also allow us the direct determination of the physical conditions of the emitting regions, while the line profiles provide the kinematics.
Supernova spectra evolve rapidly: the effective temperature and expansion velocity decrease, and the spectral lines change. Indeed, because of the expansion, the photosphere recedes into the ejecta and different layers are progressively exposed. In this way the analysis of SN spectra taken at different epochs allows us, at least in principle, to make the tomography of the exploding stars and to reconstruct their entire structures. A major limitation is that spectral features in SN spectra are generally blended due to the large expansion velocities and the full information can be extracted only with the use of complex spectral modeling which try to deal in a consistent way the luminosity, abundances, stratification, temperature, velocity and time evolution.
In general, the light from SNe is travelling for several megaparsecs before reaching the observers thus contains information on the circumstellar, interstellar and intergalactic matter it has passed through. In principle, high resolution spectroscopy might allow us to determine the distribution and physical conditions of the intervening medium and, in turn, the total reddening and extinction suffered by the light.
Finally, in the recent years spectral observations on faint, distant of SNIa have provided sufficiently accurate redshifts which, once coupled with the photometry, have inspired a new vision of the Universe we are living in.
2 A spectral sequence for SNIa ?
SNIa explode in all types of galaxies, in ellipticals as well as in spirals, but in the latters are not closely associated with the spiral arms as other SN types. The spectra are characterized by lines of intermediate mass elements such as Ca, O, Si and S during the peak phase, and by the absence of H at any time. With age the contribution of the Fe lines increases and several months past maximum the spectra are dominated by [Fe II] and [Fe III] lines. The overall homogeneous spectroscopic and photometric behavior has led to a general consensus that they are associated with the thermonuclear explosions of white dwarfs bran95 .
During the last decade a new scenario for the SNIa has been progressively developed. In particular, a correlation between the peak luminosity and the shape of the early light curve was found, with brighter objects having a rate of decline slower than dimmer ones phil93 ; perl97 ; phil99 ; riess98 . An analogous spectroscopic sequence has been found nugent , according to which the absolute magnitude of SNIa and, in turn, the rate of decline, is correlated to (SiII), the ratio of the depths of two absorption features at 5800 and 6100 Å, usually attributed to Si II. Synthetic spectra modeling indicates that most of the spectral differences are caused by variations in the effective temperatures, likely due to different amounts of 56Ni produced in the explosions. The finding that fainter SNe show slow expansion velocities both at early branchvdb and later epochs tur91bg is consistent with such scenario.
In first approximation all SNIa can be accommodated into such one–parameter sequence which can be regarded as a sequence of explosion strengths. Within such scheme fit the bright, slowly declining SN 1991T, which did not exhibit Si II or Ca II absorption lines in the premaximum spectra but had a normal behavior starting one month after maximum, and the faint, intrinsically red and fast declining SN 1991bg, which showed a slow expansion velocities and a deep trough around 4200 Å produced by Ti II.
In the last years, however, new findings have challenged such a monoparametric sequence. Hatano et al. hata00 have shown that the (SiII) does not correlated with the photospheric velocity deduced from the Si II absorption, as one would expect, and propose the existence of two or more explosion mechanisms as possible explanation for the lack of correlation. Also, a recent reanalysis bene03 has shown that while the (SiII) vs. relation holds for , at smaller values it breaks down, thus questioning the correspondence between spectroscopic and photometric parameters.
A number of objects have now good sequences of spectra, some starting very early after the explosion, which make possible to study the temporal evolution of (SiII). It is found that before maximum (SiII) exhibits a dramatic evolution with opposite trends for various objects bene03 .
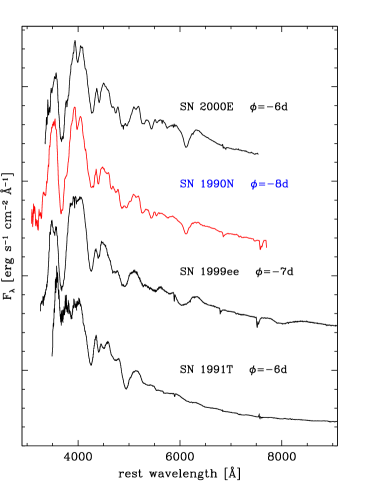
Moreover, objects with similar decline rates can show different spectral features, especially before maximum. In Figure 1 the spectra of four objects taken about one week before B maximum are compared. The spectrum of SN 2000E ( mag (100d)-1) shows noticeable differences with respect the two SNe at the bottom, having the same decline rates, but is very similar to that of SN 1990N (). Not only it differs from that of SN 1991T () which is well known for not displaying at this epoch the characteristic Si II line but shows disturbing differences with the normal SN 1999ee (). In particular, the profile of the Si II 6355 line is definitely broader in SN 1999ee indicating the presence of Si II at high velocity. Also the SiII 4130 line, which can be used for classifying high redshift SNe as type Ia, is nearly washed out. Note also that the analysis of the Ca II IR triplet of SN 1999ee before maximum (Mazzali priv. communication) requires high velocity material in analogy to what found for 2001el thomas03 .
Two other odd SNIa are 2000cx and 2002cx which do not fit into any photometric and spectroscopic sequence still showing the main characteristics of type Ia SNe li01a ; li03 .
3 Trends in SNIa spectroscopy
More and better data are required to clarify which parameters govern the SNIa explosions and to validate the proposed progenitor scenarios. To solve these questions large collaborations have born which have as immediate goal the intensive, multiwavelength monitoring of nearby SNIa.
Examples of such intensive monitoring are the studies of SNe 1999ee mario99ee and 2002bo bene03 , for which the rise to maximum has been sampled daily starting about two weeks before maximum. The analysis of these spectra has allowed the discovery of strong time evolutions of the ratio (SiII) with individual behaviors for each SNIa (cfr. Fig. 9 of Benetti et al. bene03 ), as mentioned above.
These two objects have been extensively monitored spectroscopically also in the infrared. The comparative analysis with the IR spectra of SN 1994D meikle96 at about day , +11.1 and +29.4 confirms that the overall spectroscopic homogeneity among normal SNe Ia extends to the IR-domain, with small variations. Spectral synthesis on the spectra of SN 2002bo favors the MgII identification for the 10800Å line and that of SiII 16910Å and MgII 16760/800 Å(with the SiII dominant) for the broad P-Cygni profile observed at 16000Å. On the contrary, major differences are visible when the comparison is made with peculiar objects, e.g. the faint SN 1999by hofl02 , especially because of the presence of strong C I and O I lines.
The optical and the IR spectra of SNIa mario99ee shows different behaviors: a) while the optical spectrum before maximum is dominated by strong P Cygni profiles of intermediate-mass elements, such as Ca II, Si II, Mg II, S II, the IR is characterized by a smooth, almost featureless continuum; b) the lines of iron group elements, such as Co II, Fe II and Ni II, emerge in the IR as soon as one week past maximum, definitely earlier than in the visual. This supports the suggestion spyro94 that the IR photosphere recedes rapidly to the center of the supernova, while at optical wavelengths the greater opacity arising from the higher spectral density of lines keeps the photosphere at higher velocities. At the longer wavelengths the overall emission increases after maximum light as a result of a shift in ionization to lower ionization species, which have greater emissivity in the near IR. It appears, therefore, that the J-band deficit is due to the relative absence of lines in the 12000 region, rather than increasing opacity, and that the secondary maxima exhibited by the IR light curves are due to the increasing release of energy through lower optical depth IR transitions. The prominent postmaximum emission features displayed by SNe 1999ee and 2002bo in the H and K bands lend support to this scenario mario99ee .
A new powerful tool for understanding the nature of SNIa is spectropolarimetry. SNIa polarization is usually very small, hence difficult to measure. In most cases only upper limits have been provided, in others polarization of the order of 0.2–0.3% (corresponding to an asphericity of 10%) has been detected before maximum light, likely due to a distorted photosphere or element distribution. Such asphericity may cause a directional dependance of the luminosity and a corresponding dispersion in the brightness-decline relation of SNe Ia. Although this may not jeopardize the use of SNIa as distance indicators, it might intrinsically limit the accuracy reachable via SNIa.
Very interesting spectropolarimetric data have been collected for special SNIa. High polarization (0.7%) was found in the subluminous SN 1999by how01 , which may suggest a relation between the observed asymmetry and the mechanism that produces this kind of underenergetic SNIa. The high velocity components (v km/s) of the CaII IR triplet observed in SN 2001el have shown a polarization of about 0.7%, much higher than the continuum (0.2%) indicating that kinematically and geometrically distinct features can exist in SNIa wang . High signal–to–noise data for more objects are definitely needed in order to understand if these asymmetries are the rule in SNIa, and to get insights on the the geometry of the precursor systems.
A special case is that of SN 2002ic, the first SNIa for which H has been unequivocally detected hamuy03 . Indeed both the light curve and the spectral line appearance points toward a strong interaction of the SN ejecta with a dense CSM. At the early phase the characteristic spectrum of a SNIa seemed veiled by a strong continuum. With time the spectrum evolved to resemble those of SNe 1997cy and 1999E, which are commonly considered as SNIIn germ ; tur97cy ; rigon . Also the profile of the H emission requires at least two components with different widths to provide a reasonable fit. It has, therefore, suggested that some SNIIn are the outcome of thermonuclear explosions rather than core collapses. Despite the early claim that these observations were a proof that the progenitor system of SN 2002ic was a binary consisting of a C/O WD and an AGB star hamuy03 , it may well be that it is the result of the merging of a WD with the core of an AGB star, and that the H we observe was previously ejected during a common envelope phase livio03 . The rarity of such an event and the large amount of H required favors the latter hypothesis. A polarization of % kawa has been detected also in SN 2002ic.
4 Core Collapse Supernovae
Stars of initial mass larger than about 8 M⊙ undergo the collapse of the core after burning H, He, C, Ne, O, Si. From such collapse a SN usually results.
Core collapse SNe can vary considerably as luminosity, spectral lines and time evolution. The main parameter governing the observed diversity is the envelope mass nomo95 . Stars retaining H will display the lines of this element during their entire evolution and are called SNII. If the H mass is large ( M⊙) the release of the energy deposited by the shock in the envelope and by the recombination can sustain the luminosity for months, producing the so-called SNII Plateau. If the envelope is less massive ( M⊙), stripped by a companion or lost by stellar wind, the SN quickly fades producing the so–called SNII Linear.
In both cases the spectrum evolves from a very blue, featureless continuum short after the burst (color temperature higher than 104 ∘K) to one dominated by H and He in a few days. Then, as the temperature continues to fall, other low excitation lines of Na I, Ca II, Fe II, Sc II appear, all with P–Cygni profiles. Subsequently, as the entire star becomes transparent and the light curve settles onto the radioactive tail, the spectrum enters the nebular phase, dominated by H and forbidden emission lines of [O I], [Ca II], [Fe II] and Mg I].
After SN 1987A, the best studied (but somehow atypical) object, whose detailed spectral observations provided evidences of clumps and mixing in the ejecta hanusch87 ; spyro93 as well as of dust formation danz91 , other SNII have been studied extensively. An interesting case is SN 1999em baron00 ; hamuy01 ; leon01 ; abu03 . The analysis of the H structure at photospheric epoch revealed non spherical ejection of 56Ni, while the transformation of the [O I] 6300 line profile around day 500 showed that dust formed earlier and at lower velocity than in SN 1987A, probably because of the lower temperature due to a smaller amount of 56Ni ejected. It appears, therefore, that these phenomena are common in core collapse SNe, though with distinctive characteristics for each object.
Core–collapse SNe which have lost most of their H and even most, or all, their He envelope, are called SNIb and Ic, respectively. Indeed the transition between SNII and SNIb, and between SNIb and SNIc is not sharp. SN1993J, celebrated with this Conference, is the best example (but not the only one) of a SN transforming with age from a type II to a type Ib SN, i.e. from one dominated by H to one dominated by He, with only residual H lines. For this reason it is called of type IIb fil_math .
At a deep scrutiny, H has been found in the spectra of other SNIb. SN 2000H is a remarkable case, but Branch et al. bran02 have shown that tiny differences in the H mass can vary the optical depths of H lines and make the transition from type IIb to type Ib SNe. Similarly, an increasing number of SNIc show evidence of He, e.g. SN 1990B, SN 1987M and even the prototypical SN1994I fil95 ; cloc96 . Again, it appears that moderate difference in the He mass can explain the spectroscopic difference between typical SNIb and SNIc bran02 . Different is the case of SN 1999cq, in which He with expansion velocity much slower than other lines, points to the interaction of the ejecta with a dense shell of almost pure He originating from stellar wind or mass transfer to a companion mat00 .
4.1 News on Core Collapse SN spectra
In the last years new light on the lower end of the luminosity function of SNII has been shed zamp_d_br ; pasto03 . SN1997D showed from the discovery unprecedented properties. The expansion velocity deduced from the displacement of the absorption was extremely low and the continuum intrinsically red. Moreover, the luminosity was very low both at discovery and in the nebular stage, indicating the ejection of a very little amount of 56Ni tur97d .
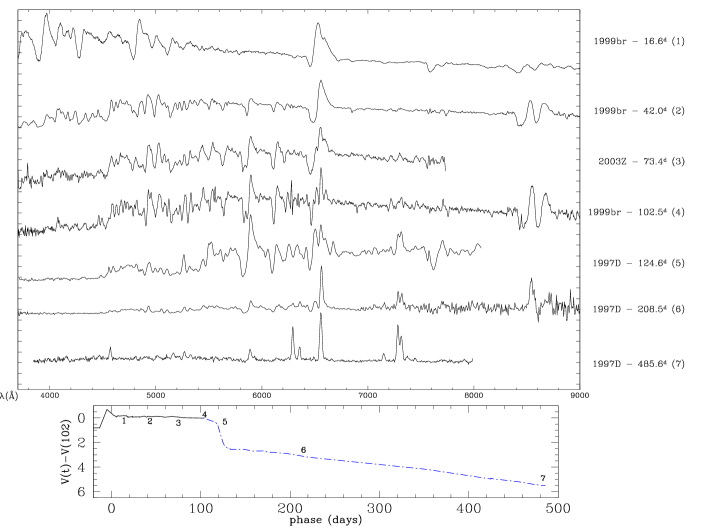
Four new objects with similar properties have been recently added pasto03 . Although the observations of individual objects are erratic and incomplete, because hampered by the faintness of the SNe, taken together these data show a common evolutionary path. Figure 2 summarizes the spectroscopic evolution: during the first 50 days (spectra 1 and 2) the spectra change from a continuum dominated by Balmer lines to a more complex appearance with strong Na I, Ba II and Ca II. The expansion velocities, lower than in normal SNII, decrease from 5000 to 3000 km s-1. During the second half of the plateau (spectra 3 and 4) these peculiarities strengthen significantly: the absorption troughs move to even lower velocities, down to 1000–1500 km s-1, the continuum becomes redder and low excitation lines of Ba II, Sc II, Fe II, Sr II and Ti II appear. In particular, the Ba II lines become the strongest features of the entire spectrum, even stronger than H. During the postplateau decline (spectrum 5) the transition to the nebular phase begins and forbidden lines (e.g. [Ca II] 7291–7323 Å) emerge. The spectra of the latest epochs (6 and 7) resemble those of normal SNII, with the usual (though narrower) emissions of H, Na I, [O I], [Ca II], [Fe II], Mg I].
Pastorello et al. pasto03 conclude that low–luminosity CC–SNe are similar to typical CC–SNe in having a clear plateau, lasting for 100 days, followed by a late–time decline driven by the decay of 56Co, and typical spectral lines at all phases. However, they keep distinctive characteristics in that (a) during the plateau phase the luminosity is at least a factor 10 times less than in typical CC–SNe, (b) the expansion velocity is unusually low at all epochs, and (c) the mass of 56Co which drives the late–time tail is at least a factor 10 lower than normal.
Important advances have been obtained also at the opposite extreme, i.e. for luminous and energetic SNe, often called hypernovae. In particular, large interest have received a number of SNe associated to GRBs. The first and best studied case is SN 1998bw which coincided in time and space with GRB980425 gal98 and was a powerful radio and X–ray emitter. In the optical most of its peculiarity stayed in the unprecedented broadness of the spectral features corresponding to expansion velocities of the ejecta as high as km s-1 at maximum light patat98bw . The high kinetic energy together with the high luminosity indicated an explosion energy of about ergs, if spherical symmetry is assumed iwa98 . Detailed spectral modeling iwa98 ; bran01a ; maz01 ; iwa03 has shown that the apparent emissions, which at maximum peaked around 5000, 6300 and 8500 Å, were actually low opacity regions of the spectra from which photons could escape. Lines of Si II, O I, Ca II and FeII have been identified, as well as He I 10830 Å.
Only during the nebular phase SN 1998bw reentered into the conventional taxonomical scheme with [O I], Mg I], [Fe II], [Ca II] emissions which confirmed the early hypothesis that it was a peculiar case of SNIc. Also in the nebular phase the lines were unusually broad ( km s-1 on day 201 patat98bw ).
After SN 1998bw several other hypernovae have been recognized, some were SNIc bearing strong resemblance to SN 1998bw but with smaller KE (1997ef, 1997dq, 1999as, 2002ap iwa00 ; mat01 ; iwa03 ; maz02 ), other were SNIIn (1997cy and 1999E germ ; tur97cy ; rigon ), which displayed narrow H on the top of broad wings and broad light curves, clear indications of ejecta–CSM interaction. For some of them the possible association with GRB has been claimed but no firm conclusion was reached. Other cases of possible SN–GRB association have been reported on the basis of bumps detected in the light curves of GRB afterglows. The early spectroscopy of these bumps was intriguing but not conclusive garna03 ; mdv03 .
Excitement mounted when, short before this Conference, spectra of the rebrightening of the afterglow of the nearby GRB030329 (z=0.1685) were secured stanek ; mat03 . Already one week after the burst a SN spectrum, with emissions at approximately 5000 and 4200 Å, was detected and it dominated over the power-law continuum few days later (day ). This SN, named 2003dh, resembled, both as spectral evolution and light curve, SN 1998bw at the corresponding epoch from the associated GRB. A more accurate analysis and spectral modeling suggested that SN 2003dh was intermediate between SN 1998bw and SN 1997ef, as to kinetic energy and 56Ni production maz03 and pointed out the need for asymmetric explosions. Whatever the physics of the explosion, this new example provides solid evidence that at least some GRBs arise from core-collapse SNe and opens new frontiers in the SN research.
ACKNOWLEDGMENTS. This research is supported in part by the European Community’s Human Potential Programme under contract HPRN-CT-2002-00303, and grant Cofin 2001021149 of the Italian Ministry of Education, University and Research.
References
- (1) S. Benetti, et al: 2001, MNRAS 322, 361
- (2) S., Benetti, et al.: 2003, MNRAS in press astro-ph/0309665
- (3) E., Baron, et al.: 2000, ApJ 545, 444,
- (4) D. Branch, S. Van Den Bergh: 1993, AJ 105 2231
- (5) D. Branch: In Supernovae and Gamma–Ray Bursts eds. M. Livio, N. Panagia (Cambridge University Press, Cambridge 2001), p.96
- (6) D. Branch, et al.: PASP 107 1019 (1995)
- (7) D. Branch, et al.: 2002, ApJ 566, 1005
- (8) A. Clocchiatti, et al.: 1996, ApJ 462 462
- (9) I.J. Danziger, et al.: In: Supernova 1987A and other supernovae, ed. I. J. Danziger, K. Kjar (ESO Conference and Workshop Proceedings) p.217
- (10) M. Della Valle, et al.: 2003, A&A 406 33
- (11) A., Elmhamdi, et al.: 2003, MNRAS 338, 939
- (12) A.V., Filippenko: 1997, ARAA 35, 309
- (13) A.V., Filippenko, T., Matheson: Optical, Ultraviolet, and Infrared Observations of SN 1993J. In: Supernovae: 10 Years of 1993J ed. J. Marcaide, K. Weiler (2004) pp.
- (14) A.V. Filippenko, et al: 1995, ApJ 450 L11
- (15) T.J. Galama, et al.: 1998, Nature 395 670
- (16) P.M. Garnavich, et al.: 2003, ApJ 582 924
- (17) L. Germany, et al.: 2000, ApJ 533, 320
- (18) M. Hamuy, et al.: 2001, ApJ 558, 615
- (19) M. Hamuy, et al.: 2002, AJ 124 417
- (20) M. Hamuy, et al.: 2003, Nature 424, 651
- (21) R.W. Hanuschik, et al.: 1988, MNRAS 243 41
- (22) K. Hatano, et al.: 2000, ApJ 543, L49
- (23) P. Höflich, et al.: 2002, ApJ, 568 791
- (24) D.A. Howell, et al.: 2001, ApJ 556 302
- (25) K. Iwamoto, et al.: 1998, Nature 395, 672
- (26) K. Iwamoto, et al.: 2000, ApJ 534, 660
- (27) K. Iwamoto, et al.: SN 1998bw and Hypernovae. In: Supernovae and Gamma–Ray Bursters, Lecture Notes in Physics, ed. K.W. Weiler (Springer, Berlin 2003), pp 243, 281
- (28) K.S., Kawabata, et al.: 2003, IAU Circular 8161
- (29) D.C., Leonard, et al.: 2002, PASP 114, 35
- (30) W. Li, A.V., Filippenko, E., Gates, et al.: 2001, PASP 113, 1178 ApJ 546, 734
- (31) W. Li,W., A.V., Filippenko, R., Chornock, et al.: 2003, astro-ph/0301428
- (32) M. Livio, A.G., Riess: 2003, ApJ 594, L93
- (33) T. Matheson, et al.: 2000, AJ 119 2303
- (34) T. Matheson, et al.: 2001, AJ 121 1648
- (35) T. Matheson, et al.: 2003, ApJ submitted (astro-ph/0307435)
- (36) P. Mazzali, et al.: 2001, ApJ 559 1047
- (37) P. Mazzali, et al.: 2002, ApJ 572 L61
- (38) P. Mazzali, et al.: 2003, ApJ submitted (astro-ph/0309555)
- (39) W.P.S. Meikle, et al.: 1996, MNRAS 281 263
- (40) K. Nomoto, K., Iwamoto, T., Suzuki: 1995 Phys. Rep. 256, 173
- (41) P. Nugent, et al.: ApJ 455 L147 (1995)
- (42) A., Pastorello, et al.: 2003, MNRAS in press (astro-ph/0309264)
- (43) F. Patat, et al. : 2001, ApJ 555 917
- (44) S. Perlmutter et al: 1997, ApJ 483, 565
- (45) M.M. Phillips: 1993, ApJ 413 L105
- (46) M.M. Phillips: 1999, AJ 118 1766
- (47) A,G. Riess, et al.: 1998, AJ 116 1009
- (48) L. Rigon, et al.: 2003, MNRAS, 340, 19
- (49) B.P. Schmidt, et al.: 1994, AJ 107, 1444
- (50) J. Spyromilio, et al.: 1993, MNRAS 263 530
- (51) J. Spyromilio, et al.: 1994, MNRAS 266 L17
- (52) K.Z. Stanek, et al.: 2003, ApJ 591 17
- (53) R.C. Thomas, et al.: 2003, ApJ in press (astro-ph/0302260)
- (54) M. Turatto, et al: 1996, MNRAS 283 1
- (55) M. Turatto, et al: 2000, ApJ 534 L57
- (56) M. Turatto, et al: 1998, ApJ 498, L129
- (57) M. Turatto: Classification of Supernovae. In: Supernovae and Gamma–Ray Bursters, Lecture Notes in Physics, ed. K.W. Weiler (Springer, Berlin 2003), pp 21–36
- (58) J.C. Wheeler, S. Benetti: In: Allen’s Astrophysical Quantities, ed. by A.N. Cox (Springer, New York 2000) p. 451
- (59) L. Wang, et al.: 2003, ApJ 591, 1110
- (60) L. Zampieri, et al.: 2003, MNRAS 338, 711