The XMM-Newton Iron Line Profile of NGC 3783
Abstract
We report on observations of the iron K line in the nearby Seyfert 1 galaxy, NGC 3783, obtained in a long, 2 orbit ( ks) XMM-Newton observation. The line profile obtained exhibits two strong narrow peaks at 6.4 keV and at 7.0 keV, with measured line equivalent widths of 120 and 35 eV respectively. The 6.4 keV emission is the K line from near neutral Fe, whilst the 7.0 keV feature probably originates from a blend of the neutral Fe K line and the Hydrogen-like line of Fe at 6.97 keV. The relatively narrow velocity width of the K line ( km s-1), its lack of response to the continuum emission on short timescales and the detection of a neutral Compton reflection component are all consistent with a distant origin in Compton-thick matter such as the putative molecular torus. A strong absorption line from highly ionized iron (at 6.67 keV) is detected in the time-averaged iron line profile, whilst the depth of the feature appears to vary with time, being strongest when the continuum flux is higher. The iron absorption line probably arises from the highest ionization component of the known warm absorber in NGC 3783, with an ionization of log and column density of cm-2 and may originate from within 0.1 pc of the nucleus. A weak red-wing to the iron K line profile is also detected below 6.4 keV. However when the effect of the highly ionized warm absorber on the underlying continuum is taken into account, the requirement for a relativistic iron line component from the inner disk is reduced.
1 Introduction
NGC 3783 is a bright (V=13 mag), nearby (z=0.00973), Seyfert 1 galaxy, which was first detected in X-rays in the Ariel-V all sky survey (McHardy et al., 1981) and subsequently in the high Galactic latitude survey conducted by HEAO-1 (Piccinotti et al., 1982). Since these early X-ray detections, there have been many observations of NGC 3783 in the X-ray band. A ROSAT observation of NGC 3783 showed evidence for a ionized absorber in the soft X-ray spectrum (Turner et al., 1993), which was confirmed during ASCA observations (George, Turner & Netzer, 1995; George et al., 1998). Subsequent high resolution grating observations of NGC 3783 with Chandra and XMM-Newton (Kaspi et al., 2000, 2001, 2002; Blustin et al., 2002; Behar et al., 2003) have revealed the soft X-ray absorber with unprecedented accuracy and resolution. Indeed the recent 900 ks observation obtained with the Chandra High Energy Transmission Grating Spectrometer (HETGS) probably represents the best soft X-ray spectrum (in terms of the combination of spectral resolution and signal to noise) obtained on any AGN to date, with the spectrum showing numerous absorption lines from all of the abundant elements between C and Fe, over a wide range of ionization states (Kaspi et al., 2002; Krongold et al., 2003; Netzer et al., 2003).
Our primary aim in this paper is to study in detail the iron K line profile of NGC 3783. The iron K emission line diagnostic in AGN first became important during the Ginga era, showing that the 6.4 keV iron K emission line and associated Compton reflection hump above 7 keV was common amongst Seyfert galaxies (Pounds et al., 1990; Nandra & Pounds, 1994). The higher (CCD) resolution spectra available with the ASCA satellite appeared to indicate that the line profiles were broad and asymmetrically skewed (to lower energies), which was interpreted as evidence that the majority of the line emission originated from the inner accretion disk around the massive black hole (Tanaka et al., 1995; Nandra et al., 1997; Reynolds, 1997). Indeed observations of NGC 3783 with ASCA also appeared to show a broad, relativistic iron line profile (Nandra et al., 1997; George et al., 1998), whilst the presence of the higher energy Compton reflection hump in NGC 3783 has been confirmed in a BeppoSAX observation (De Rosa et al., 2002).
The picture now emerging from the study of the iron K line with XMM-Newton and Chandra appears to be much more complex. The presence of a narrower 6.4 keV iron emission component, from more distant matter (e.g. the outer disk, BLR or the molecular torus) appears to be commonplace in many type I AGN including NGC 3783, e.g. Mrk 205 (Reeves et al., 2001); NGC 5548 (Yaqoob et al., 2001); NGC 5506 (Matt et al., 2001); Mrk 509 (Pounds et al., 2002); NGC 3516 (Turner et al., 2002); NGC 4151 (Schurch et al., 2003) and many other objects. In contrast the broad, relativistic component of the iron line profile appears to be much weaker than anticipated (Pounds & Reeves, 2002; Reeves, 2003) and in some cases may be absent altogether, e.g. NGC 5548 (Pounds et al., 2003a); NGC 4151 (Schurch et al., 2003). Observations have also revealed that highly ionized emission components (from He or H-like iron) may also be present in some, typically higher luminosity AGN, e.g. PG 1116+215 (Nandra et al., 1996); Mrk 205 (Reeves et al., 2001); NGC 5506 (Matt et al., 2001); Mrk 509 (Pounds et al., 2002); Mrk 766 (Pounds et al., 2003b); NGC 7314 (Yaqoob et al., 2003). The situation seems even further complicated, because of the presence of ionized iron K-shell absorption edges and/or lines in some AGN (Nandra et al., 1999; Chartas et al., 2002; Chartas, Brandt & Gallagher, 2003; Pounds et al., 2003c; Reeves et al., 2003), which may be associated with high velocity outflows. Furthermore transient, narrow, redshifted Fe line features have been observed in some AGN, e.g. NGC 3516 (Turner et al., 2002); Mrk 766, (Turner et al., 2003).
Here we present a study of the iron K-shell line from a long (240 ks) observation of NGC 3783 conducted by XMM-Newton in December 2001. The results from a much shorter (40 ks) earlier observation of NGC 3783 by XMM-Newton have been published by Blustin et al. (2002), who highlight the complexity of the iron line profile in this object, whilst an analysis of the RGS spectrum from this observation have recently been presented by Behar et al. (2003). Together with the long 300 ks XMM-Newton exposure of the Seyfert 1 MCG -6-30-15 (Fabian et al., 2002), the current observation represents the best available dataset with which to study the iron K line profile in AGN, as the long XMM-Newton observations offer very high signal to noise up to 12 keV. This allows us to study the various components, such as the narrow and broad lines, the reflection hump above 7 keV and any absorption lines or edges present in the iron K-shell band. The long XMM-Newton observation also makes it feasible to probe any changes in the iron K profile and the continuum on relatively short timescales. The higher resolution, but lower signal to noise 900 ks Chandra-HETGS spectrum complements this XMM-Newton observation by allowing the study of the narrow emission/absorption lines at higher spectral resolution; detailed modeling of the iron K band in this non-simultaneous dataset will be presented in another paper (Yaqoob et al. 2003, in preparation).
In Section 2, the XMM-Newton observations of NGC 3783 are outlined, whilst in Section 3 the detailed modeling of the time-averaged iron K line profile is performed. In Section 4 the effect of the warm absorber on the iron line profile is investigated, whilst in Section 5 we discuss the variability of the iron K-shell band and continuum over the observation.
2 The XMM-Newton Observations
NGC 3783 was observed by XMM-Newton between 17-21 December 2001 over 2 complete satellite orbits (OBSID 0112210501 and 0112210201), with a total good exposure of just over 240 ks with the EPIC (European Photon Imaging Camera) detectors. Data was taken with the EPIC-pn detector (Struder et al., 2001) in Small Window Mode and with the EPIC-MOS detectors (Turner et al., 2001) in Full Window mode and timing mode. The data was reduced using version 5.4 of the XMM-SAS software using the standard processing scripts (emchain and epchain). Only short time intervals were excluded during the end of each satellite orbit, due to high count rate background flares, the background rates were nominal for the remainder of the observation. Data were selected using event patterns 0-12 (for the MOS) and pattern 0-4 (for the pn) and only good X-ray events (using the selection expression ‘FLAG=0’ in evselect) were included. The spectra were extracted from circular source regions of 40′′ radius, whilst background spectra were extracted from an offset circle of identical size, close to NGC 3783, but free of any background sources. Response matrices and ancillary response files were generated using the SAS tasks rmfgen and arfgen respectively. The time-averaged, 0.2-12 keV flux of NGC 3783 during the observation was ergs cm-2 s-1. The EPIC-pn lightcurve extracted over the full 0.2-12.0 keV band for both orbits is shown in Figure 1.
Unfortunately none of the MOS data taken during the observation are suitable for detailed spectral analysis, as the full window observations are heavily piled up at the flux level of the source, whilst the MOS timing modes are not presently calibrated to sufficient accuracy. Conversely the EPIC-pn exposures taken in Small Window mode do not suffer from significant pile-up, at the level of % of events. Thus the spectral analysis was restricted to the EPIC-pn detector, which provides the highest signal to noise ratio in the iron K-shell band up to 12 keV. Background subtracted spectra were fitted using xspec v11.2, including data over the energy ranges 0.3 to 12 keV. A Galactic absorption column of cm-2 (Dickey & Lockman, 1990) was included in all the fits and fit parameters are quoted in the rest-frame of NGC 3783 at z=0.00973. Given the large number of counts available in the observation, the source spectra were binned to a minimum of 50 counts per bin to enable the use of the minimization process when performing X-ray spectral fits. All errors are quoted at 90% confidence for one interesting parameter (corresponding to ).
2.1 Initial Spectral Fits
Initially we concentrate our analysis on the time-averaged NGC 3783 spectrum, from the whole 240 ks observation, which provides us with the highest signal to noise, especially important for studying the iron K-shell band in the greatest detail. A time dependent analysis is described in Section 5, which shows that any temporal spectral changes are subtle, and do not effect our conclusions about the mean iron line profile. Initially a single power-law was fitted over a relatively clean part of the EPIC-pn spectrum between 3.5-5 keV, i.e. avoiding the iron line above 5 keV and the strong warm absorber in the soft X-ray part of the spectrum. The best-fit photon index was , whilst the spectrum and data/model residuals (Figure 2) show a clear deficit of counts between 0.7 and 3 keV, due to the known soft X-ray warm absorber in NGC 3783, whilst strong residuals are also present above 6 keV in the iron K-shell emission/absorption band. A weak soft X-ray excess is also present at the lowest energies below 0.7 keV, which has also been detected in an earlier BeppoSAX observation (De Rosa et al., 2002).
In order to model the iron K shell band we concentrate our analysis on the higher energy portion of the spectrum. The exact value of the low energy cut-off used is important, as the aim is to analyze part of the spectrum which is largely unaffected by the strong soft X-ray warm absorber, which can have a considerable effect in the determination of the underlying continuum. Inspection of Figure 2 shows that the absorber starts to have a significant effect below 3 keV in the EPIC-pn data. We have also studied the (non-simultaneous) 900 ks Chandra-HETGS observation presented by Kaspi et al. (2002). All the strong absorption features in this spectrum are present below 4.5 Angstrom (2.8 keV) mainly due to K-shell absorption lines from elements between C and S, as well as L-shell absorption from iron. The last abundant element that may contribute discrete spectral features in the soft X-ray absorber is Ar, the HETGS spectrum shows that there are weak absorption lines due to He and H-like Ar at 3.1 and 3.3 keV respectively.
In order to minimize the effect of the warm absorber when analyzing the iron K line profile, we adopt a conservative approach, and restrict our spectral analysis to the energy range from 3.5 to 12 keV. Over this band the only discrete absorption features (other than from iron) are due to Ca xix and Ca xx. These features are weak in the 900 ks HETGS observation, although note that the S/N of the HETGS above 3.5 keV is reduced, compared to the soft X-ray portion of the spectrum. In a later section of this paper (Section 4) we also discuss the effect the warm absorber may have on the continuum (through bound-free absorption) and above the neutral iron K-shell edge, by comparing our fits with models generated with the photo-ionization code xstar (Kallman et al., 1996).
3 The Time-Averaged Iron line Profile of NGC 3783
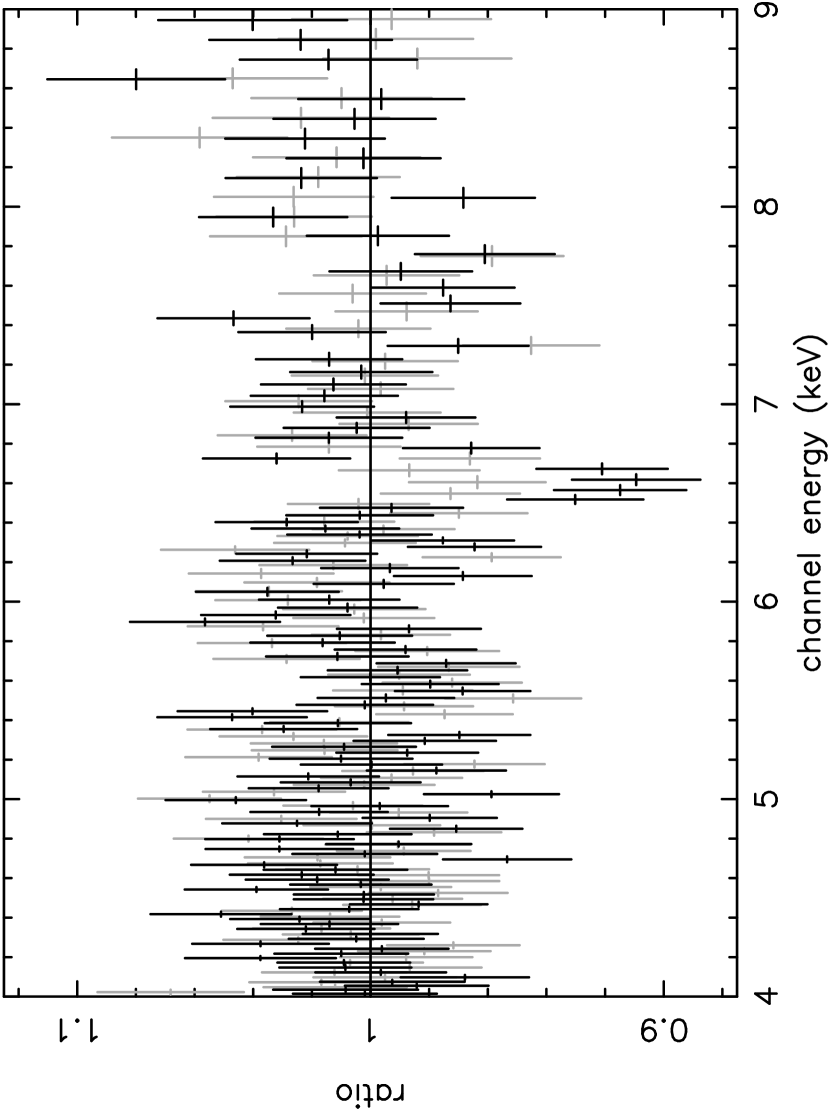
Initially we fitted the hard band (3.5-12 keV) EPIC-pn spectrum with a simple power-law together with neutral absorption from our own Galaxy. The fit was very poor (), with a best-fit photon index of . All the fit parameters are listed in Table 1. The data/model residuals are plotted in Figure 3 (panel a), two strong emission lines are apparent close to 6.4 keV and 7.0 keV, as well as a deficit of counts both near 6.6-6.7 keV and above the neutral iron K edge at 7 keV, whilst a small excess of counts is observed red-wards of the 6.4 keV line.
As a first step, we model the two strong emission lines with simple Gaussian profiles (Table 1, fit 1), with the energy, width and line flux free parameters (in addition to the continuum photon index and normalization). The line centroids are at keV and keV, with equivalent widths of eV and eV and fluxes of erg cm-2 s-1 and erg cm-2 s-1 respectively. The widths of the 6.4 and 7.0 keV lines are eV and eV respectively, which correspond to FWHM velocity widths of km s-1 and km s-1 respectively. Note that the non-zero widths of the lines are required by the data, for the line the improvement in fit statistic is for allowing the width to be non-zero (corresponding to an F-test null hypothesis probability of ). We comment on possible origins of the width of the 6.4 keV line later.
The observed ratio of the line fluxes are approximately 4:1, whereas one would expect a ratio of 150:17 between the and transitions from neutral iron. Thus there is likely to be an extra component contributing towards the emission line at 7.0 keV. Indeed the line energy of the 7.0 keV line is in between the lab frame energies for Fe xxvi Ly and Fe i K, which indicates that this line is a blend of these two emission lines (and which may in part account for the velocity width of this line component). In order to determine the strength of the putative H-like iron line, we fixed the ratio of the intensity of the line at 7.06 keV to 17/150 of that of the Fe K line at 6.4 keV. We also tied the velocity widths of the all 3 emission lines to that of the 6.4 keV line (Table 1, fit 2). Indeed a H-like Fe line component is required in the fits ( for 2 extra degrees of freedom), the measured energy of keV is very close to the known rest-frame energy for Fe xxvi at 6.966 keV (Pike et al., 1996), whilst the equivalent width of the line is eV.
Overall the fit statistic for this three component emission line fit (with ) is not formally acceptable, corresponding to a null hypothesis probability of . The data/model residuals to this fit are shown in Figure 3b, clearly there is a broad excess (red-wing) below 6.4 keV, whilst there appears to be an absorption line in the data near 6.6-6.7 keV. A strong Compton reflection component may also be present, as indicated in the spectrum by an edge above 7 keV and spectral hardening up to 12 keV. Indeed one would expect a Compton hump to accompany the 6.4 keV iron K emission line, if the line results from reprocessing in Compton-thick matter. Thus a neutral Compton reflection component, the pexrav model in xspec (Magdziarz & Zdziarski, 1995), was added to the model. The strength of the reflection component (measured by the parameter , where is the solid angle in steradian covered by the reflecting material) was initially fixed at , with an inclination of 30∘and a cut-off energy of keV using solar abundances. Note these parameters are consistent with the measurement of a Compton hump in an earlier BeppoSAX observation (De Rosa et al., 2002), where the strength of the reflection component was measured to be with a cut-off energy of about 300 keV. After adding the Compton reflection component, the fit statistic improves considerably (), whilst all 3 emission lines are still required in the dataset (Table 1, fit 3). The underlying power-law slope is now steeper (), accounting for the soft excess (e.g. Figure 2) observed in the broad-band EPIC-pn spectrum. After allowing the strength of the reflection component to vary, we obtain , with a steeper photon index (). However as the exact value of is very dependent on the high energy calibration of the EPIC-pn above 8 keV, we proceed by fixing R to 1, which is consistent with the strength of the Fe K line measured in the spectrum (George & Fabian, 1991) and the measurement of the reflection hump by BeppoSAX (De Rosa et al., 2002).
After adding the reflection component to the spectral fit the excess of counts below 6.4 keV and the absorption line near 6.7 keV are still apparent in the residuals (Figure 3c). To model the apparent red-wing to the Fe K line we added a ‘Diskline’ component (Fabian et al., 1989), to represent the emission from the inner accretion disk around a Schwarzschild black hole, taking the inner and outer radii of the disk as and respectively (where ) and fixing the rest-energy of the diskline emission at 6.4 keV. The improvement in fit statistic upon adding the diskline component is substantial ( for 3 additional parameters). The emissivity () of the diskline (where the disk emission varies with radius as ) was , the inclination angle derived was ∘ whilst the strength of the line is relatively weak (the equivalent width is eV).
The spectral fit was improved further by the addition of a narrow (unresolved by EPIC-pn) absorption line at keV, with an equivalent width of eV. Note the other iron emission line components are required as in the previous fits (Table 1, fit 4). The absorption line component is unambiguously required in the model fit with a high degree of statistical significance ( for 2 additional degrees of freedom), equivalent to an F-test null hypothesis probability of . The absorption line cannot be modeled with another emission component, such as the blue-wing of the disk emission line for instance, as the line is observed below the level of the power-law continuum (e.g. see Figure 3, panel c and d). The energy of this absorption line component probably corresponds to a blend of several lines of highly ionized iron, e.g. Fe xxiii at 6.62 keV, Fe xxiv at 6.66 keV and Fe xxv at 6.70 keV. Overall the fit statistic () is now formally acceptable, no other spectral components are required.
Finally we have also addressed the issue of whether the calibration of the EPIC-pn detector in the iron K-band has any effect on the fits, especially as some of the iron K features, discussed above, are present at the 5-10% level above the continuum. For comparison, we have therefore reduced the spectrum of the bright BL-Lac object, Mrk 421, obtained during a calibration observation with the EPIC-pn in small window mode on 14 November 2000. The featureless continuum spectrum was fitted with a simple absorbed power-law above 3.5 keV with a best-fit power-law index of . The data/model ratio residuals to this power-law model are shown in Figure 4, clearly no strong systematic features are observed over the iron K band, to about the 2% level over the power-law continuum. Thus the EPIC-pn calibration is unlikely to effect the iron K profile modeling in NGC 3783, as the Fe K emission and absorption present appears stronger than any systematics due to calibration over this bandpass.
3.1 The Width of the 6.4 keV Fe line
After modeling all the emission and absorption line components, and taking into account the resolution of the EPIC-pn detector (through the pn re-distribution matrix), the best fit width of the 6.4 keV K line is eV. In terms of the FWHM width, this corresponds to eV or km s-1 and appears to be just resolved by the EPIC-pn detector (see Figure 5). Note that the neutral Fe K line is actually a blend of two lines, at 6.391 keV and 6.404 keV, with a branching ratio of 2:1. However taking this into account in the spectral fits has a negligible effect on the velocity width of the line.
We note that this velocity width is broader than that reported by Kaspi et al. (2002) from the 900 ks Chandra HETGS observation. However some caution should be exercised when interpreting the velocity width obtained from the lower resolution EPIC-pn spectrum (FWHM resolution eV at 6 keV) compared to the higher resolution HETGS spectrum ( eV at 6 keV). For instance the 6.4 keV line may appear to be slightly broader, as the EPIC-pn is largely unable to resolve the first Compton scattering shoulder of this line (at 6.24 keV), which is apparent in the HETGS data (Kaspi et al. (2002), Yaqoob et al. 2003, in preparation). In addition, some contribution from a weak outer disk emission line component may also contribute towards the width of the EPIC-pn line. Thus the quoted velocity width of km s-1 should be regarded as an upper limit. The effect of the Compton shoulder is further discussed in section 6.1.
4 The Effect of the Warm Absorber
Whilst measuring the iron K line profile is our primary aim in this paper, it is important to verify whether the deep soft X-ray warm absorber in NGC 3783 absorber has any effect on the high energy spectrum and the iron line profile. The warm absorber could introduce subtle spectral curvature below 6.4 keV, and there may be some additional opacity above the neutral iron K-shell edge at 7.1 keV. Whilst this will have little effect on modeling the narrow Fe emission line components, the effect on the weak, broad red-wing (which constitutes only 5% of the continuum at 6 keV) may be crucial. Furthermore there is direct evidence for a high ionization component of the warm absorber in the iron K-shell band, through the detection of a strong 6.7 keV absorption line.
As a starting point, we base our initial models on those of Blustin et al. (2002), who fit the RGS spectra from an earlier, short (40 ks) XMM-Newton observation of NGC 3783. Conveniently, these authors parameterized their model in terms of a two zone warm absorber; a high ionization component responsible for the He and H-like K-shell absorption lines from the abundant soft X-ray elements (e.g. C, N, O, Ne, Mg) as well as L-shell absorption from highly ionized iron (Fe xvii-xxiv), with a low ionization component responsible for the unresolved transition array (UTA) resulting from a blend of inner-shell absorption lines from Fe M-shell ions. Although this model parameterizes an earlier XMM-Newton observation, it is thought that the warm absorber in NGC 3783 is relatively stable between the two XMM-Newton observations, as shown recently by Behar et al. (2003), who argue that the most recent RGS spectra from the long XMM-Newton look agree well with this earlier Blustin et al. (2002) model. Additionally no variability was found in the warm absorber Netzer et al. (2003) from a detailed analysis of all the Chandra observations over time of this source. Note however, that over a 3 year timescale, George et al. (1998) did find a factor of 2 change in the column density of the absorber in ASCA data.
In order to duplicate this soft X-ray absorption as closely as possible, we generated two grids of xstar photoionization models with similar parameters to those used in the Blustin et al. (2002) model. The relative elemental abundances of C through to Fe quoted in Blustin et al. (2002) were used, together with an outflow velocity of 800 km s-1 and a () turbulence velocity of 500 km s-1. As per Blustin et al. (2002), for the low ionization component we use an iron over-abundance of 10 times solar, and then fix the column density and ionization parameter at cm-2 and log erg cm s-1 respectively. Note however that this low ionization component is only added for completeness, it has relatively little effect on the high energy spectrum above 3.5 keV, only adding a small amount of opacity near the neutral iron K edge at 7.1 keV. For the higher ionization component, we initially fix the column density at cm-2 with an ionization parameter of log , using solar abundances of iron.
This two component model was then applied to the EPIC-pn spectrum over the 3.5-12 keV bandpass. Two narrow emission line components (one representing Fe K, the 2nd representing the blend of Fe K and Fe xxvi) were included in the fit, as well as the reflection component (with R fixed at 1) and the power-law continuum. Neither the diskline component nor the absorption line at 6.7 keV were included in the model. Initially the fit is poor (), the model does not reproduce the energy and depth of the strong 6.7 keV absorption line present in the data, as the ionization state of even the higher ionization absorber is not sufficient to produce the required column of highly ionized iron (e.g. Fe xxiii–xxv).
Thus, to fit the Fe K-shell absorption line present in the XMM-Newton EPIC data, we allowed the ionization parameter and column density of the highest ionization absorption component to vary. A higher ionization parameter of erg cm s-1 is required, whilst the column density is now cm-2 and the underlying continuum slope is . The fit to the spectrum has significantly improved (), reproducing the depth of the 6.7 keV absorption line well (see Figure 6), as the ionization state of the absorber is now high enough for Fe xxiii–xxv to be the dominant ions present. Thus this probably represents the highest ionization component of the known warm absorber in NGC 3783.
Interestingly, with the addition of the warm absorber, there is now no longer any requirement for the broad, relativistic disk emission component, the fit statistic is not significantly improved upon the addition of a diskline component, as the residuals to the warm absorber fit are small. (Note that the existence of the narrow Fe emission components are not affected). Formally the 90% upper-limit on a disk emission line component is eV, assuming a disk emissivity of and an inclination angle of 30∘. However note that the iron abundance of the high ionization absorber may be super-solar, hence the required hydrogen column density could be lower. For an iron abundance solar, the required hydrogen column will then be cm-2. In this scenario, then amount of spectral curvature below 6 keV due to the warm absorber is lessened and it is not possible to totally exclude the presence of a broad iron K line. Nonetheless any such broad line is very weak, with an equivalent width of only eV, whilst the improvement in the fit statistic upon adding the line is marginal ( for 2 extra parameters).
In order to assess directly the effect of the high ionization absorber on the spectrum above 3.5 keV, we removed the warm absorber from the model. The result is shown in Figure 7, clearly one can see the contribution that the high ionization absorber makes towards the 6.7 keV absorption line. However the absorber also introduces some continuum curvature below the iron K line (which effects the fits to the broad line component). There is also some opacity between 7-9 keV due to iron K-shell bound-free absorption, with an optical depth . This is also illustrated in Figure 8, which plots the highest ionization component of the warm absorber model, normalized to a power-law continuum. One can clearly see the continuum curvature between 3-6 keV, due to recovery from highly ionized K-shell edges from Mg, Si and S as well as from the L-shell edges of Fe below 3 keV. Additional opacity is also present above 8 keV, due to a blend of iron K-shell edges, as well the K (and higher series) absorption lines of highly ionized iron.
Finally we extrapolated this warm absorber to lower energies. However, to model the broad band spectrum (from 0.3-12 keV), we include three different ionization components, the two lower ionization (with log and log ) warm absorber components used by Blustin et al. (2002), which fit the earlier RGS spectrum, as well as the highest ionization component (with log ) ressponsible for the 6.7 keV iron absorption line. Allowing the ionization parameters and columns of the 3 component warm absorber to vary then gave log of -0.1, 2.1 and 3.0 erg cm s-1, with column densities of cm-2 (for solar Fe abundnace), cm-2 (solar Fe) and cm-2 (solar Fe) for the lowest to highest ionization components of the absorber respectively. The overall fit statistic was , whilst the broad-band spectrum, and data/model residuals to the warm absorber model, are plotted in Figure 9. The remaining residuals present in the spectrum are small, at the 5% level, similar to the residual calibration uncertainties in the EPIC-pn responses in the soft X-ray portion of the spectrum. The continuum photon index returned was , whilst a weak soft excess modeled by a black-body with a temperature of eV was required to fit the very softest part of the spectrum.
Note that all 3 warm absorber components are required to model the full band X-ray spectrum. For instance, removal of the highest ionization absorber results in a significantly worse fit, with , as the 6.7 keV absorption line is then not modeled by the absorber. Thus whilst the two lower ionization components provide a satisfactory fit to the spectrum below 2 keV (i.e. as shown by Blustin et al. (2002)), a third higher ionization component is required to model the 6.7 keV iron K-shell absorption. Indeed Netzer et al. (2003) require at least three different warm absorber components to model the 900 ks Chandra spectrum. It is therefore plausible that a wide range of ionizations are present in the absorber in NGC 3783; for instance iron with ionization states xvii is required from the detection of the iron M-shell UTA in the RGS spectrum (Blustin et al., 2002; Behar et al., 2003), whilst Fe xxv is likely to contribute towards the absorption at 6.7 keV.
5 Variability of the Fe line and hard X-ray continuum
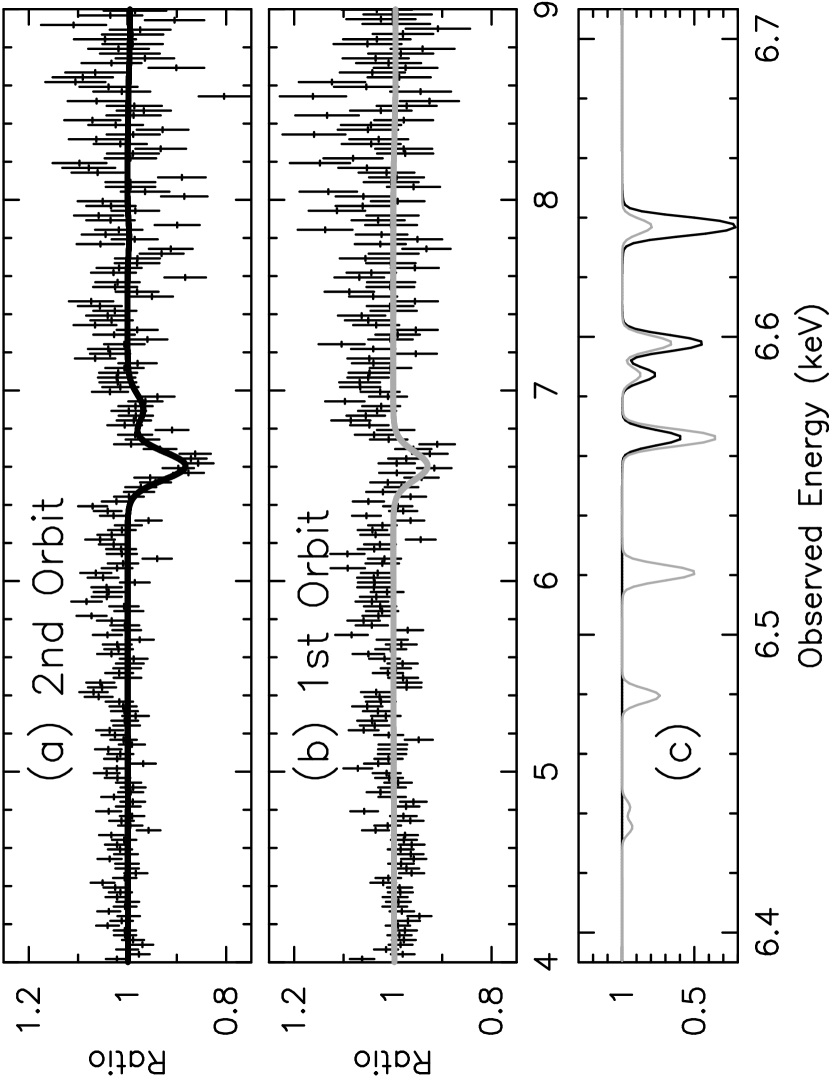
Initially we split the observation according to the two separate XMM-Newton orbits (e.g. Figure 1). The time-averaged flux state was relatively low during the first orbit (3.5-10 keV band flux of erg cm-2 s-1) and higher during the 2nd orbit (3.5-10 keV band flux of erg cm-2 s-1). As in the earlier fits, the iron K-shell spectral features were parameterized by multiple Gaussian emission/absorption line components and a neutral reflector (with ). A slight steepening with flux of the hard power-law index was observed, from in the first orbit to during the 2nd orbit. However there was no change in the 6.4 keV Fe line parameters, the Fe line flux being consistent with a constant value ( photons cm-2 s-1 during the first orbit and photons cm-2 s-1 during the 2nd orbit). These values are also consistent with the Fe K flux measured in the long Chandra HETGS observation, of photons cm-2 s-1 (Kaspi et al., 2002). Note, given the much poorer statistics on the 7.0 keV line, it is not possible to determine whether or not this line component varied.
However, a significant change in the 6.7 keV absorption line was observed from one orbit to the next, indicating that the highly ionized absorber is variable on timescales of s. This is illustrated in Figure 10, which shows the ratio to the best fit model to the data (but not including the absorption component) for the two orbits. Thus the absorption line appears to be strongest during the second, higher flux orbit (with an equivalent width of eV), whilst it was barely detected during the first orbit (equivalent width of eV).
The observations were also split into shorter time segments, of ks duration (i.e. 4 segments per orbit). However the more limited photon statistics do not enable us to determine whether the 6.7 keV absorption line is variable over this shorter timescale. However a similar pattern was seen with regards to variability of the Fe K line and the continuum. Whilst the 3.5-10 keV continuum flux varied by as much as 50% during the observation, there was no change in the iron K line flux (to 10% of the mean value). Similarily, a change in continuum photon index was observed, steepening from at the lowest flux level to at the highest flux level. This is consistent with the well known positive Flux-Gamma correlation found in many active galaxies. An alternative interpretation is that the primary power-law index may infact be the same for the different flux states. However if the Compton reflector originates from distant matter and does not respond to the continuum (which appears consistent with the constant-flux K emission line), then this component will appear stronger relative to the weaker power-law in the low flux spectra, resulting in a harder spectrum overall.
6 Discussion and Conclusions
The long XMM-Newton observation of the bright, Seyfert 1 galaxy NGC 3783 has revealed a complex iron K line profile above 3.5 keV. Two strong, but relatively narrow emission lines are apparent at 6.4 and 7.0 keV, the former from the (near) neutral Fe K fluorescence line, whilst the latter is likely to be a blend of the neutral Fe K line as well as a component from hydrogenic iron (i.e. Fe xxvi Ly-). The observations also revealed a weak red-wing to the iron K line profile below 6.4 keV, as well as an unambiguous detection of a high ionization iron absorption line at 6.7 keV. Note that at the resolution of the EPIC-pn, we cannot preclude the presence of emission or absorption from intermediate states of iron between 6.4 and 6.7 keV.
6.1 The Nature of the Iron K Line Emission in NGC 3783
The 6.4 keV Fe K line appears to be resolved in the EPIC-pn spectrum, with a typical (FWHM) velocity width of km s-1. At first glance this velocity is consistent with the FWHM dispersion in the BLR of NGC 3783 (Riechert et al., 1994; Wandel, Peterson & Malkan, 1999). However we note that the velocity width determined by the higher spectral resolution Chandra HETGS observation is much lower, the core of the 6.4 keV line having a FWHM width of km s-1 (Kaspi et al., 2002).
One possible explanation for this apparent discrepancy is the lower spectral resolution of the EPIC-pn detector compared to the HETG. For instance at the EPIC-pn resolution ( eV at 6 keV), it is difficult to resolve the narrow core of the line from a broader component, such as the Compton scattering shoulder of the line, which is apparent in the Chandra line profile (Kaspi et al. (2002), Yaqoob et al. (2003), in preparation). However one can substitute in the XMM-Newton spectrum for the parameters found in the Chandra HETGS fits to the Compton shoulder. For instance Yaqoob et al. 2003 approximate the Compton shoulder with a Gaussian profile, with a line energy of 6.24 keV (corresponding to the first Compton scattering peak, e.g. George & Fabian (1991)), a line width of eV and a line flux % of the neutral K line flux. If one takes the Compton shoulder of the line into account, then the broadening of the iron K line in the XMM-Newton spectrum is no longer required. The formal upper on the K line width is then eV, corresponding to a FWHM velocity width of km s-1.
Indeed the detection of the Compton scattering shoulder in the Chandra line profile, as well as the narrow width of the line core is indicative of scattering in distant Compton thick matter. Additionally both the XMM-Newton and the earlier BeppoSAX (De Rosa et al. 2002) observations also require a strong () Compton reflection component above 7 keV. However the line is unlikely to originate from the disk unless the typical radius is . Furthermore line does not respond to the continuum within the timescale (days) of the XMM-Newton observation in December 2001, whilst the line flux also does not appear to vary within the 18 month timescale of the Chandra observations between 21 January 2000 and 26 June 2001 (Yaqoob et al. 2003, in preparation), or indeed between the Chandra observations and the December 2001 XMM-Newton observation (the mean line flux from Chandra, of photons cm-2 s-1, Kaspi et al. (2002), is consistent with the XMM-Newton value). Given the lack of variation on these timescales, the bulk of the 6.4 keV line would appear to originate from distant matter. In the context of AGN unification schemes (Antonucci, 1993), one possible source for this distant, Compton-thick reprocessor is the putative molecular torus. Indeed predictions show that the putative torus may be a major contributer towards both the 6.4 keV line commonly seen in the Seyfert 1 spectra from both XMM-Newton and Chandra observations, as well as the strong iron lines observed in Seyfert 2s (Ghisellini, Haardt & Matt, 1994). Other geometries are also possible such as scattering off the Compton thick component of any quasar outflow (Elvis, 2000).
Whilst the detection of a narrow and distant 6.4 keV iron line now appears robust in this and many of the Seyfert 1s, generally the presence of the broad iron K line from the inner accretion disk (Tanaka et al., 1995; Nandra et al., 1997) is subject to considerable debate, the broad red-wing being much weaker than anticipated in the new Chandra and XMM-Newton datasets, for instance in NGC 5548 (Pounds et al., 2003a) or NGC 4151 (Schurch et al., 2003). If a disk-line component is present in NGC 3783 it is very weak, with an equivalent width of only 60 eV even before the warm absorber was modeled.
However, once the high ionization absorber responsible for the Fe K-shell absorption is accounted for in NGC 3783, then the requirement for a broad line is further reduced, with a formal upper-limit of eV on the equivalent width of such a component. The reduction in strength of the broad line is mainly due to the fact that the absorber can introduce subtle continuum curvature in the X-ray spectrum, even in the iron K-shell band (e.g. see Figures 7 and 8). Indeed this current study may have implications for the detection of the broad iron K line in other AGN, which also have a strong ionized absorbers (for instance in NGC 4151 or MCG -6-30-15). In the case of MCG -6-30-15, the broad line component is much stronger (Tanaka et al., 1995; Wilms et al., 2001; Fabian et al., 2002) and its detection appears to be more robust to the spectral model and underlying continuum slope that is assumed (Reynolds et al., 2003; Vaughan, Fabian & Iwasawa, 2003). However, the wealth of data now available through the XMM-Newton and Chandra archives clearly call for a more thorough, systematic analysis of the iron line profile in many AGN.
Indeed an important question is why the broad line is not required in many of the XMM-Newton Seyfert 1 spectra, and particularly in NGC 3783, which represents one of the highest quality iron line profiles obtained on any AGN to date? One possibility is that the inner disk is truncated, however given the narrow width of the 6.4 keV line, this requires that the bulk of the line emission occurs out at radii . However, at such a distance from the black hole, there is unlikely to be substantial hard X-ray emission. Another scenario which is perhaps more realistic is that the inner disk is strongly photoionized, so that most of the iron at the disk surface is fully ionized, and the subsequently the line is too weak to be detected. The magnetic flare model where the X-ray flux is concentrated in small, intense regions above the disk, can produce a very highly ionized skin at the local disk surface, with a high Compton temperature, e.g. Nayakshin (2000). The signature of this is a very weak iron line and disk reflection component, particularly when the underlying photon index is hard (). This scenario would appear consistent with the tight constraint on any broad disk emission line in these data, with an upper-limit of eV on the line equivalent width.
6.2 The Origin of the Variable, Highly Ionized Iron Absorber
Perhaps the most intriguing finding from this observation is the discovery of a variable absorption line component from highly ionized iron. The observed energy of the line ( keV) is consistent with the transitions of Fe xxiii (6.630 keV), Fe xxiv (6.659 keV) and Fe xxv (6.702 keV) at the systemic velocity of NGC 3783. These transitions all have similar oscillator strengths (–), hence the observed feature could be a blend of these ions. This absorber may represent the highest ionization phase of the gas that is responsible for the soft X-ray absorber in NGC 3783.
However, recent studies indicate that the lower ionization absorption components in NGC 3783 (Behar et al., 2003; Netzer et al., 2003) responsible for the soft X-ray absorber, do not vary, implying that this absorbing matter is located at large, parsec scale distances. The detection of rapid variability in the iron absorber within the XMM-Newton observation does not appear consistent with this; it is possible that the high ionization absorber is a physically separate component, located closer to the nucleus. In order to provide a zeroth order estimate for the location of the high ionization absorber, we calculated the maximum possible distance to the iron absorber, on the condition that , i.e. its thickness () cannot exceed its distance () from the nucleus. Combining the equations and yields . Now as erg s-1, cm-2 and erg cm s-1, then the maximum distance of the absorber is cm, or pc from the nucleus.
The XMM-Newton observations show that the Fe absorption line is variable on timescales of s. One possibility is that the variation in depth of the absorber between the two orbits may arise through changes in the ionization state of iron due to an increase in the illuminating flux. In the optically-thin limit, Fe xxiii–xxv are the dominant ions over a wide range of (). However the lack of significant absorption observed from the transition of Fe xxvi (6.966 keV) implies an ionization parameter may be towards the lower end of this range. For instance, if , then the relative ionization fractions () will be 0.06, 0.40, 0.31 and 0.14 for Fe xxvi, Fe xxv, Fe xxiv, and Fe xxiii respectively (and for the less-ionized species). With such an ionization structure, a reasonable fit to the absorption feature detected in the 2nd-orbit is obtained (see Figure 11, panel a) for a total column density of Fe (corresponding to for an Fe abundance , Wilms, Allen & McCray (2000)), assuming ionization equilibrium has been reached.
Now let us consider the 1st-orbit, when the observed intensity of the source (in the 3.5-10 keV band) was a factor lower. In the simplest case, when the absorbing gas is far from the nucleus and sees the same continuum as ourselves, then the ratio of the illuminating flux (and hence ) between the 2nd- and 1st-orbits is also 1.3. However such a situation is rejected by the data: Fe xxv, Fe xxiv, and Fe xxiii ions would still be the dominant Fe ions (with , 0.28 and 0.22, respectively) resulting in a predicted absorption blend stronger than observed. However the observed hard X-ray continuum is likely to be a composite of the variable primary continuum from the central engine and a constant reflected continuum from distant matter. This reflection component is observed in the high energy XMM-Newton spectrum, through the detection of a strong narrow K line and a Compton hump above 7 keV; hence the flux change in the primary continuum emission may be higher, by as much as a factor of two, although the exact value will depend on the shape of the high energy continuum above 12 keV. Indeed a satisfactory model (Figure 11, panel b) can be obtained if we decrease the ionization state further in the first orbit by reducing ionization parameter to , i.e. by a factor 2 compared to that during the 2nd-orbit. Under these circumstances Fe xxiii and Fe xxii are the dominant ions (with % of the Fe in the form of Fe xxiv and above see Figure 11, panel c). Due to the lower oscillator strengths of Fe xxii and below, a weaker line is predicted which is in agreement with the data.
The above example calculations assume ionization equilibrium. One can then consider the circumstances under which this might be true. Specifically, one can calculate the ionization timescale () required so that sufficient ionizing photons arrive and are absorbed by the gas such as to raise the ionization structure of the gas by the required amount. The column density of a given Fe ion is simply and for the underlying continuum appropriate for NGC 3783, 90% of the ionizing photons will be absorbed within a band of width , where is the threshold energy. For Fe xxiv, the relevant threshold energy will be at 2.05 keV, i.e corresponding to the L-shell edge energy of Fe xxiv. If the number of photons emitted by the source at is , and the distance to the absorber is , then the number of photons absorbed (per unit area) by a given ion within the gas in a time is , where and is the cross-section at the threshold energy.
Equating this to then defines for that ion. Requiring then leads to an upper limit on such that the ionization state of the absorber is able to react to variations in illumination within . For the ions of interest noted above (i.e. Fe xxi–xxiv), and assuming a distance of 42 Mpc towards NGC 3783, then the ionization equilibrium can be achieved in the s timescale between the 1st- and 2nd-orbits if pc. This is significantly smaller than the parsec-scale distances derived for the soft X-ray absorber (Behar et al., 2003; Netzer et al., 2003), but is consistent with the estimate above. Note that for a warm absorber distance of pc, the observed equilibrium time of s is consistent with the timescale calculated by Krolik & Kriss (2001), for Fe xxv.
Another possibility is that this absorber is similar to the extreme, high velocity () iron absorbers recently observed in some AGN by XMM-Newton and Chandra, e.g. APM 08279+5255 (Chartas et al., 2002); PG 1211+143 (Pounds et al., 2003c); PG 1115+080 (Chartas, Brandt & Gallagher, 2003); PDS 456 (Reeves et al., 2003). These outflows may arise from the innermost part of a disk driven wind (Proga, Stone & Kallman, 2000; King & Pounds, 2003). In this case the variation seen in the Fe absorber may be due to the passage of ionized matter across the central X-ray source. For a given size of the X-ray emitting region in NGC 3783 one can estimate the distance of the transient absorbing material passing in front of the central engine, assuming that this occurs on the timescale of the variation seen in the iron absorption line, i.e. s. In NGC 3783 the estimated black hole mass, obtained through BLR reverberation mapping, is M⊙ (Onken & Peterson, 2002), thus a typical size for the X-ray emitting region is cm. Thus the velocity of the absorbing matter passing in front of the source in s is km s-1 (or ). If one equates this velocity to the escape velocity of the matter at a given radius R from the black hole, then the distance of the absorber is cm. From the definition of the ionization parameter, , whilst from observation erg s-1 and erg cm s-1, hence the density of the absorbing matter is cm-3
The detection of the 6.7 keV absorption line in NGC 3783 adds to the growing number of cases where high ionization iron K-shell absorption features have been detected. For those AGN where high velocity X-ray iron absorption features have been measured, a large mass outflow rate is often required (typically M⊙ year-1), of the order of (or even greater than) the actual accretion rate required to power the bolometric luminosity of the sources, e.g. see the discussion in King & Pounds (2003). Similarly, we can also calculate the mass outflow rate required to power the high ionization absorber in NGC 3783, assuming an outflow velocity of km s-1 (i.e. consistent with the soft X-ray absorber). For a constant velocity outflow, the mass outflow rate will be:-
where is the solid angle subtended by the absorber and is the proton mass. For the iron absorber parameters derived in NGC 3783 (and assuming steradian), the mass outflow rate is year-1. This is of the same order as the expected accretion rate required to power the observed bolometric luminosity of NGC 3783 (assuming erg s-1 at 5% accretion efficiency). Similar mass outflow rates in other Seyfert 1s, of up to one solar mass per year, were also calculated from ASCA observations, by Reynolds (1997). Note that if the soft X-ray component of the warm absorber does reside at parsec scale distances, then the mass outflow rate required to sustain this material is even higher, e.g. see the calculation in Behar et al. (2003), of the order 10 M⊙ year-1. If the outflows are a relatively persistent phenomenon, which is likely as the warm absorbers appear to reside in 50% of Seyfert galaxies (Reynolds, 1997), then the large mass outflow rates require that a significant proportion of the matter feeding the AGN may in fact be required to sustain the outflowing material.
7 Acknowledgments
This paper is based on observations obtained with XMM-Newton, an ESA science mission with instruments and contributions directly funded by ESA Member States and the USA (NASA). We would like to thank Richard Mushotzky and Simon Vaughan for discussions and feedback. We would also like to thank the anonymous referee for helpful comments. T.J. Turner and T. Yaqoob acknowledge support in the form of NASA grants, NAG5-7538 and NAG5-10769 respectively.
References
- Antonucci (1993) Antonucci, A., 1993, ARA&A, 31, 473
- Behar et al. (2003) Behar, E., et al. 2003, ApJ, in press
- Blustin et al. (2002) Blustin, A.J., Branduardi-Raymont, G., Behar, E., Kaastra, J.S., Kahn, S.M., Page, M.J., Sako, M., & Steenbrugge, K.C. 2002, A&A, 393, 453
- Chartas et al. (2002) Chartas, G., Brandt, W.N., Gallagher, S.C., & Garmire, G.P. 2002, ApJ, 579, 163
- Chartas, Brandt & Gallagher (2003) Chartas, G., Brandt, W.N., & Gallagher, S.C. 2003, ApJ, 595, 85
- De Rosa et al. (2002) De Rosa, A., Piro, L., Fiore, F., Grandi, P., Maraschi, L., Matt, G., Nicastro, F., & Petrucci, P.O. 2002, A&A, 387, 838
- Dickey & Lockman (1990) Dickey, J.M., & Lockman, F.J. 1990, ARA&A, 28, 215
- Elvis (2000) Elvis, M. ApJ, 2000, 545, 63
- Fabian et al. (1989) Fabian, A.C., Rees, M.J., Stella, L., & White, N.E. 1989, MNRAS, 238, 729
- Fabian et al. (2002) Fabian, A.C., Vaughan, S., Nandra, K., Iwasawa, K., Ballantyne, D.R., Lee, J.C., De Rosa, A., Turner, A., & Young, A.J. 2002, MNRAS, 335, L1
- George & Fabian (1991) George, I.M., & Fabian, A.C. 1991, MNRAS, 249, 352
- George, Turner & Netzer (1995) George, I.M., Turner, T.J., & Netzer, H. 1995, ApJ, 438, L67
- George et al. (1998) George, I.M., Turner, T.J., Mushotzky, R., Nandra, K., & Netzer, H. 1998, ApJ, 503, 174
- Ghisellini, Haardt & Matt (1994) Ghisellini, G., Haardt, F., & Matt, G. 1994, MNRAS, 267, 743
- Kallman et al. (1996) Kallman, T., Liedahl, D., Osterheld, A., Goldstein, W., & Kahn, S. 1996 ApJ, 465, 994
- Kaspi et al. (2000) Kaspi, S., Brandt, W.N., Netzer, H., Sambruna, R., Chartas, G., Garmire, G.P., & Nousek, J.A. 2000, ApJ, 535, L17
- Kaspi et al. (2001) Kaspi, S., Brandt, W.N., Netzer, H., George, I.M., Chartas, G., Behar, E., Sambruna, R., Garmire, G., & Nousek, J.A. 2001, ApJ, 554, 216
- Kaspi et al. (2002) Kaspi, S., et al. 2002, ApJ, 574, 643
- King & Pounds (2003) King, A., & Pounds, K.A. 2003, MNRAS, 345, 657
- Krolik & Kriss (2001) Krolik, J.H., & Kriss, G.A, 2001, ApJ, 561, 684
- Krongold et al. (2003) Krongold, Y. et al., 2003, ApJ, in press
- Magdziarz & Zdziarski (1995) Magdziarz, P., & Zdziarski, A. 1995, MNRAS, 273, 837
- Matt et al. (2001) Matt, G., Guainazzi, M., Perola, G.C., Fiore, F., Nicastro, F., Cappi, M., & Piro, L. 2001, A&A, 377, L31
- McHardy et al. (1981) McHardy, I.M., Lawrence, A., Pye, J.P., & Pounds, K.A. 1981, MNRAS, 197, 893
- Nandra & Pounds (1994) Nandra, K., & Pounds, K.A., 1994, MNRAS, 268, 405
- Nandra et al. (1996) Nandra, K., George, I.M., Turner, T.J., Fukazawa, Y. 1996, ApJ, 464, 165
- Nandra et al. (1997) Nandra, K., George, I.M., Mushotzky, R.F., Turner, T.J., & Yaqoob, T. 1997, ApJ, 477, 602
- Nandra et al. (1999) Nandra, K., George, I.M., Mushotzky, R.F., Turner, T.J., Yaqoob, T. 1999, ApJ, 523, L17
- Nayakshin (2000) Nayakshin, S., 2000, ApJ, 540, L37
- Netzer et al. (2003) Netzer, H., et al. 2003, ApJ, in press
- Onken & Peterson (2002) Onken, C.A., & Peterson, B.M. 2002, ApJ, 572, 746
- Piccinotti et al. (1982) Piccinotti, G., Mushotzky, R.F., Boldt, E.A., Holt, S.S., Marshall, F.E., Serlemitsos, P.J., & Shafer, R.A. 1982, ApJ, 253, 485
- Pike et al. (1996) Pike, C.D., et al. 1996, ApJ, 464, 487
- Pounds et al. (1990) Pounds, K.A., Nandra, K., Stewart, G.C., George, I.M., & Fabian, A.C. 1990, Nature, 344, 132
- Pounds et al. (2002) Pounds, K., Reeves, J., O’Brien, P., Page, K., Turner, M., & Nayakshin, S. 2002, ApJ, 559, 181
- Pounds & Reeves (2002) Pounds, K.A., & Reeves, J.N, 2002, to appear in the Proceedings of the Symposium on ‘New Visions of the X-ray Universe in the XMM-Newton and Chandra Era’ (astro-ph/0201436), 26-30 November 2001, ESTEC, The Netherlands
- Pounds et al. (2003a) Pounds, K.A., Reeves, J.N., Page, K.L., Edelson, R., Matt, G., & Perola, G. C. 2003, MNRAS, 341, 953
- Pounds et al. (2003b) Pounds, K.A., Reeves, J.N., Page, K.L., Wynn, G.A., O’Brien, P.T., 2003, MNRAS, 342, 1147
- Pounds et al. (2003c) Pounds, K.A., Reeves, J.N., King, A., Page, K., & O’Brien, P.T. 2003, MNRAS, in press (astro-ph/0303603)
- Proga, Stone & Kallman (2000) Proga, D., Stone, J.M., & Kallman, T. 2000, ApJ, 543, 686
- Reeves et al. (2001) Reeves, J.N., Turner, M. J. L., Pounds, K.A., O’Brien, P.T., Boller, Th., Ferrando, P., Kendziorra, E., & Vercellone, S. 2001, A&A, 365, L134
- Reeves et al. (2003) Reeves, J.N., O’Brien, P.T., & Ward, M. 2003, ApJ, 593, L65
- Reeves (2003) Reeves, J., 2003, in Active Galactic Nuclei: from Central Engine to Host Galaxy, meeting held in Meudon, France, July 23-27, 2002, Eds.: S. Collin, F. Combes and I. Shlosman. ASP (Astronomical Society of the Pacific), Conference Series, Vol.290, p. 35.
- Reynolds (1997) Reynolds, C.S., 1997, MNRAS, 286, 513
- Reynolds et al. (2003) Reynolds, C.S., Wilms, J., Begelman, M.C., Staubert, R., & Kendziorra, E. 2003, ApJ, submitted
- Riechert et al. (1994) Reichert, G.A., et al. 1994, ApJ, 425, 582
- Schurch et al. (2003) Schurch, N., Warwick, R.S., Griffiths, R.S., & Sembay, S. 2003, MNRAS, 345, 423
- Struder et al. (2001) Struder, L., et al. 2001, A&A, 365, L18
- Tanaka et al. (1995) Tanaka, Y., et al. 1995, Nature, 375, 659
- Turner et al. (2001) Turner, M.J.L., et al. 2001, A&A, 365, L27
- Turner et al. (1993) Turner, T.J., Nandra, K., George, I.M., Fabian, A.C., & Pounds, K.A. 1993, ApJ, 419, 127
- Turner et al. (2002) Turner, T.J., Mushotzky, R.F., Yaqoob, T., George, I.M., Snowden, S.L., Netzer, H., Kraemer, S.B., Nandra, K., & Chelouche, D. 2002, ApJ, 574, L123
- Turner et al. (2003) Turner, T.J., Kraemer, S.B., & Reeves, J.N. 2003, ApJ, submitted
- Vaughan, Fabian & Iwasawa (2003) Vaughan, S., Fabian, A.C., & Iwasawa, K. 2003, MNRAS, submitted
- Wandel, Peterson & Malkan (1999) Wandel, A., Peterson, B.M., & Malkan, M.A., 1999, ApJ, 526, 579
- Wilms, Allen & McCray (2000) Wilms, J., Allen, A., McCray, R. 2000, ApJ, 542, 914
- Wilms et al. (2001) Wilms, J., Reynolds, C.S., Begelman, M.C., Reeves, J., Molendi, S., Staubert, R., & Kendziorra, E. 2001, MNRAS, 328, L27
- Yaqoob et al. (2001) Yaqoob, T., George, I.M., Nandra, K., Turner, T.J., Serlemitsos, P.J., & Mushotzky, R. F. 2001, ApJ, 546, 759
- Yaqoob et al. (2003) Yaqoob, T., George, I.M., Kallman, T.R., Padmanabhan, U., Weaver, K.A., & Turner, T.J., 2003, ApJ, 596, 85


| Fit | Line | aaEnergy of the Fe line in units of keV. | bb width of the line in eV. | ccEquivalent width of the line in eV. | ddNull hypothesis probability that the fit statistic is acceptable. | ||
|---|---|---|---|---|---|---|---|
| 1. | Fe K | 1589/1287 | |||||
| Fe K/Fe xxvi | |||||||
| 2. | Fe K | 1591/1287 | |||||
| Fe xxvi | |||||||
| Fe K | |||||||
| 3. | Fe K | 1492/1287 | |||||
| Fe xxvi | |||||||
| Fe K | |||||||
| 4. | Fe K | 1324/1282 | |||||
| Fe xxvi | |||||||
| Fe K | |||||||
| Fe xxv absn | |||||||
| Diskline |
Note. — Fit 1 consists of a power-law plus 2 Gaussian emission lines. Fit 2 is a power-law plus 3 Gaussian emission lines. Fit 3 is a power-law plus 3 Gaussian emission lines and neutral reflection component (the xspec model pexrav with ). Fit 4 consists of a power-law, plus three Gaussian emission lines, a neutral reflection component, a disk emission line (the diskline model in xspec), as well as a Gaussian shaped absorption line.