The X-ray Background and AGNs
Abstract
Deep X–ray surveys have shown that the cosmic X–ray background (XRB) is largely due to the accretion onto supermassive black holes, integrated over the cosmic time. These surveys have resolved more than 80% of the 0.1-10 keV X–ray background into discrete sources. Optical spectroscopic identifications show that the sources producing the bulk of the X–ray background are a mixture of unobscured (type-1) and obscured (type-2) AGNs, as predicted by the XRB population synthesis models. A class of highly luminous type-2 AGN, so called QSO-2s, has been detected in the deepest Chandra and XMM-Newton surveys. The new Chandra AGN redshift distribution peaks at much lower redshifts (z 0.7) than that based on ROSAT data, and the new X-ray luminosity function indicates that the space density of Seyfert galaxies peaks at significantly lower redshifts than that of QSOs. It is shown here, that the low redshift peak applies both to absorbed and unabsorbed AGN and is also seen in the 0.5-2 keV band alone. Previous findings of a strong dependence of the fraction of type-2 AGN on luminosity are confirmed with better statistics here. Preliminary results from an 800 ksec XMM-Newton observation of the Lockman Hole are discussed.
1 Introduction
In recent years the extragalactic X–ray background in the 0.1-10 keV band has almost completely been resolved into discrete sources with the deepest ROSAT, Chandra and XMM-Newton observations [1, 2, 3, 4]. Optical identification programmes with Keck [5, 6, 7, 8]) and VLT [9, 10] find predominantly unobscured AGN-1 at X-ray fluxes erg cm-2 s, and a mixture of unobscured and obscured AGN-2 at fluxes erg cm-2 s-1 with ever fainter and redder optical counterparts, while at even lower X-ray fluxes a new population of star forming galaxies emerges [11, 12]. At optical magnitudes R24 all these surveys suffer, however, from spectroscopic incompleteness, so that photometric redshift techniques have to be applied here [13].
After having understood the basic contributions to the X-ray background, the interest is now focusing on understanding the physical nature of these sources, the cosmological evolution of their properties, and their role in models of galaxy evolution. The X-ray observations have been roughly consistent with X-ray background population synthesis assuming a mixture of absorbed and unabsorbed AGN, folded with the corresponding luminosity function and cosmological evolution, e.g.[14, 15, 16]. However, inputs to these models are still rather uncertain, like e.g. the cosmological evolution of low-luminosity AGN or the fraction of type-1 to type-2 AGN as a function of redshift and intrinsic luminosity, and a wide range of different assumptions has been invoked for these parameters [17, 18], see also [19]. Finally, the source statistics and optical incompleteness are rather poor at high redhifts.
The deep Chandra and XMM surveys, but also wider ASCA surveys have already provided important new constraints. Several examples of the long-sought class of high redshift, radio quiet type-2 QSO have been detected in deep fields [20, 21, 8, 9]. These allow for the first time to constrain the fraction of type-2 AGN as a function of X–ray luminosity. At low luminosities a type-2 fraction of 75-80% is found, consistent with local optically selected Seyfert galaxies, while at high luminosities the type-2 fraction is significantly smaller [22, 9]. The redshift distribution of Chandra deep survey sources peaks at z0.7. This is related to the finding of a much slower cosmic evolution for Seyferts compared to QSOs [22, 23, 24, 25, 10]. And finally, significant spikes are found in the redshift distributions [26, 27], indicating that AGN prefer to live in sheets of large-scale structure.
In this review I show preliminary results on an ultradeep XMM-Newton observation in the Lockman Hole and compare the optical identification work in the two deepest Chandra fields, the Chandra Deep Field South and the Hubble Deep Field North.
2 XMM-Newton Ultradeep Survey of the Lockman Hole
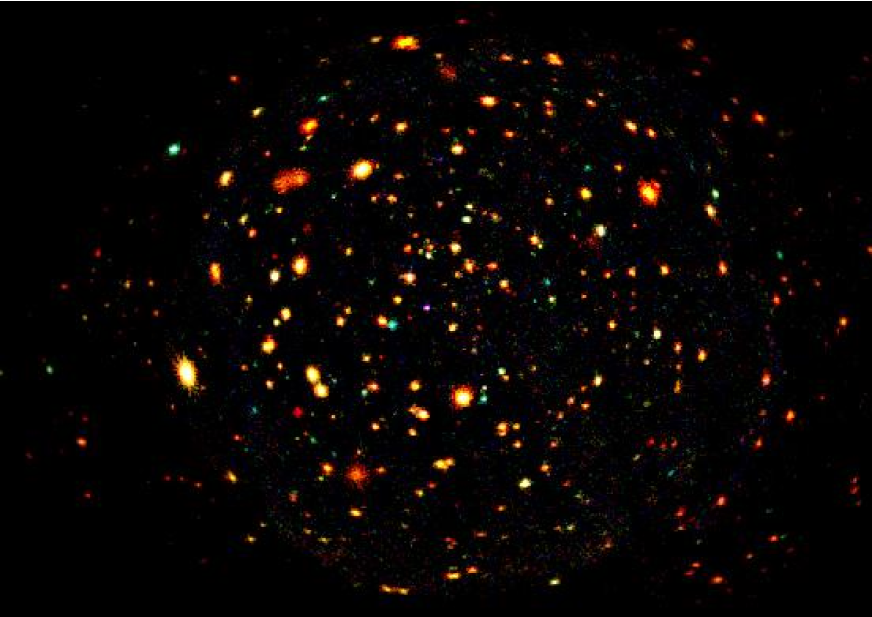
The Lockman Hole (LH) is the area with the absolutely lowest column density of interstellar absorption and was selected for the location of the deepest ROSAT surveys [1], as well as the first XMM-Newton deep survey, observed in the performance verification phase of the satellite [3]. In AO2 a 200 ksec observation of the LH was awarded to X. Barcons, but due to high background conditions, unfortunately only about 50 ksec of good exposure time could be secured. In AO3, our XMM LH team, including X. Barcons and A. Fabian, has been awarded an XMM exposure time of 665 ksec in the Lockman Hole. Due to a scheduling error, the step width of the mini raster survey specified in order to reduce the imprint of the CCD chip gaps on the exposure map, has been set erroneously to 15 arcminutes instead of 1 arcmin, so that a significant part of the exposure ( 300 ksec net) was spent in a wider raster pattern. While unfortunate for the primary goal of our deep survey, this turned out to be very useful, because it provided a wider area coverage with an exposure time of almost 100 ksec. Finally, the XMM-Newton observatory reimbursed the 300 ksec exposure lost for the central pointing, so that the total net integrated XMM-Newton exposure in the Lockman Hole is about 800 ksec (see Figure 1).
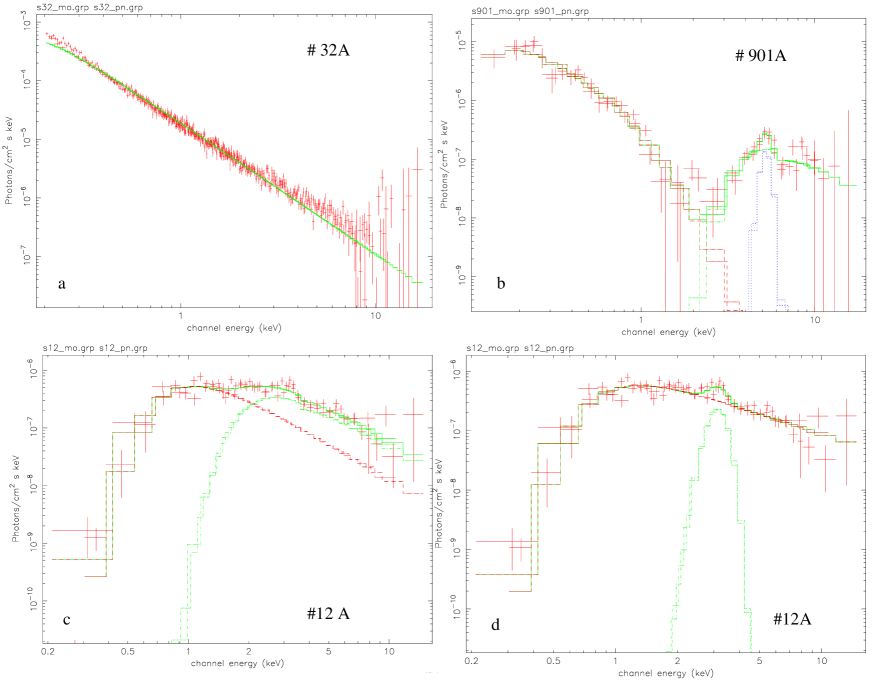
Figure 1 shows the colour composite XMM-Newton image of the Lockman Hole. North is up and East is to the left. This was constructed by combining images, smoothed with a Gaussian with =2” in three bands (0.5-2 keV, 2-4.5 keV, 4.5-10 keV). Blue sources are those undetected in the soft (0.5-2 keV) band, most likely due to intrinsic absorption from neutral hydrogen with column densities . Very soft sources appear red.
2.1 X-ray spectroscopy
The large throughput and the unprecedented hard X-ray sensitivity of the telescopes aboard the XMM-Newton observatory allow for the first time to determine X-ray spectra of the faintest X-ray source population and constrain the evolution of their physical properties, in particular the X-ray absorption. In the first deep survey taken with XMM-Newton in the Lockman Hole, it was possible to determine coarse X-ray spectra of about 50 X-ray sources with more than 100 photons detected in the XMM observation, representing a largely complete, optically identified subsample [28]. While type-1 QSOs have the typical blue colours, type-2 sources follow much redder optical colour tracks expected for their host galaxy because the optical nucleus is obscured. X-ray spectrophotometry with XMM finds the expected strong correlation between X-ray absorption and optical obscuration [28]. However, there are two high redshift type-1 QSOs which are optically unobscured and X-ray absorbed, indicating possible differences in the dust properties of these sources, e.g. [29]. However, the existing samples are too small to make population studies. A 400 ksec XMM-Newton observation of the Chandra Deep Field South (see below) is providing additional X-ray spectroscopy samples [30]. In the new 800 ksec XMM observation 330 sources have more than 200 counts and 104 have 1000 counts allowing to study emission and absorption properties of rather distant sources in great detail. The spectral diagnostics of high-redshift is in particular helped by the extremely low neutral hydrogen column density towards the LH.
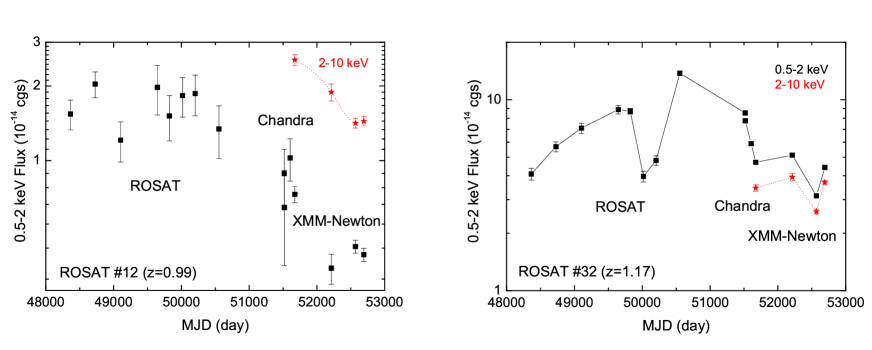
Figure 2 shows examples of unfolded X-ray spectra from three sources in the 800 ksec observation of the LH, combining the data from the two MOS CCD and the pn-CCD camera of XMM-Newton. Panel 2a shows the spectrum of ROSAT Deep Survey (RDS) source #32A, a type-1 QSO at z=1.117, which can be fit to first order by a single power law model with photon index and galactic absorption. A detailed look at the residuals of this fit, however, reveals excesses at soft energies (below 0.8 keV in the QSO restframe), which could be associated with a soft excess. At high energies (above 8 keV in the QSO rest frame) there seems to be an excess, which is likely associated to Compton reflection. No strong Fe line is apparent in this spectrum. Panel 2b shows the spectrum of ROSAT Ultradeep Survey (UDS) source #901A, a relatively nearby Seyfert-2 galaxy at z=0.204. Its X-ray spectrum can be fit with a heavily obscured power law with cm-2 and photon index and a superposed, broad Fe emission line, plus an additional unabsorbed soft thermal spectrum with a temperature of keV, which, however does not show any emission lines.
The spectrum of RDS source #12A, a Seyfert-2 galaxy at z=0.99, is shown in panels 2c and 2d. It can be fit either with two heavily absorbed power law spectra with a ’standard’ photon index and two absorber thicknesses of and cm-2. This can be either interpreted (2c) as one AGN with partial covering absorption with a covering factor of roughly 80%, or even as a pair of AGN in the same galaxy, similar to the case recently discoverd in NGC 6240 [31]. Alternatively it can be interpreted (2d) as a single, intrinsically absorbed power law with a rather flat photon index and a superposed broad Fe emission line.
2.2 Time variability
One possibility to distinguish between different spectral model interpretations is to study the temporal variability of these very faint X-ray sources. The Lockman Hole is ideally suited for this purpose, because it has been a deep Survey reference field for every imaging X-ray satellite following ROSAT, i.e. ASCA, BeppoSAX, Chandra, and finally XMM-Newton, covering a time base of about 13 years [32, 33, 34, 3]. Figure 3 shows the light curves for two of the sources for which spectra are presented in Figure 2, the Seyfert-2 galaxy ROSAT #12A and the QSO #32A. The black points with error bars (almost invisible for #32A) give the 0.5-2 keV flux as a function of time, based on ROSAT PSPC, ROSAT HRI, Chandra HRC and XMM-Newton EPIC data. It is surprising to see, that both the absorbed and the unabsorbed AGN show long-term time variations of up to a factor of five. The red data points connected with dashed lines show the corresponding 2-10 keV flux (based only on XMM-Newton) for both sources, which varies significantly hand in hand with the soft X-ray flux. The second XMM-Newton data point of #12A, however, seems to deviate from this correspondence, which may indeed indicate that we are seeing two separate components varying independently. It would definitely be interesting to further monitor this source and to look for other, similar examples of spectral and timing complexity.
The Lockman Hole contains a double-lobed high-redshift cluster of galaxies (see Figure 1 in the North-East of the image) which was expected to lie around a redshift of 1.26 [35]. The new XMM-Newton data now allowed for the first time to determine an X-ray redshift of z=1.13 from the Fe K line of both lobes of the cluster. This is significantly different from the original redshift, which was based on a Keck NIR spectrum of a single central galaxy [36], but has later been confirmed by Keck spectroscopy of two fainter cluster galaxies. The XMM-Newton data can also constrain the chemical abundances of the intergalactic medium of the cluster, for the first time at such a high redshift and rather low luminosity [37].
With the new XMM catalogue in the Lockman Hole we already have been awarded one night of spectroscopy with the powerful DEIMOS wide-field spectrograph, in cooperation with P. Henry (IfA). The observations were taken in March 2003 and reduced by I. Lehmann (MPE). A total of more than 100 spectra could be secured. However, due to the extremely faint optical counterparts only 25 new redshift identifications were obtained, raising the number of identified sources to about 135 in the LH. Further spectroscopy at 4-10m class telescopes is necessary to complete the optical spectroscopy in the Lockman Hole. However, for statistical studies a sample, which is rather complete for 0.5-2 keV fluxes down to erg cm-2 s-1 can be defined currently.
3 The deepest Chandra Fields
The Chandra X-ray Observatory has performed deep X-ray surveys in a number of fields with ever increasing exposure times [38, 11, 2, 21] and has completed a 1 Msec exposure in the Chandra Deep Field South (CDF-S) [12] and a 2 Msec exposure in the Hubble Deep Field North (HDF-N) [4].
The CDF-S was also observed with XMM-Newton for a net exposure of 400 ksec in July 2001 and January 2002 (PI: J. Bergeron, see [39]). The EPIC cameras have a larger field-of-view than ACIS, and a number of new diffuse sources are detected just outside the Chandra image. Similar to the LH, X-ray spectroscopy of a large number of sources will ultimately be very powerful with XMM-Newton [30].
3.1 VLT optical spectroscopy
Optical spectroscopy in the CDF-S has been carried out in 11 nights with the ESO Very Large Telescope (VLT) in the time frame April 2000 - December 2001, using deep optical imaging and low resolution multiobject spectroscopy with the FORS instruments with individual exposure times ranging from 1-5 hours. Some preliminary results including the VLT optical spectroscopy have already been presented [20, 12]. The complete optical spectroscopy is published in [9].
Redshifts could be obtained so far for 169 of the 346 sources in the CDF-S, of which 144 are very reliable (high quality spectra with 2 or more spectral features), while the remaining optical spectra contain only a single emission line, or are of lower S/N. For objects fainter than R=24 reliable redshifts can be obtained if the spectra contain strong emission lines. For the remaining optically faint objects, and those not covered by the multiobject spectroscopy, we have to resort to photometric redshift techniques [40, 41, 13]. For a subsample at off-axis angles smaller than 10 arcmin we obtain a spectroscopic completeness of about 50%. Including photometric redshifts this completeness increases to 96%.
3.2 X-ray/optical classification
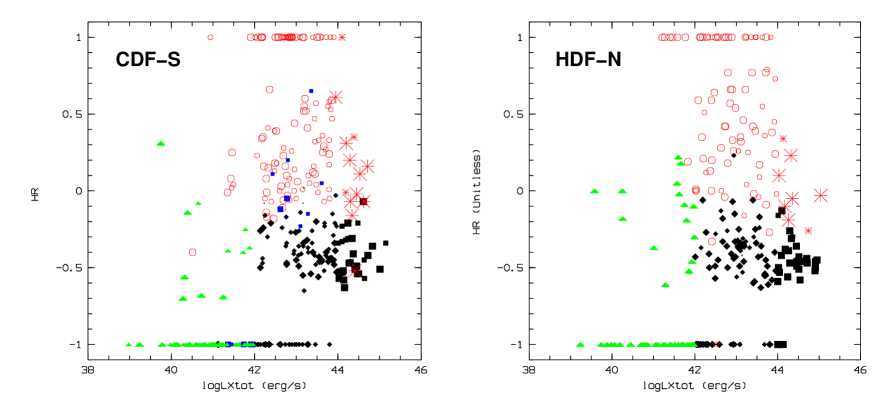
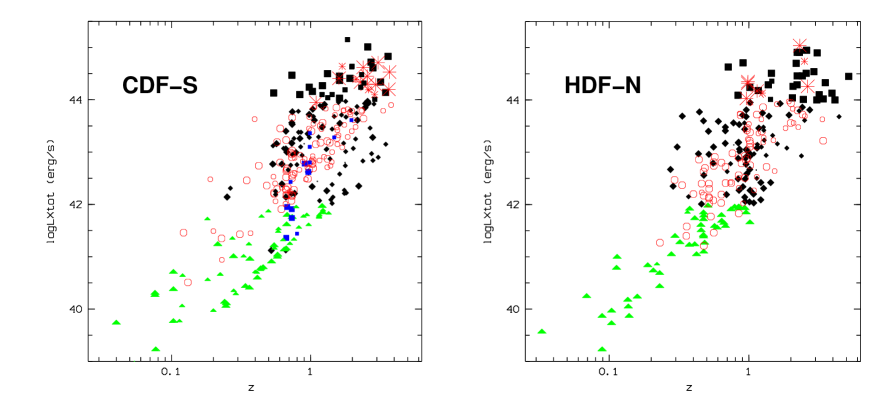
Following [12, 39] we show in Figure 4 left the hardness ratio as a function of the luminosity in the 0.5-10 keV band for 169 sources for which we have optical spectra and rather secure classification in the CDF-S [9] (large symbols) and about 170 objects with photometric redshifts [13] (small symbols). The X-ray luminosities are not corrected for internal absorption and are computed in a ’consensus cosmology’ with = 70 km s-1 Mpc-1, and . Different source types are clearly segregated in this plane. Type-1 AGNs (black diamonds) have luminosities typically above erg s-1, with hardness ratios in a narrow range around HR-0.5. Type-2 AGN are skewed towards significantly higher hardness ratios (HR0), with (absorbed) luminosities in the range erg s-1. Direct spectral fits of the XMM-Newton and Chandra spectra clearly indicate that these harder spectra are due to neutral gas absorption and not due to a flatter intrinsic slope (see [28, 42]). Therefore the unabsorbed, intrinsic luminosities of type-2 AGN would fall in the same range as those of type-1’s.
In Figure 4 we also indicate the type-2 QSOs (asterisks), the first one of which was discovered in the CDF-S [20]. In the meantime, more examples have been found in the CDF-S and elsewhere [21]. It is interesting to note that no high-luminosity, very hard sources exist in this diagram. This is a selection effect of the pencil beam surveys: due to the small solid angle, the rare high luminosity sources are only sampled at high redshifts, where the absorption cut-off of type-2 AGN is redshifted to softer X-ray energies. Indeed, the type-2 QSOs in this sample are the objects at erg s-1 and HR-0.2. The type-1 QSO in this region of the diagram is a BAL QSO with significant intrinsic absorption.
About 10% of the objects have optical spectra of normal galaxies (marked with triangles), luminosities below erg s-1 and very soft X-ray spectra (several with HR=-1), as expected in the case of starbursts or thermal halos. In these galaxies the X-ray emission is likely due to a mixture of hot, thermal gas and a population of low mass X-ray binaries [7], plus possibly some low level AGN activity [43]. Therefore the deep Chandra and XMM-Newton surveys detect for the first time the population of normal starburst galaxies out to intermediate redshifts [38, 2, 34]. These galaxies might become an important means to study the star formation history in the universe completely independently from optical/UV, sub-mm or radio observations [43].
Figure 4 (right) shows the same diagram for the spectroscopic and photometric identifications in the 1Msec catalogue of the HDF-N [27, 8]. While the authors give only purely optical classification information for the X-ray counterparts (basically ”galaxy” or ”broad line object”), we have applied the above X-ray/optical classification scheme also to their catalogue. The corresponding diagram shows basically the same features: the X-rays show that type-1 (mainly broad-line) AGN cluster around HR-0.5 and break the degeneracy between type-2 Seyferts and normal galaxies.
The CDF-S identification catalogue [9] includes 8 type-2 QSOs at redshifts above 2 (see figure 3 left), which all are characterised by strong and narrow UV emission lines (Lyman-, CIV etc.) with almost absent continuum. Additionally, there are three objects with photometric redshifts, luminosities and hardness ratios consistent with type-2 QSOs., The corresponding HDF-N catalogue [27] lists only two possible type-2 QSOs at such high redshifts and one additional photometric candidate [8]. A closer look at Figure 5 and the optical magnitudes of the CDF-S type-2 QSO shows that these objects are predominantly detected at optical magnitudes R 24. One reason for the relative absence of this population in the HDF-N could be that a smaller number of identifications at R exist in this survey compared to the CDF-S. However, a true field to field variation (cosmic variance) or statistical fluctuation cannot be ruled out.
4 Redshift and luminosity distributions for different AGN types
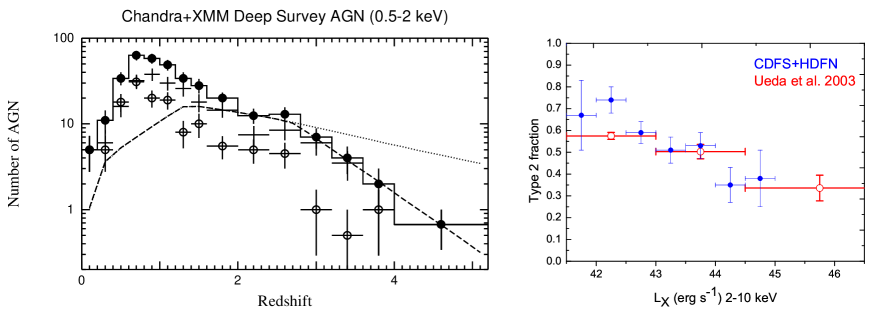
The current spectroscopic/photometric completeness of the CDF-S and HDF-N identifications allows to compare the observed redshift distribution with predictions from X–ray background population synthesis models, which, due to the saturation of the QSO evolution predict a maximum at redshifts around z=1.5. Figure 6 shows two predictions of the redshift distribution from the Gilli et al. model [16] for a flux limit of erg cm-2 s-1 in the 0.5-2 keV band with different assumptions for the high-redshift evolution of the QSO space density. The model curves have been normalized to fit the observed distribution in the redshift range 2-2.4.
The actually observed redshift distribution of AGN selected from the HDF-N and CDF-S Chandra deep survey samples at off-axis angles below 10 arcmin and in the 0.5-2 keV band is shown in Fig. 5 (left) as histogram and data points (solid circles). In the redshift range below 1.5 it is radically different from the prediction, with a peak at redshift z0.7. This low redshift peak is dominated by Seyfert galaxies with X-ray luminosities in the range erg s-1. This figure also shows, that the redshift distributions separated into type-1 AGN (crosses) and type-2 AGN (crosses with open circles) both peak significantly below z=1, which is not consistent with some recent population models, where the low redshift peak was assumed to be mainly in the type-2 AGN population [17, 18].
Since the peak in the observed redshift distribution is expected at the redshift, where the strong positive evolution of AGN terminates, we can conclude that the evolution of Seyfert galaxies is significantly different from that of QSOs, with their evolution saturating around a redshift of 0.7, compared to the much earlier evolution of QSOs which saturates at z1.5 [46]. The statistics of the two samples is now sufficient to rule out the constant space density model at redshifts above 3, clearly indicating a decline of the X-ray selected QSO population at high redshift consistent with the optical findings.
Figure 6 (right) shows the ratio of type-2 AGN to all AGN selected in the 2-10 keV band for both the CDF-S and HDF-N (spectroscopic as well as photometric redshifts) as a function of the 2-10 keV luminosity. As already indicated by Ueda et al. [22] and confirmed by Szokoly et al. [9] there is a strong dependence of the fraction of type-2 AGN, i.e. the ratio of type-2 over all AGN as a function of luminosity. While the type-2 fraction at low luminosities is consistent with the local ratio of optically selected Seyfert galaxies [47] of about 4:5, at high luminosities the ratio is 1:3. This indicates a breakdown of the ’strong unification’ model, where the covering factor is independent of luminosity and redshift. A possible explanation of this trend may be, that high luminosity objects are able to ’clean out’ their environment by ionizing the circumnuclear matter and/or producing strong outflows, while low luminosity objects are largely surrounded by the circumnuclear starburst region they are feeding from (see e.g. [48]).
These, still preliminary, new results paint a dramatically different evolutionary picture for low-luminosity AGN compared to the high-luminosity QSOs. While the rare, high-luminosity objects can form and feed very efficiently rather early in the universe, the bulk of the AGN has to wait much longer to grow. This could indicate two modes of accretion and black hole growth with different accretion efficiency, as e.g. proposed in [49]. The late evolution of the low-luminosity Seyfert population is very similar to that which is required to fit the Mid-infrared source counts and background (see e.g. [17]), however, contrary to what has been assumed by Franceschini et al., this evolution applies to all low-luminosity AGN (type-1 and type-2).
These results, however, have still to be taken with a grain of salt. First, the spectroscopic incompleteness in the Chandra samples is still substantial and before a formal publication of all spectroscopic and photometric redshifts is available, it is too early to draw final conclusions.
Acknowledgments
I thank my colleagues in the the Chandra Deep Field South team and the Lockman Hole team, but in particular X. Barcons, J. Bergeron, H. Böhringer, A. Fabian, R. Giacconi, R. Gilli, P. Henry, I. Lehmann, V. Mainieri, C. Norman, P. Rosati, M. Schmidt, G. Szokoly, W. Zheng, for the good cooperation and the permission to use some data in advance of publication.
References
- [1] Hasinger G., Burg R., Giacconi R., et al., 1998, A&A 329, 482
- [2] Giacconi R., Rosati P., Tozzi P., et al., 2001, ApJ 551, 624
- [3] Hasinger G., Altieri B., Arnaud M., et al., 2001, A&A 365, 45
- [4] Alexander D.M., Bauer F.E., Brandt W.N., et al., 2003, AJ 126, 539
- [5] Schmidt M., Hasinger G., Gunn J.E., et al., 1998, A&A 329, 495
- [6] Lehmann I., Hasinger G., Schmidt M., et al., 2001, A&A 371, 833
- [7] Barger A. J., Cowie L. L., Mushotzky R. F., Richards, E. A., 2001, AJ 121, 662
- [8] Barger A.J., Cowie L.L., Capak P., et al., 2003, AJ 126, 632
- [9] Szokoly G., Bergeron J., Hasinger G., et al., 2003 (ApJS submitted)
- [10] Fiore F., Brusa M., Cocchia F., et al., 2003, A&A 409, 79
- [11] Hornschemeier A.E., Brandt W.N., Garmire G.P., et al., 2000, ApJ 541
- [12] Rosati P., Tozzi P., Giacconi R., et al., 2002, ApJ 566, 667
- [13] Zheng W., et al., 2003, in prep.
- [14] Comastri A., Setti G., Zamorani G., Hasinger G., 1995, A&A 296, 1
- [15] Fabian A.C., Barcons X., Almaini O., Iwasawa K., 1998, MNRAS 297, L11
- [16] Gilli R., Salvati M., Hasinger G., 2001, A&A 366, 407
- [17] Franceschini A., Braito V. & Fadda D., 2002, MNRAS 335, L51
- [18] Gandhi P. & Fabian A.C., 2003, MNRAS 339, 1095
- [19] Gilli R., 2003, Adv. Space Res. in press (astro-ph/0303115)
- [20] Norman C., Hasinger G., Giacconi R., et al. 2002, ApJ 571, 218
- [21] Stern D., Moran E.C., Coil A.L., et al., 2002, ApJ 568, 71
- [22] Ueda Y., Akiyama M., Ohta K., Miyaji T., 2003, astro-ph/0308140;
- [23] Hasinger G. & the CDFS team, 2003, astro-ph/0302574
- [24] Cowie L.L., Barger A.J., Bautz M.W., et al., 2003, ApJ 584, L57
- [25] Schmidt M., Hasinger G., Miyaji T., 2004, in prep
- [26] Gilli, R., Cimatti, A., Daddi, E., et al., 2003, ApJ 592, 721
- [27] Barger, A. J., Cowie, L. L., Brandt, W.N. et al., 2002, AJ 124, 1839
- [28] Mainieri V., Bergeron J., Rosati P., et al., 2002, A&A 393, 425
- [29] Granato G.L., Danese L., & Franceschini A. 1997, ApJ, 486, 147
- [30] Streblyanska, A, Bergeron, J., Brunner H., et al., 2003, astro-ph/0309089
- [31] Komossa S., Burwitz V., Hasinger G., et al., 2003, ApJ 582, L15
- [32] Ishisaki Y., Ueda Y., Yamashita A., et al., 2001, PASJ 53, 445
- [33] Giommi P., Perri M., Fiore F., 2000, A&A 362, 799
- [34] Lehmann I., Hasinger G., Murray S.S, Schmidt M., 2002, ASP Conf. Proc. 262, p.105 (astro-ph/0109172)
- [35] Hashimoto Y., Hasinger G., Arnaud, M. et al., 2002, A&A 381, 841
- [36] Thompson D., Pozzetti L., Hasinger G., et al., 2001, A&A 377, 778
- [37] Hashimoto Y., Barcons, X., Böhringer H., et al., 2003, A&A submitted
- [38] Mushotzky, R.F., Cowie L.L., Barger, A.J., Arnaud, K.A., 2000, Nature 404, 459
- [39] Hasinger, G., Bergeron, J., Mainieri, V., et al., 2002, ESO Messenger 108, 11
- [40] Wolf C., Dye, S., Kleinheinrich, M., et al., 2001, A&A 377, 442
- [41] Mainieri V., et al., 2002, priv. comm.
- [42] Bauer F.E., Vignali C., Alexander D.M., et al., 2003, AN 324, 8
- [43] Norman C., Ptak A., Hornschemeier A., et al., 2003, ApJ (submitted)
- [44] Schmidt, M., Schneider, D.P. & Gunn J.E., 1995, AJ 114, 36
- [45] Fan X., Strauss M., Richards G., et al., 2001, AJ 121, 31
- [46] Miyaji, T., Hasinger, G., Schmidt, M., 2000, A&A 353, 25
- [47] Huchra J. & Burg R., 1992, ApJ 393, 90
- [48] Fabian A.C., 1999, MNRAS 308, L39
- [49] Duschl, W.J., Strittmatter, P.A., in Active Galactic Nuclei: from Central Engine to Host Galaxy Abstract Book, meeting held in Meudon, France, July 23-27, 2002, Eds.: S. Collin, F. Combes and I. Shlosman. To be published in ASP (Astronomical Society of the Pacific), Conference Series, p. 76.
- [50] Schmidt M., Hasinger G., Miyaji, T. in: Symposium in honour of Joachim Tr mper s 65th birthday, MPE report 272, 213
- [51] Miyaji, T., Hasinger, G., Schmidt, M., A&A 369, 49 (2001)