When Is a Bulge Not a Bulge? Inner Disks Masquerading as Bulges in NGC 2787 and NGC 3945
Abstract
We present a detailed morphological, photometric, and kinematic analysis of two barred S0 galaxies with large, luminous inner disks inside their bars. We show that these structures, in addition to being geometrically disk-like, have exponential profiles (scale lengths –500 pc) distinct from the central, non-exponential bulges. We also find them to be kinematically disk-like. The inner disk in NGC 2787 has a luminosity roughly twice that of the bulge; but in NGC 3945, the inner disk is almost ten times more luminous than the bulge, which itself is extremely small (half-light radius pc, in a galaxy with an outer ring of radius kpc) and only % of the total luminosity — a bulge/total ratio much more typical of an Sc galaxy. We estimate that at least 20% of (barred) S0 galaxies may have similar structures, which means that their bulge/disk ratios may be significantly overestimated. These inner disks dominate the central light of their galaxies; they are at least an order of magnitude larger than typical “nuclear disks” found in ellipticals and early-type spirals. Consequently, they must affect the dynamics of the bars in which they reside.
1 Introduction
The presence of stellar disks around the nuclei of early-type galaxies has attracted growing interest in recent years (e.g. Scorza & van den Bosch, 1998, and references therein). The complexity of the central regions of these galaxies was nicely demonstrated in the survey by Rest et al. (2001), who used WFPC2 images from the Hubble Space Telescope (HST) to disentangle the detailed morphology of 67 E and S0 galaxies, finding embedded stellar disks around the nucleus in over half their sample. Unambiguous interpretation of detail observed in two dimensions is often difficult, however; this was illustrated by Rest et al., who suggested that as over half of the circumnuclear “disks” detected in their survey appear misaligned with the main galaxy, they are more probably in fact circumnuclear bars.
This highlights a general problem: since many reported nuclear disks have been observed in an essentially edge-on configuration, it is easier to show that they are thin than it is to show that they are round. There is thus considerable scope for morphological confusion. This is the case, for example, in the study by Seifert & Scorza (1996), who found a significant number of S0 galaxies with an inner disk as well as an outer disk. The inner disk was revealed by subtracting off the bulge component, and showed up clearly as having a photometric profile with a steeper slope than that of the larger outer disk. However, because the galaxies studied by Seifert & Scorza were all edge-on, the disk-bar ambiguity alluded to above cannot be readily tackled.
In a study of moderately inclined or face-on barred S0–Sa galaxies, Erwin & Sparke (2002) found numerous inner structures residing inside the bars. In the S0 galaxies, they found — with roughly equal frequency — both inner bars and what they termed “inner disks.” The latter was an ad-hoc, provisional classification: elliptical (in projection) stellar structures aligned with the outer disk, apparently distinct from the innermost bulge or nucleus. Some of these inner disks could plausibly be inner bars with chance alignments; nonetheless, the large number of such structures, their larger sizes when compared to the inner bars, and the fact that they were restricted almost entirely to the S0 galaxies, all suggested a population distinct from inner bars. This reinforces the ambiguity noted above — early-type galaxies can have inner disks and inner bars, which may not be easily distinguished when seen edge-on. But because the Erwin & Sparke galaxies are not edge-on, it is somewhat easier to determine the geometry of these structures.
Some of these putative inner disks are quite large — well over a kiloparsec in size, or up to % of their galaxy’s 25th-magnitude radius (). In addition, some are as large as % of the size of the bars they were found inside, which raises some intriguing dynamical questions: how did such large inner structures form, and how can they coexist with the bars?
An equally significant issue is this: given that early-type disk galaxies can have distinct inner disks, how often might inner disks in the more face-on galaxies — where we cannot easily identify the (spheroidal) bulge by the fact that it protrudes above and below the disk — be mistaken for bulges? If, as is often the case, bulges are only defined photometrically (as an inner excess in the surface brightness profile over the extrapolated outer disk profile), then a high surface-brightness inner disk, distinct from the outer disk, could be (mis)classified as the galaxy’s bulge. Such a “pseudobulge” (Kormendy, 2001; Kormendy & Gebhardt, 2001) is a plausible result of bar-driven gas inflow, followed by star formation (Kormendy, 1993); the result would be a high-surface-brightness disk (not necessarily exponential) inside the main disk.
This issue was raised over twenty years ago by Kormendy (1982a, b), who studied the bulge kinematics of both barred and unbarred (Kormendy & Illingworth, 1983) galaxies. While the unbarred bulges — and some of the barred bulges — had kinematics consistent with the classical model of bulges as small, rotationally supported ellipticals, several of the bulges in barred galaxies had kinematics dominated by rotation. Thus, kinematically at least, some “bulges” appeared to be more like disks. Morphological evidence that some bulges are disk-like was discussed by Kormendy (1993). This includes cases where disk structures (e.g., spirals, bars, and star formation) are clearly visible within the (photometric) bulge region; the set of examples has been expanded by HST imaging of spiral galaxy centers (e.g., Carollo et al., 1997; Carollo, Stiavelli, & Mack, 1998). Morphologies such as this indicate that the inner regions can have significant, even dominant, disk components, though they do not necessarily exclude a classical bulge component as well. Kormendy also pointed out that the quasi-2D bulge-disk decompositions of Kent (1985, 1987) include a number of galaxies where the derived ellipticity of the “bulge” component is equal to or greater than that of the disk, suggesting that the inner light is dominated by a disk or flattened triaxial structure (e.g., a small bar).
In this paper we explore these issues by examining in detail, photometrically and also kinematically, two of the inner-disk galaxies studied by Erwin & Sparke (2002, 2003). These objects — the SB0 galaxies NGC 2787 and NGC 3945 — are two of the strongest candidates for having large, distinct inner disks. We use a combination of ground-based and HST images to test how disk-like their inner structures actually are. We find that they are plausible geometric disks: that is, they are consistent with approximately round, flat structures seen at the same inclination as the rest of the galaxy. We also find that they have smooth exponential radial light profiles, similar to those of many outer disks of spiral and lenticular galaxies. In addition, they are clearly distinct from the smaller, rounder and non-exponential bulges at their centers. Finally, we find at least some evidence that they are kinematic stellar disks: they are dynamically cool, and probably dominated by circular motions. In this, we are following Kormendy (1982a, 1993) who drew attention to the relatively fast rotation and low velocity dispersion in the “bulge” region (within 20″ of the center) of NGC 3945, arguing that this region was kinematically much more like a disk than a bulge.
The existence of disks of this sort — and confirmation that they are distinct from central bulges — points to a problem for identifying and measuring bulges in early-type barred galaxies: what fraction of the classical bulge is really a disk, i.e. a planar and kinematically cool component, rather than a spheroidal, hot component? We show that for these two galaxies this problem is quite real. In galaxies with this composite morphology, the classical decomposition of the galaxy as a whole into an outer disk and an inner bulge can give very misleading results. Nonetheless, the existence of inner disks helps to solve the problem that they themselves create, since at least in some cases the “true” spheroidal bulge component — rounder, kinematically hot and, in these cases, non-exponential — can be cleanly separated from an inner disk, using unequivocal photometric criteria. By effecting such a separation for the present galaxies we show that past analyses have dramatically overestimated their bulge sizes. For NGC 3945 we find that the true bulge is astonishingly small: its half-light radius is just over 100 pc, in a galaxy with a bar of radial length 5 kpc, and an outer ring of radius 14 kpc; the bulge accounts for only % of the total luminosity, a figure more typical of Sc galaxies than of S0 galaxies. In NGC 2787, the bulge is larger (half-light radius pc and % of the total luminosity), but the presence of the inner disk produces a radial surface-brightness profile which can lead one to overestimate the bulge size by factors of 2–5.
2 An Overview of the Galaxies
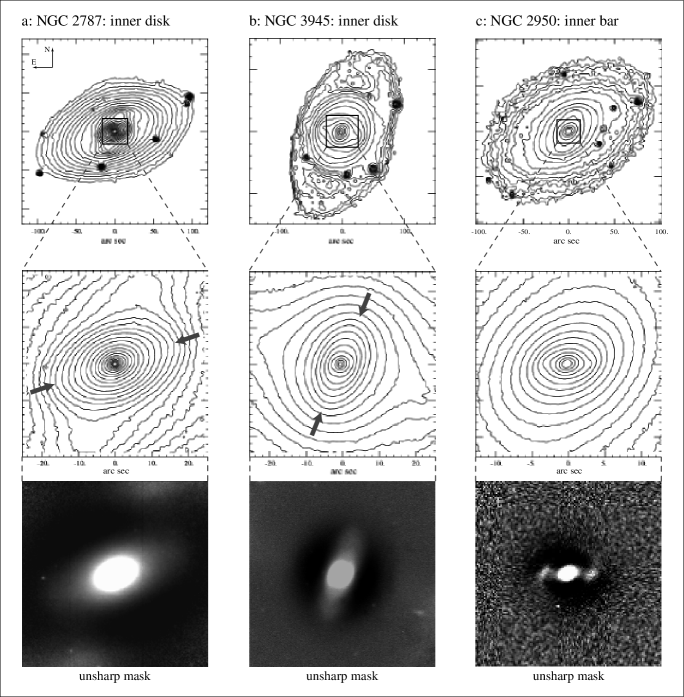
NGC 2787 and NGC 3945 are nearby SB0 galaxies; both are listed in Buta et al. (1994) as “representative” of Hubble type S. General parameters for each are given in Table 1, and isophotal maps from our -band images can be seen in Figure 1. For NGC 2787, a surface-brightness fluctuation distance is available (Tonry et al., 2001); for NGC 3945, we use the redshift with a correction for Virgo-centric infall from the Lyon-Meudon Extragalactic Database (LEDA)111http://leda.univ-lyon1.fr and assume Mpc-1. The morphology of NGC 2787 is discussed in more detail in Erwin & Sparke (2003), while NGC 3945 was analyzed in Erwin & Sparke (1999). We summarize some basic characteristics of each here.
NGC 2787 has been mapped in H I by Shostak (1987), who found a ring with major axis (larger than the visible stellar disk). Because the position angle (140°) and apparent inclination (assuming the ring is intrinsically round) are different from that of the optical disk, it suggests that this outer neutral gas is misaligned with the stellar disk. A large bar embedded in a lens lies within the disk; the inner disk is inside the bar. Much further in, the LINER nucleus has been shown to have broad H emission (Ho et al., 1997), and Sarzi et al. (2001) found evidence for a solar-mass black hole, using HST spectroscopy. Sarzi et al. also pointed out the spectacular tilted dust rings in the central regions (see their Figure 3 and Figure 2 of Erwin & Sparke 2002). This latter feature, combined with the H I misalignment, prompted Erwin & Sparke (2002, 2003) to classify this galaxy as having off-plane gas in the central regions. Recent emission-line spectroscopy at several position angles confirms this; we discuss this briefly below (see also Vega Beltrán et al., 2003).
NGC 3945 is about five times more luminous than NGC 2787, and almost five times larger in radius as well.222Comparing in kpc. There is no clear outer disk in NGC 3945; instead, there is, from the outside in, a bright, slightly asymmetric outer ring, a lens (noted by Kormendy, 1979), bounded by a dusty inner ring, and then the outer bar. The lens appears perpendicular to the bar; this is probably a projection effect, since lenses are almost always elongated parallel to bars. Inside the outer bar is the inner disk, which has been noted at least as far back as Kormendy (1979); it has variously been described as a “secondary bar” (Kormendy, 1979; Wozniak et al., 1995) and a “triaxial bulge” (Kormendy, 1982a). Erwin & Sparke (1999) used HST images to show that there was a stellar nuclear ring inside the inner disk, and a probable secondary bar inside that ring.
3 Data
3.1 Imaging
The primary imaging data are ground-based and images obtained with the 3.5 m WIYN Telescope in Tucson, Arizona, and archival HST WFPC2 images in the F450W, F555W, and F814W filters (corresponding to , and , respectively).333The WIYN Observatory is a joint facility of the University of Wisconsin-Madison, Indiana University, Yale University, and the National Optical Astronomy Observatories. The WIYN images were obtained under non-photometric conditions and are not calibrated; see Erwin & Sparke (2003) for more details of these observations. We do calibrate the HST data, in part because our measurements of bulge and inner-disk luminosities are based on the HST images. For NGC 2787, we also obtained an -band image during service/queue time (11 February 2003) with the INGRID imager on the 4.2m William Herschel Telescope in La Palma, Spain; this is a near-IR imager with 0.242″ pixels.
The WFPC2 images were processed by the standard, “on-the-fly” archival pipeline, then coadded with the iraf task crrej, part of the stsdas package (inspection of stars and galactic nuclei in the Planetary Camera [PC] images showed alignment of separate exposures to within pixels, so the images were combined without shifting). Sky subtraction was done using median pixel values in the parts of the Wide Field (WF) chips least contaminated by galaxy light.
The photometric calibration of the PC images follows the recommendations in Holtzman et al. (1995), as used by, e.g., Stiavelli et al. (2001). We converted (sky-subtracted) counts per second per pixel in the F555W and F814W images to instrumental magnitudes per square arc second and ; these were then transformed to surface brightness in and using the following equations (based on Eqn. 8 in Holtzman et al.):
| (1) | |||||
| (2) | |||||
The various parameters are taken from Table 7 in Holtzman et al., with an offset of 0.1 magnitudes added to the zero points to convert to infinite aperture (see Holtzman et al.); the gain ratio (GR) used was that of the PC chip (1.986). Using an initial guess for , we iterated until the resulting values differed by less than 0.01 magnitudes; as Stiavelli et al. found, this generally takes only three iterations. Similar calibrations were made for F450W with respect to F555W (using parameters from Table 10 of Holtzman et al. for the F450W filter).
We made corrections for Galactic extinction using the values from Table 1, assuming that , and (with F450W, F555W, and F814W equivalent to , , and , respectively).
3.2 Spectroscopy
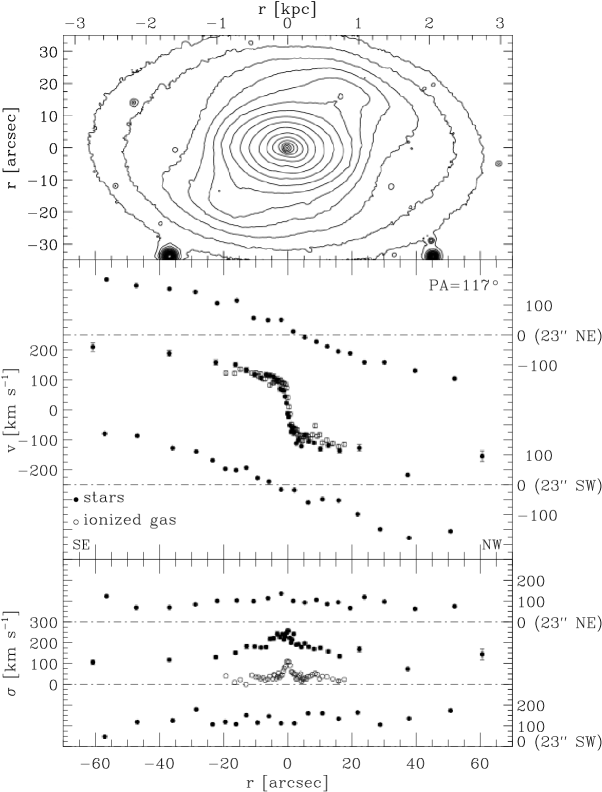
For NGC 2787, we were able to find raw spectroscopic data in the Isaac Newton Group Archive, from observations made with the ISIS spectrograph on the William Herschel Telescope in 1995. These spectra were taken at three parallel slit positions, all at PA = 117° (close to the major axis): one through the nucleus and two offset spectra (Figure 2). The reduction and analysis of these data are discussed below.
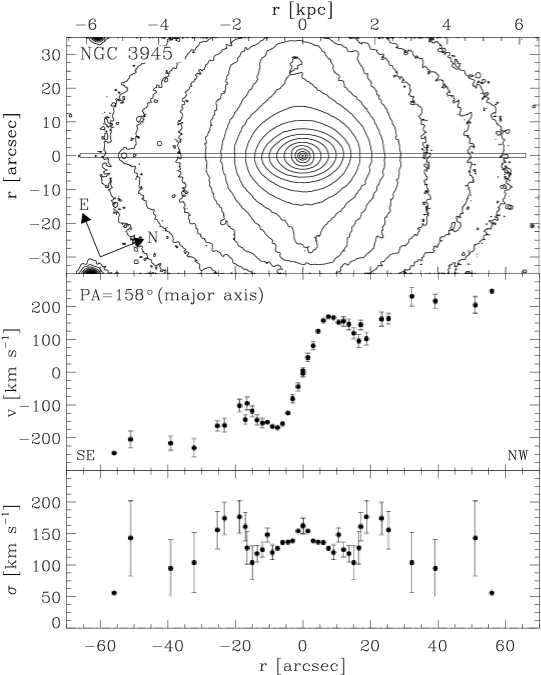
For NGC 3945, we relied on the observations of Kormendy (1982a), derived from his Figure 3 and Table 5. The major-axis (PA = 159°) velocity and velocity dispersion data points from the figure were averaged for each radius, with appropriate propagation of the errors (Figure 3); the spectrum was obtained with seeing of 1–2″. A second set of data is the stellar and gaseous kinematics published by Bertola et al. 1995 (kindly made available to us by Enrico Corsini); however, these go out to only and appear to have much lower S/N than the Kormendy data. They are useful for determining the kinematic orientation of the galaxy (i.e., which side is approaching), since the Kormendy data are folded curves, plotted as functions of radius only.
3.2.1 Spectroscopic Data Reduction
After retrieval from the archives, the NGC 2787 spectra were bias subtracted, flat-field corrected, cleaned of cosmic rays and wavelength calibrated using standard MIDAS444MIDAS is developed and maintained by the European Southern Observatory. routines. Cosmic rays were identified by comparing the counts in each pixel with the local mean and standard deviation (as obtained from the Poisson statistics of the photons, knowing the gain and readout noise of the detector), and then corrected by interpolating a suitable value.
The instrumental resolution was determined as the mean of the Gaussian full-width half-maxima (FWHM) measured for a dozen unblended arc-lamp lines distributed over the whole spectral range of a wavelength-calibrated comparison spectrum. The mean FWHM of the arc-lamp lines, as well as the corresponding instrumental velocity dispersion, are given in Table 2. Finally, the individual exposures of the same slit position were aligned and coadded using their stellar-continuum centers as reference. For each resulting spectrum the center of the galaxy was defined by the center of a Gaussian fit to the radial profile of the stellar continuum. The contribution of the sky was determined from the edges of the resulting spectrum and then subtracted; NGC 2787 is small enough relative to the ISIS slit (slit length ) that galaxy contamination is not a problem.
3.2.2 NGC 2787: Measuring stellar and ionized gas kinematics
The stellar kinematic parameters were measured from the absorption lines present on each spectrum using the Fourier Correlation Quotient Method (Bender, 1990), as applied by Bender, Saglia, & Gerhard (1994). The spectrum of the K0 star HD 68771, observed during the same night, provided the best match to the galaxy spectra, and was used as template for measuring the stellar kinematic parameters of the galaxy. For each spectrum we measured the radial profiles of the heliocentric stellar velocity , velocity dispersion , and the Gauss-Hermite coefficients and (the latter two parameters where there was sufficiently high S/N). The stellar kinematics are tabulated in Tables 3 and 4.
The ionized gas kinematics were obtained using the [O III] emission. The position, FWHM, and uncalibrated flux of the emission line were individually determined by interactively fitting a single Gaussian to each emission line and a polynomial to its surrounding continuum, using the MIDAS package ALICE. The wavelength of the Gaussian peak was converted to velocity and the standard heliocentric correction was applied to obtain the ionized gas heliocentric velocity . The Gaussian FWHM was corrected for the instrumental FWHM and then converted to velocity dispersion . At some radii where the intensity of the emission lines was low, we averaged adjacent spectral rows to improve the signal-to-noise ratio. The ionized-gas kinematic parameters of NGC 2787 are listed in Table 3. We derived the heliocentric systemic velocity as the velocity of the center of symmetry of the rotation curve of the gas.
4 Morphology and Ellipse Fits: Inner Disks as Geometric Disks
One of the aims of this study is to check whether the “inner disk” identifications tentatively made by Erwin & Sparke (2002, 2003) make sense: are these inner structures actually disk-like? Erwin & Sparke distinguished inner disks from inner bars by requiring that the position angle differ from that of the outer disk by less than 10°, and that the maximum isophotal ellipticity be less than that of the outer disk. This classification is inherently ambiguous, and will sometimes include inner bars which happen to be aligned with the (projected) outer disk, because the influence of bulge isophotes can produce a low apparent ellipticity for an inner bar. Thus, we would like to be more certain about the actual geometry of the supposed inner disks of NGC 2787 and NGC 3945. In this section, we show that, at least geometrically, the evidence favors the inner structures being disks rather than bars: they are most likely flat, approximately circular structures in the galaxy plane.
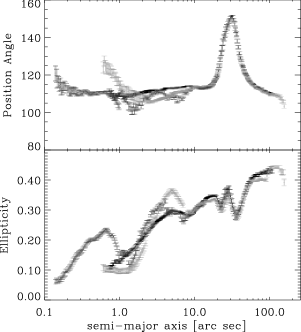
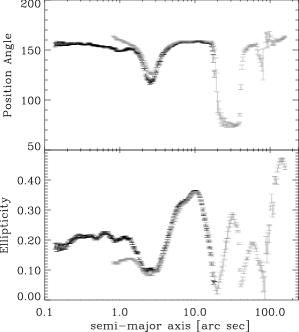
To measure the orientations and shapes of each galaxy’s isophotes, we used the iraf task ellipse, which is based on the algorithm of Jedrzejewski (1987). The position angle and ellipticity of the fitted ellipses, as a function of their semi-major axis, are shown in Figures 4 and 5. Bright stars and other features have been masked out, including the reflected starlight which overlies the -band image of NGC 2787 in the outer disk region. For outer structures such as the large-scale bars and outer disks or rings, we use the -band images; for the inner region where the inner disks dominate, we use the WFPC2 F814W images for their superior spatial resolution (they are also slightly less affected by dust extinction). We also use the INGRID image of NGC 2787; although the resolution (Moffat FWHM , measured from bright stars in the same image) is not as good as that of the HST images, it eliminated most of the dust extinction plaguing the optical images.
For NGC 3945, the maximum ellipticity in the inner zone is at a semi-major axis of , and the PA of the ellipse major axis is 158°. The true ellipticity of the inner disk might be higher, since the isophotes include a contribution from the bar outside. Erwin & Sparke (1999) found this PA to be essentially identical to that of most of the other components in the galaxy: the central bulge (156°), the projected lens (156°), and the outer ring (160°). The measured ellipticity implies an inclination of 52° for the inner disk, assuming that it has an intrinsic axis ratio of 0.2 (typical for galactic disks; e.g., Lambas, Maddox, & Loveday, 1992), or 50° for a geometrically thin disk. Is this similar to the overall orientation of the whole galaxy? The derivation of NGC 3945’s inclination is in fact rather complex, as there is no visible outer disk. Erwin & Sparke (1999) used arguments based on measured optical and H I velocities, and on the axis ratios of the inner ring, lens and outer ring, to argue for an inclination of around 50°, as opposed to 26° proposed previously by Wozniak et al. (1995); this value is very close to estimated by Kormendy (1982a). Thus, the evidence strongly suggests that the inner feature is geometrically disk-like and coplanar with the galaxy as a whole.
For NGC 2787, which does have a clear outer disk, there is less scope for ambiguity. The outer disk’s ellipticity, 0.41, implies an inclination of for the galaxy, with a line of nodes at . The ellipticity and position angle of the inner disk are not easy to measure in the optical images, because of the presence of strong dust lanes from the off-plane gas. Using the -band image, we find an ellipticity of 0.34 and PA . This ellipticity suggests an inclination of 49–50°, if the inner structure is indeed a disk. As we show below, the bulge in this galaxy is relatively large and luminous, so the measured isophotes are probably rounded due to the bulge contribution, and the derived inclination for the inner disk is best seen as a lower limit. Again, the evidence suggests that what Erwin & Sparke (2003) called an inner disk is probably disk-like in at least the geometric sense.
Thus, there are good geometric reasons for considering these two features to be disks. In the following sections, we show that these inner structures are photometrically and kinematically disk-like as well.
5 Photometry, Structure, and Bulge-Disk Decomposition: Evidence for Exponential Disks
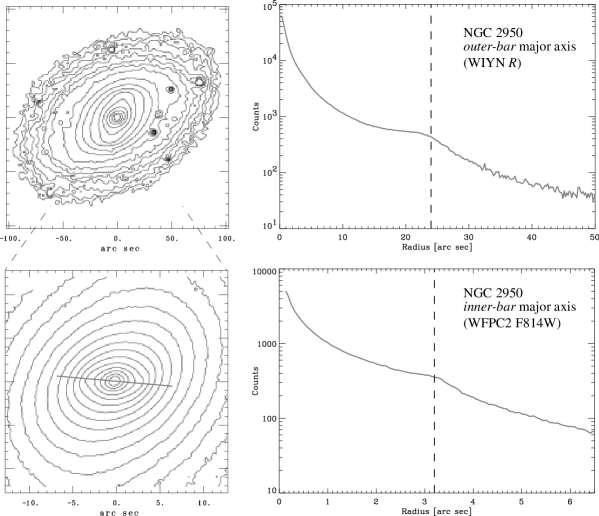
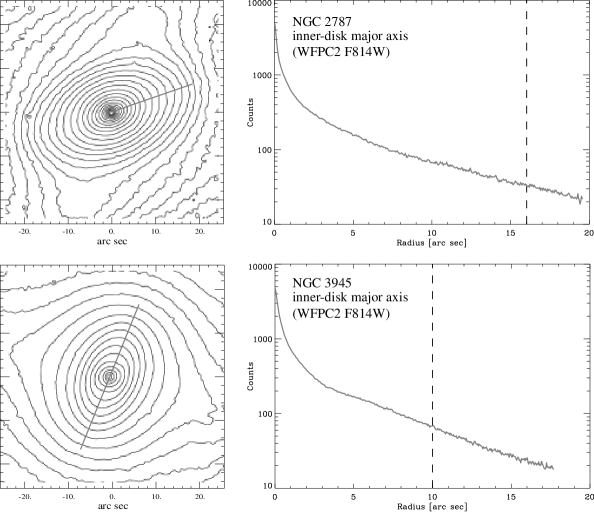
In Figure 1 we compare unsharp masks of the inner regions of our two inner-disk galaxies with an unsharp mask of an inner bar. Bars often produce a clear double-lobed structure in unsharp masks (see, e.g., Figures 4 and 5 of Erwin & Sparke, 2003), roughly corresponding with the sharp ends of the bar. The inner disks, however, produce smooth elliptical features in the unsharp masks. Why is their appearance different? One way to understand this — and to see how the inner disks of NGC 2787 and NGC 3945 are structurally different from typical inner bars — is to plot profiles along the major axes of the inner components. (These unsharp masks also demonstrate that the “inner disk” features in the ellipse fits are not the result of stellar rings, since such rings are easily visible in unsharp masks; see Erwin & Sparke 1999 and Erwin, Vega Beltrán, & Beckman 2001).
In Figures 6 and 7 we compare major-axis profiles of the outer and inner bars in the double-barred galaxy NGC 2950 with major-axis profiles of our two inner disks. These profiles are extracted from 3-pixel-wide cuts along the major axes of each feature. For NGC 3945 and the bar profiles of NGC 2950, these profiles are then folded about the galaxy center. This last step was not done for NGC 2787 because of the strong extinction due to the off-plane dust lanes. Fortunately, the dust lanes are mostly to the SE of the galaxy center; the NW profile plotted in Figure 7 is relatively free of extinction. In each figure, we also indicate the location of maximum ellipticity from the ellipse fits.
The bar profiles are typical examples of the classic “flat bar” shape (e.g., Kormendy, 1982b; Elmegreen & Elmegreen, 1985): a shallow profile which breaks near the radius of maximum ellipticity, with a steep decline outside into (in the case of primary bars) the outer disk. From this we can see that the profiles of the inner disks of NGC 2787 and NGC 3945 do not resemble those of typical bars.
What is striking is how well the inner-disk profiles suggest a classic bulge-disk structure: a small inner bulge, and an exponential “disk” outside. One way to test this idea is to try decomposing these profiles into bulge and disk components. The success of this process is an indication of how well the bulge + disk hypothesis works; it also holds the promise of giving accurate measurements for both components, which will tell us more about the nature of the inner disks and help us understand what kind of bulges these galaxies really have. At this stage the decomposition is merely a hypothesis: we cannot exclude the possibility that these inner disks, while geometrically disk-like, have complex surface-brightness profiles. However, we will argue below that there is some geometric evidence from the ellipse fits that our decompositions are identifying two distinct components: the inner disk itself, and a rounder bulge embedded within it.
We model the profiles as the sum of an exponential profile (for the disk) and a Sérsic (1968) profile:
| (3) |
where is the surface brightness at the half-light radius and is the shape parameter; is a function of (see, e.g., Graham, 2001a). Each component was individually convolved with the same Moffat point-spread function (obtained by fitting stars in the PC images), and the resulting profiles were added linearly together to form a single profile, which was then matched to the observed galaxy profile. A standard non-linear least-squares algorithm was used until convergence on the smallest value was reached; all data points were weighted equally. For NGC 2787, we also added a small point source, for which there is some evidence from previous studies (Sarzi et al., 2001; Peng et al., 2002); this improved the fit considerably in the inner arc second of the profile. This was not necessary for NGC 3945 (there is some evidence in the residuals for a nuclear point source, but it appears to be very weak and does not affect the fits). The fits were done to the profiles extracted from the F814W PC images, as described above.
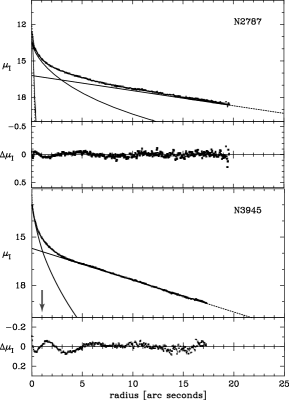
The resulting fits (Figure 8 and Table 5) are an excellent confirmation of the exponential + Sérsic hypothesis. For NGC 3945, we measure an exponential (“disk”) scale length of 5.5″ (530 pc). The inner Sérsic region, which we will refer to as the “bulge,” is quite small and is neither exponential nor de Vaucouleurs in profile; it has Sérsic index and half-light radius pc. The decomposition is rather clean; the small residuals for , all less than 0.1 mag, are probably due to the inner bar and nuclear ring (which affect the isophotes for –6″; Erwin & Sparke, 1999).
For NGC 2787, we find a disk scale length of 8.8″ (320 pc). The bulge component here is larger than, but structurally similar to, that of NGC 3945: Sérsic index and pc. It is also possible to derive a bulge-dominated fit to the NGC 2787 profile, with and , though the fit is not as good. There are two major problems with a bulge-dominated fit for NGC 2787 (beyond the simple fact that the disk+bulge fit is better). First, it implies that the bulge undergoes rapid and significant flattening outwards, which seems implausible; second, if the fitted bulge model is extrapolated outside the inner-disk region, it ends up having a surface brightness higher than that of the galaxy’s major-axis profile (Figure 9). (The same is true for the extrapolated disk in the disk-dominated fit, but disk truncation is dynamically much more plausible; see Section 7.4.) Thus, to explain NGC 2787’s inner disk as purely a bulge, it would have to flatten rapidly to almost disk-like dimensions and have a sharp radial cutoff, something unknown in other bulges. The disk + bulge hypothesis is a simpler and more physically plausible explanation.
Peng et al. (2002) fit the inner region of an F547M WFPC2 image of NGC 2787 using a two-dimensional method. Their preferred fit was with a central Gaussian for the nuclear point source and a combination of a “Nuker-law” profile (Lauer et al., 1995) with and an exponential with and scale length = 7.1″. However, they noted that “the bulge component can also be well fitted by a superposition of a Sérsic ( mag, , and ) and an exponential ( mag and ).” Their two exponential scale length measurements bracket ours, and their Sérsic fit is probably consistent with ours (typical errors for in Sérsic fits are %; Caon, Capaccioli, & D’Onofrio, 1993).555The “luminous stellar disk at the center of the dust disk” which Peng et al. find in their residuals is almost certainly, given its size and orientation, a side effect of the sharp cutoff in dust extinction at , rather than a distinct stellar feature.
Our analysis so far seems to suggest that the inner light of these galaxies can be decomposed into two components: a Sérsic bulge and an exponential disk. Such a photometric decomposition of a one-dimensional profile does not, however, guarantee that there are two distinct morphological components: while stellar disks are often exponential, there is no reason they must be. Could we be dealing with disks whose surface-brightness profiles change with radius, but which remain flat and disk-like into the limits of resolution? In fact, there is morphological evidence that this is not the case, and that there are distinct, albeit small, bulges in both systems.
The ellipse fits to the F814W image of NGC 3945 (Figure 5) clearly show that the isophotes of the inner are parallel with the inner disk and the outer ring, but much rounder. This is consistent with the innermost light being dominated by a mildly oblate component like a bulge. And this is precisely the region dominated by the Sérsic component in our fit (Figure 8). Thus, it is plausible to argue that the inner light of NGC 3945 comes from both a bright inner disk with an exponential profile (with, as well, a nuclear ring and inner bar) and a compact, approximately oblate non-exponential bulge.
The case for NGC 2787 is more complicated, due to the effect of the dust lanes. Nonetheless, the innermost isophotes in the F814W image — at , interior to the dust rings — have ellipticities (Figure 4), which is not consistent with a pure disk morphology. Unfortunately, the INGRID -band image — where the dust rings have the least influence — is too low in resolution to be useful here: the ellipse fits indicate that the isophotes get steadily rounder towards the center, but this is at least partly due to seeing effects.
How far out do the exponential disks extend? For NGC 2787, there is evidence for a truncation at –20″— about 2.5 scale lengths — as can be seen in Figure 9. There is a steeper falloff outside this point, leading to the much shallower profile of the lens at –30″. While it might be argued that this falloff is a signature of the end of a bar, thus suggesting that the inner disk is an inner bar after all, this is unlikely: the maximum ellipticity (at in ) is well inside the turnover point, which is not typical of bars. Moreover, if this turnover does mark the end of an inner bar, then this inner bar is % the size of the outer bar, which is twice the relative size of the largest confirmed inner bars (Erwin, 2003). For NGC 3945, there is no clear truncation; the profile merges with that of the lens at . This is also the point in the ellipse fits where the position angle starts twisting away towards that of the outer bar, which suggests that the disk has, if not actually ceased to exist, become too faint enough to affect the isophotes. So the inner disk in this galaxy can be traced to about 3 scale lengths; it may or may not be truncated. There are dynamical reasons to expect that the disks should be truncated at some point, if the disks are supported by orbits of the bars (the outer bar in the case of NGC 3945), since these orbits do not extend outside the bar region; see Section 7.4.
These inner disks are smaller and have higher central surface brightnesses than is typical for large galactic disks. Figure 10 compares our two inner disks with the -band scale lengths of (outer) disks from the sample of de Jong & van der Kruit (1994). The disk scale lengths are from the seeing-corrected, Sérsic + exponential fits of Graham (2001a) to the azimuthally averaged profiles of de Jong & van der Kruit, corrected for inclination using the axis ratios from de Vaucouleurs et al. (1991, hereafter RC3) and for transparency as described in Section 7.1. The physical scale lengths use kinematic distances from LEDA, as described in Section 2. (We also include approximate disk parameters for the outer disk of NGC 2787, based on an exponential fit to major axis profile, outside the bar region, from the F814W mosaic image.) It can be seen that the inner disks of NGC 2787 and NGC 3945 are outside the range of most of the large disks, though they appear to form a continuation of the – trend or upper envelope (smaller disks tend to have higher central surface brightnesses). In this sense, they are probably part of the overall – trend or envelope suggested by, e.g., Scorza & van den Bosch (1998) in the band for a wide range of disks, including the nuclear disks of ellipticals.
6 Kinematic Evidence for Disks and Resonances
Having established that the inner structures in these two galaxies are probably disk-like in geometry, and similar to typical large-scale disks photometrically, we now turn to the issue of whether they are kinematically disk-like. Lacking detailed, two-dimensional spectroscopy, we restrict ourselves to asking the following questions: Do the stellar kinematics appear to be dominated by rotation, as is typical for disks? Or are they mixtures of random motions and rotation consistent with models of rotationally flattened, isotropic spheroids — the standard models for bulges? We also use rotation curves to look for resonances: since both of the inner disks are found within strong bars, it is crucial to understand how the disks interact with bar resonances in order to understand their dynamical nature, and possibly their origins as well.
6.1 Comparing Inner Disks with Bulge Models
Kormendy (1982a) first pointed out the kinematic peculiarity of NGC 3945’s “bulge” (i.e., what we consider to be the bulge + inner disk). In a study of nine barred galaxy bulges, he measured stellar rotation velocities and velocity dispersions, and then compared these with predictions from bulge models. One measure of the relative importance of rotation versus random motions is the ratio , with being the maximum rotational velocity within the bulge, and the central or mean velocity dispersion. In simple models for kinematically hot, spheroidal systems — isotropic oblate rotators — there is a direct relationship between and the ellipticity of the bulge (Binney, 1978); this can be approximated as (Kormendy, 1982b). The bulges of unbarred galaxies studied by Kormendy & Illingworth (1983) followed this relation, as did some of the bulges of barred galaxies. However, several barred-galaxy bulges — among them NGC 3945 — were notable for having , indicating either significant velocity anisotropies or dominance by rotation.666 is the ratio of the observed to the predicted value.
To calculate for NGC 2787 and NGC 3945, we use the maximum measured ellipticities of the inner disks — 0.35 for NGC 2787 and 0.36 for NGC 3945 — so the predictions should be seen as upper limits for the bulge models. is taken to be the mean velocity dispersion within the inner-disk region. In both cases, the observed values are too high to be explained by the isotropic oblate rotator model. For NGC 2787, ; for NGC 3945, the ratio is (our ratio is lower than Kormendy’s because we measure a higher ellipticity for the inner-disk region, which in turn leads to a higher predicted ).
An additional argument against the isotropic oblate rotator model for NGC 3945 was made by Kormendy (1982a), comparing the radial and azimuthal velocity dispersions (his Table 5 and Figure 4, which use velocity dispersions from an unpublished minor-axis spectrum). In contrast to the barred S0’s NGC 936 and NGC 4596, where the ratio stays close to 1.0 out to the edge of the bulge-dominated regions, in NGC 3945 this ratio climbs to almost 1.4 in the inner-disk regions. As Kormendy pointed out, the true ratio is probably higher, since observations along both major and minor axes are diluted by contributions from the vertical velocity dispersion . Kormendy interpreted this as evidence for bar kinematics in NGC 3945; however, as we have shown above, the inner disk is almost certainly not barlike. Moreover, Moiseev’s (2002) 2D stellar velocity field of the inner of this galaxy appear regular and typical of circular motion. A ratio is typical for G–M giants in the Milky Way disk (e.g., Table 10.3 in Binney & Merrifield, 1998), again suggesting that we are seeing disk rather than bulge kinematics in the inner disk of NGC 3945.
6.2 Circular Velocities and the Location of Resonances
In this section we obtain approximations to the resonance curves of the two galaxies. Resonance curves are derived from velocity curves by calculating the radial variation of angular velocity , and then the radial variation of , where is the epicyclic frequency, determined as
| (4) |
There are several inherent difficulties in relating these idealized resonance curves to actual resonances in a galaxy, some of which we discuss below. The most pressing problem from the observational standpoint is what type of velocity curve to start with.
In general, gas velocity curves reflect the true circular velocities much better than stellar velocities. Unfortunately, we do not have gas velocities for NGC 3945 (the gas kinematics presented by Bertola et al. 1995 are noisy and do not extend beyond the inner ; Moiseev 2002 suggests that the gas in this region actually counter-rotates with respect to the stars). The major-axis spectrum of NGC 2787 shows what appears to be a good gas rotation curve. However, additional emission-line spectra at several different position angles show that the gas is kinematically misaligned with respect to the stars, with a line-of-nodes close to 70°, in contrast to the optical (stellar) major axis at 109°. This, combined with the distinctive dust lanes, indicates that the ionized gas is orbiting in a plane tilted with respect to the stars, and is in fact counter-rotating; the gaseous kinematics will be presented and discussed further in Vega Beltrán et al. (2003). Consequently, we must use the stellar kinematics to estimate the resonance locations.
Even in an axisymmetric disk, the observed major-axis stellar rotation velocities (corrected for projection effects) will be lower than the circular velocities because velocity dispersion provides some dynamical support against gravity. To recover the circular velocities, we need to make an asymmetric drift correction. Following, e.g., Kormendy (1984), the correction in the disk plane can be written as
| (5) |
where is the volume mass density. This equation presupposes an axisymmetric, disk-dominated system; it also assumes that the velocity ellipsoid points towards the galaxy center everywhere. Again following Kormendy, we assume that can be approximated by the surface brightness (this assumption relies on the disk having an unchanging M/L ratio and a constant scale height; the latter assumption will obviously start to fail where the bulge dominates the surface brightness). For the surface brightness profiles, we use azimuthally averaged surface-brightness profiles from the WIYN -band images (which provide the most complete coverage).
For both galaxies, we have , the observed velocity dispersions along the major axis; this is a combination of and . Ideally, we could determine all three velocity dispersion components with three position angles, but outside of a few isolated points, we do not even have measurements of . Unfortunately, it is not trivial to isolate from alone, or to determine . Various assumptions about the relation between components of the velocity dispersion (i.e., the shape of the velocity ellipsoid) can be made, but these rely on assumptions about the mass distribution or the circular velocities which are probably not true over the regions we are interested in. For example, if the rotation curve is flat, then the epicyclic approximation predicts . Observations suggest that , both for the Milky Way (e.g., Binney & Merrifield, 1998, and references therein) and for NGC 488 (Gerssen, Kuijken, & Merrifield, 1997); but varies from 1.25 (NGC 488 Binney & Merrifield, 1998) to almost 2 (Milky Way dwarfs; Binney & Merrifield, 1998). We adopt, as a compromise, , but note that this is probably not a very good assumption.
To carry out the correction, we fit the observed velocity and velocity dispersion profiles with smooth interpolation functions. When the derivative of the surface-brightness profile is used to calculate the corrected velocities, it introduces a fair amount of noise. Consequently, we also fit the corrected velocities with smooth interpolation functions in order to calculate the frequencies.
Figures 11–13, show the results of these calculations. Figure 11 shows the (deprojected) rotation velocities, the drift-corrected velocities, and the smooth fits used for calculating derivatives. The results for NGC 2787 are reasonable, and in fact the outer velocities ( ) are only slightly higher than those derived by Neistein et al. (1999) for the same galaxy (see their Fig. 1). The corrected velocities at , on the other hand, are probably not reliable, because this is the bulge-dominated region: here, the disk approximations used to derive the drift-corrected velocities are no longer valid, and the observed velocity dispersion is probably a composite of disk and bulge components.
The results for NGC 3945 are somewhat dubious. The most questionable part of the drift-corrected curve is the lens region (roughly, –40″), where the corrected velocity rises to . This is because the velocity dispersion rises rather dramatically within this region (Figure 3), forcing a large correction. A similar rise in velocity dispersion can be seen in the inner part of the unbarred S0 NGC 1553’s lens (Kormendy, 1984) (our unpublished major-axis spectrum of the SB0 NGC 2950 shows a similar rise in in its lens region), and a corresponding peak in its drift-corrected velocity is suggested by Kormendy’s Figure 7. The lens regions are where the the bar dominates the light; they are thus the part of the galaxy furthest from axisymmetry, so asymmetric drift corrections — which assume axisymmetry — are probably least reliable here. As with NGC 2787, the corrections at small radii () may not be very reliable either: though the bulge in NGC 3945 is quite small, the spatial resolution of the original spectrum was . Finally, to specify the curve at , beyond the last measured velocity, we assumed a flat rotation curve beyond the last measured point (); since the H I half-width is ( deprojected; Wardle & Knapp, 1986), the true velocity curve probably continues rising.
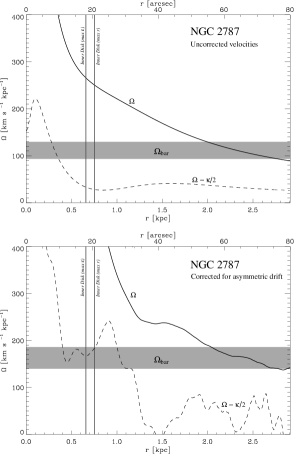
Because of the uncertainties in the asymmetric drift correction, we show in Figures 12 and 13 resonance curves derived from the observed velocities, as well as from the drift-corrected velocities. The truth, we hope, may lie somewhere in between. Superimposed on these curves are crude estimates of the bar pattern speed (outer-bar pattern speed in the case of NGC 3945); the points where this crosses the curves indicate approximate locations of inner Lindblad resonances. For NGC 2787 (Figure 12), we estimate the pattern speed by assuming that the bar ends near corotation (CR), so that CR = 1 to 1.4 ; this is the range observed for bars in S0 galaxies where the pattern speed has actually been measured (Aguerri, Debattista, & Corsini, 2003). For we use the upper limit on bar semi-major axis from Erwin & Sparke (2003), which is 36″ (deprojected ); we use the drift-corrected resonance curve to estimate . The result is –140 or 140–180 , depending on which curve we use. These values are quite high (the pattern speeds found by Aguerri et al. range from 40–100 ), but might be plausible given both the high velocities in NGC 2787 and the small size of the bar ( kpc).
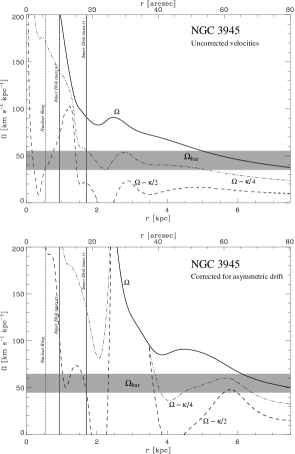
For NGC 3945 (Figure 13), we make the same assumptions, using (deprojected ) from Erwin & Sparke (2003), though the rotation curves do not go out far enough for us to set a reliable lower limit on the pattern speed; the estimate is then –55 . We can also estimate the pattern speed by assuming that the dusty inner ring (at the rim of the lens, with measured along the primary bar major axis) is near the inner ultra-harmonic resonance ( resonance) of the primary bar, where , since simulations and observations both suggest this connection (e.g., Buta & Combes, 1996; Buta et al., 2001); this yields –45 . Very roughly, then, we can argue that –55 for NGC 3945.
It is important to remember that resonances derived from rotation curves are exact only for axisymmetric systems with infinitesimal bar perturbations. There are two reasons for this: first, the observed rotation curves themselves may contain non-circular components induced by the bar, making it harder to recover the nominal circular-velocity curve; second, the location of resonances in a strongly non-axisymmetric potential will usually not be identical with those derived by assuming an almost axisymmetric potential. Accurate identification of resonances in strongly barred galaxies requires a more complicated approach — e.g., deriving an accurate potential from the photometry and using orbit integrations to find the different resonance-related families, something beyond the scope of this paper. However, using a simple approach to the resonance location does give us a rough guide to help see their approximate positions, and can give us a prima facie answer to the question of whether the presence of inner stellar disks is related to, e.g., the presence of inner Lindblad resonances. In addition, the presence of the inner disks makes the the galaxies more axisymmetric in just the regions we are most interested in, which should reduce the uncertainties.
We do find good evidence that both galaxies have at least one ILR, and that this ILR is in the inner disk region. In the case of NGC 2787 (Figure 12), the ILR is at –30″ and is probably the only ILR, since the curve continues rising inward (the abrupt downturn at in the upper curve is due to seeing effects, and the existence of a central supermassive black hole (Sarzi et al., 2001) probably ensures that there is no second ILR at small radii). For NGC 3945 the situation is ambiguous: there is very good evidence for an ILR at , and there is a suggestion of a second ILR at , at least in the resonance curve derived from the observed velocities. However, at this point we are getting close to the spatial resolution of the original spectrum, and there are probably non-circular motions due to the inner bar, so the resonance curve in that region is unreliable.
7 Discussion
This paper has, in a sense, been directed at examining the argument made by Kormendy (1993) in a review article: that at least some photometric “bulges” — i.e., central light concentrations — in early type galaxies are not really classical bulges — i.e., spheroidal, kinematically hot systems — but are instead part of the disk. We chose the galaxies NGC 2787 and NGC 3945 because we had available the right observations, and our previous studies (Erwin & Sparke, 1999, 2002, 2003) had in fact hinted at this possibility. Moreover, NGC 3945 was one of the most dramatic cases of a kinematically disk-like “bulge” in the study of Kormendy (1982a). The most notable result of the present exercise is the demonstration that most of the inner light in these two galaxies — previously ascribed to their bulges — comes from luminous, exponential disks embedded inside large bars. This does not mean that these galaxies lack hot, spheroidal bulges entirely: we do find evidence for such bulges, inside the inner disks. But they are smaller (in the case of NGC 3945, much smaller) than a naïve bulge-disk decomposition of the whole galaxy would suggest, as we show below.
7.1 Bulge and Inner Disk Luminosities and Masses, and the Question of Hubble Type
Since the central light in these galaxies is divided between the bulge and the inner disks, it is of interest to determine the relative and absolute luminosities of the inner components. How luminous (and massive) are these inner disks? How much of what might naïvely be considered the bulge is really bulge light, and how much comes from the inner disk? What is the true bulge/total luminosity ratio for these S0 galaxies? Here, we are explicitly defining bulge to mean a spheroidal or triaxial, kinematically hot stellar component, often (but not necessarily) with a non-exponential light profile. As we point out below, this is emphatically not always the same thing as “inner luminosity excess above the outer disk profile,” a common definition of bulge which is often assumed to be equivalent.
To compute the luminosities of the inner disks and bulges of these galaxies, we assume that they are well modeled by the fitted exponential and Sérsic functions, respectively. We assume the inner disks are truncated at outer radii of 20″ and 17″ for NGC 2787 and NGC 3945, respectively (see Section 5). For comparison with the total luminosities of each galaxy, we use the absolute magnitudes from Table 1.
The luminosity of an ellipsoid of ellipticity with a Sérsic profile is given by
| (6) |
with being the gamma function; is the half-light radius along the major axis. For an exponential disk with observed ellipticity , observed central surface brightness , and scale length , the luminosity within is
| (7) |
and the total luminosity is
| (8) |
The factor is a correction for disk optical thickness, such that the corrected, face-on central surface brightness ; for a transparent disk. We use , the -band value from Tully & Verheijen (1997).777This is the value for an outer disk; it may not be appropriate for inner disks. The resulting luminosities and luminosity ratios are listed in Table 6.
In Table 6 we also list mass estimates for the bulges and inner disks. These are based on mean and colors obtained from the PC images. For NGC 3945, this is relatively straightforward, as there is little dust outside the inner few arc seconds; we assume the bulge is approximately the same color as the inner disk (, , corrected for Galactic extinction). The situation is more complicated for NGC 2787, due to the tilted dust lanes. By making measurements in the most dust-free region in the outer part of the inner disk, we obtain and . By comparing these values with the results of Vazdekis et al. (1996), assuming a single-burst population, metallicities near solar, and two possible IMFs (Salpeter and bimodal), we estimate -band M/L ratios of for NGC 2787 and for NGC 3945.
In both cases, the bulges are less luminous than the inner disks — for NGC 3945, the bulge is only one-tenth of the inner-disk luminosity (conversely, NGC 3945’s inner disk is actually more luminous than the whole of NGC 2787!). Consequently, the bulge-to-total (B/T) luminosity ratios of these galaxies are small: 0.11 for NGC 2787 and 0.04 for NGC 3945. As we discuss below, these values are rather low (unusually so for NGC 3945) when compared with typical S0 values from the literature.
If we imagine for the moment that the bulges and inner disks really are just one central, “bulge” system, then we gain some insight into the classification of these galaxies — and possibly the question of B/D ratios in general. For both galaxies, the (inner-disk + bulge)/total ratio is about 0.4, and corresponding “B/D” ratio is about 0.67. This is at the low end of B/D ratios for S0 galaxies (Graham 2001a, using data from Simien & de Vaucouleurs 1986), but not at all unusual. The true “B/D” (that is, bulge/(total bulge)) and B/T ratios for NGC 2787 are 0.12 and 0.11. These are below the known limits for S0 galaxies, and at the low end of Sa–Sab galaxies; they are more typical of Sab–Sb. For NGC 3945, the true “B/D” and B/T ratios are both , which are really typical of Sbc and later galaxies. We can see that both galaxies are plausibly S0 in terms of their B/T ratios if the inner disk and bulge are lumped together as the bulge; but if the genuine (round, kinematically hot) bulge is considered, they are not typical S0 galaxies at all.
So is NGC 3945 really a severely misclassified Sc galaxy, and NGC 2787 perhaps better described as Sab? It is worth remembering that the Hubble classifications are based on more than (apparent) bulge/disk ratio. Both galaxies have no visible spiral arms and no signs of star formation; NGC 3945 has almost no dust, while the dust in NGC 2787 is probably the result of an encounter and is not part of its disk(s). So both galaxies are clearly S0 in terms of their (outer) disk structure, which is at least partly why Buta et al. (1994) listed them as representative of Hubble type S. The implication, then, is not so much that these galaxies are misclassified, as that the S0 class is much more heterogeneous in terms of B/T ratios than is commonly assumed.
7.2 The Dangers of Global Bulge-Disk Decomposition
Numerous studies over the years have emphasized measuring bulge and disk parameters in disk galaxies. Typically, this is done by decomposing profiles, either major-axis or azimuthally averaged, into bulge + disk components. More recently, this has been expanded to include two-dimensional fitting (e.g., de Jong, 1996; Moriondo, Giovanardi, & Hunt, 1998; Khosroshahi, Wadadekar, & Kembhavi, 2000). All of these approaches, however, are predicated on the assumption that the galaxies can be analyzed into just two components: bulges residing inside large disks.888Occasionally, an attempt is made to account for the presence of bars (e.g., de Jong, 1996; Prieto et al., 2001).
Kormendy (1993) pointed out the possible dangers of relying on such simplistic, broad-brush decompositions, particularly given the evidence for the “bulges” of some galaxies being kinematically disk-like (he noted that a significant number of Kent’s [1985,1987] bulge-disk decompositions required highly flattened bulge components). One such danger is that true bulge bulge-to-total light ratios can be significantly overestimated. As we show below, the inner disks we find in NGC 2787 and NGC 3945 are large enough and bright enough to masquerade as bulges in standard bulge-disk decompositions, resulting in systematic overestimates of the bulge sizes for these galaxies in the past. They are thus excellent examples of how standard bulge-disk decompositions can produce dramatically misleading results.
Several estimates of bulge size from the literature for NGC 2787 and NGC 3945 are collected and compared with our measurements in Table 7. The visual size estimates from Athanassoula & Martinet (1980) are clearly measures of the inner disks. The -band major-axis decompositions by Baggett et al. (1998), which used an bulge and an exponential disk with an optional hole in the middle, are clearly poor. For NGC 3945, this is due to the fact that their “disk” fit is to the outer ring, and they warn that such fits are probably not to be trusted. For NGC 2787, on the other hand, the transition from outer disk to lens region, along the major axis, forces them to introduce a hole to the disk at ; thus, light belonging to the lens is perforce added, along with the inner disk, into the “bulge.”
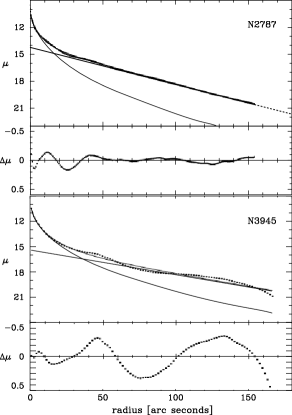
In Figure 14 we also show simple bulge-disk decompositions for the azimuthally averaged -band profiles of the whole galaxies. Azimuthally averaged profiles eliminate some of the difficulties associated with major-axis profiles, since the problems created by relative bar orientation (does the profile run close to the bar major axis? does it cross a lens region?) are lessened. These fits were done with the method outlined above in Section 5, including seeing correction using the median FWHM of stars in each image and the use of Sérsic profiles for the bulges.
The fit for NGC 3945 is quite poor, because there simply is no clear outer, single-exponential disk in this galaxy (such non-exponential profiles are typical of barred galaxies with prominent outer rings; e.g., de Vaucouleurs et al., 1975; Buta et al., 2001). One could try alternate approaches, such as using the inner part of the major-axis profile, perhaps treating the lens region as an underlying exponential component — note that it is clearly not flat, as is often assumed for lenses, and in fact has two slopes. Nonetheless, one might still be tempted to suppose that an approximate bulge profile has been derived, even if the disk fit is not accurate. Taking the fits at face value, and assuming and 0.35 for the “bulge” and “outer disk,” respectively, yields an -band B/T ratio of 0.6 (not too different from the -band value of 0.4 which Kormendy & Illingworth 1983 estimated “from the morphology”).
The fit for NGC 2787 is better, though it can be seen that the azimuthally averaged bar region (–50″) produces some deviations, and a single Sérsic profile is not very good at fitting the combination of bulge + inner disk; the latter phenomenon could serve as a useful warning. Nonetheless, it is still tempting to assume that one can (approximately) measure the bulge this way. The supposed -band B/T ratio would then be 0.4 (assuming and 0.4 for the “bulge” and outer disk, respectively). This is, in fact, about what we get if we add our true bulge and inner-disk fits together and compare them to the total luminosity in the band, so the “naïve” fit does indeed lump the true bulge and inner disk together into one larger, composite “bulge.”
In both cases, the naïve interpretation is that we can identify the bulge regions and the parameters of the bulges from these fits. Given our analysis in the preceding sections, these parameters would be rather wrong: we would overestimate the bulge effective radius by factors of two (in the case of NGC 2787) to ten (for NGC 3945); similarly, the bulge luminosities would be overestimated by factors of two to !
7.3 Frequency of Bright Inner Disks and Bulge Overestimation
How common is it that a significant fraction of a galaxy’s central light is due to something like an inner disk, rather than to the bulge? In Erwin & Sparke’s (2002) sample of barred S0–Sa galaxies, about one-third of the twenty S0 galaxies had potential inner disks. As they pointed out, some of these are probably inner bars or unresolved nuclear rings; moreover, we have been studying here the two largest inner disks from that sample, so we are probably sampling the upper end of the distribution — other inner disks may be less luminous and a lower fraction of the central light. From this, we can argue that % of (barred) S0 galaxies may have “composite bulges,” where the true bulge is at most half the luminosity of the central subsystem. But this is probably a lower limit, since Erwin & Sparke relied on ellipse fits to identify possible inner disks. In galaxies which are close to face-on, an inner disk will not be distinguishable from a pure bulge using ellipse fits. If we sort all the galaxies of their sample by inclination, then the median inclination of the upper half (higher inclinations) is 52°, versus 33° for the less inclined half. The median inclination of the inner-disk galaxies is 52°; a Kolmogorov-Smirnov test confirms that the inner-disk galaxies are indeed drawn from the upper half of the inclinations (probability = 81%, versus a 0.04% probability that the inner-disk galaxy inclinations are consistent with being drawn from the lower half of the inclinations). This suggests, very approximately, that Erwin & Sparke detected only half of the inner disks in their sample, in which case the frequency of large inner disks is closer to % of barred S0’s.
In a study of edge-on S0 galaxies, Seifert & Scorza (1996) found inner disks in about half of their fifteen galaxies. The problem here is that, as we noted in the Introduction, while we know these structures are flat, it is unclear how many are disks, and not bars or rings; thus, their detection rate is probably best seen as an upper limit. (We also do not know how many of their galaxies were barred, which makes comparison with the barred-galaxy sample of Erwin & Sparke a little difficult.) Assuming that most of these are disks, we can ask how many of them are comparable in size to those of NGC 2787 and NGC 3945, since Seifert & Scorza provide approximate scale lengths for the inner disks. Defining as the ratio of scale length to , we find for NGC 2787 and 0.035 for NGC 3945. Three of Seifert & Scorza’s inner disks have similar sizes (the rest are smaller): NGC 2549 ( pc and ); NGC 4026 ( pc and ); and NGC 7332 ( pc and ).999For NGC 2549 and NGC 7332, we used SBF distances from Tonry et al. (2001); for NGC 4026, we used from LEDA and Mpc-1. This implies that % of S0’s harbor large inner disks.
Taken together, these results suggest that the fraction of S0’s with significantly composite bulges is %. But this is not the only way for a galaxy to have a composite bulge. About a third of Erwin & Sparke’s barred S0’s had inner bars. While some of these were quite weak features, two of them (NGC 2859 and NGC 2950) produced severe distortions in the inner isophotes, such that Kormendy (1982a) referred to both as having “triaxial” bulges; moreover, he found that both galaxies had , suggesting the dominance of disk-like over bulgelike kinematics in the inner-bar region. It is plausible to imagine that in these galaxies, too, the true bulge contribution to the luminosity is significantly less than what might be estimated by casual inspection, or by a global bulge-disk decomposition. So the composite-bulge fraction (galaxies with large inner disks plus those with large inner bars) could be as high as % in barred S0’s.
It is curious that Erwin & Sparke detected inner disks almost exclusively in S0 galaxies, even though about half their sample were S0/a or Sa and inner bars were found with roughly equal frequency in all three Hubble types. This suggests that inner disks might be largely confined to S0 galaxies, though why this should be so is not at all clear. There are presumably some sizeable inner disks in spiral galaxies; Kormendy (1993) suggested that the fraction of inner-disk–dominated “bulges” should increase to later Hubble types. The Sa galaxy NGC 4594 (the Sombrero Galaxy) has an inner disk with scale length pc, and Pizzella et al. (2002) found an pc inner disk in the Sb NGC 1425; in both cases, however, , so they are still rather small.101010Using the scale length from Emsellem et al. (1994) and the SBF distance from Tonry et al. (2001) for NGC 4594; Cepheid distance for NGC 1425 from Freedman et al. (2001). An even better example may be NGC 3368 (M96), an SABab galaxy with both an inner bar and a possible inner disk visible in near-IR images. Although an exponential scale length is not available, the maximum-ellipticity radius of the inner disk is kpc — almost identical to that of NGC 3945. (for details, see Erwin, 2003). The evidence for a bar-inside-disk-inside-bar structure makes this galaxy an even closer analog to NGC 3945. Other non-S0 examples may include NGC 1433 (SBab) and NGC 6300 (SBb), which Buta et al. (2001) found to have highly flattened isophotes in the outer parts of their “bulges regions.”
7.4 Origins and Dynamics
We can speculate briefly on the origin of these inner disks. The most plausible mechanism is bar-driven gas inflow, resulting in a central accumulation of gas inside the bar. Once the gas density is sufficiently high, star formation is a likely consequence. This would be a clear example of bar-driven secular evolution (e.g., Kormendy, 1993, and references therein). Is this consistent with ideas about secular evolution along the Hubble sequence, especially those where it occurs due to bars (e.g, Hasan, Pfenniger, & Norman, 1993; Norman, Sellwood, & Hasan, 1996)?
In once sense, the answer is yes. As we have pointed out above, the presence of inner disks such as these can contribute to classifying their galaxies as early-type, since the inner disks masquerade as bulges (“pseudobulges” in Kormendy’s terminology). On the other hand, the inner disks are not classical bulges — they are disks. Thus, models where bars dissolve into spheroidal, kinematically hot bulges (e.g., Norman et al. 1996) do not work here — not the least because these galaxies still have bars! Both NGC 2787 and NGC 3945 do appear to have small, classical bulges embedded within their inner disks; we do not know if these bulges were formed before, during, or after the inner disk formation, though this is clearly an interesting question.
The absence of a clear color difference between the inner disks and the surrounding stars (Erwin & Sparke, 1999, 2003) suggests that star formation ceased some time ago; the presence of off-plane gas in NGC 2787 also argues against a significant, recent in-plane accumulation of gas in the inner-disk region. Is there evidence for present-day inner-disk formation in nearby galaxies? Current circumnuclear star formation in barred galaxies is a well-studied phenomenon, though it usually takes place in a fairly narrow ring, not a disk. One intriguing example is the double-barred Sa galaxy NGC 4314, where there is active star formation in a circumnuclear ring (surrounding the inner bar) with diameter and evidence for a recent but older epoch of star formation outside, in a zone of diameter 20–25″ possibly associated with orbits in between two ILRs (Benedict et al., 2002). As Benedict et al. suggest, this may indicate a process where the accumulated gas shrinks in radius over time, with star formation thus proceeding outside-in (Combes et al., 1992). (An alternate scenario has star formation mainly in the ring, with the dynamical influence of the inner bar driving older star clusters outward; Kenney, Friedli, & Benedict 1999.) Another possibly relevant galaxy is NGC 1317, where there are two star-forming nuclear rings inside an outer bar: an elliptical ring surrounding an inner bar, and a circular ring further out (Crocker, Baugus, & Buta, 1996). Since NGC 3945 is also double-barred, with a (stellar) nuclear ring surrounding the inner bar, it is tempting to identify NGC 1317 and NGC 4314 as precursor objects, where inner disks may be forming as we watch. Whether such outside-in or double-ring circumnuclear star formation can actually produce the massive, exponential inner disks we see in NGC 2787 and NGC 3945 is unknown.
However they might form, how do such disks survive inside bars? Is it dynamically plausible for a massive disk to exist inside a strong bar? We have suggested, based on the presence and tentative location of ILRs in both galaxies, that the inner disks may be supported by orbits within the bars. (The actual radial range spanned by the orbits cannot be accurately determined from our crude ILR identifications, but must be found by orbit integrations in a realistic potential.) A possible objection to this idea is the fact that orbits are elongated perpendicular to bars (indeed, they have been sometimes suggested as the basis for perpendicular inner bars), while we have been arguing that the inner disks are essentially circular. An alternate scenario is suggested by the findings of Heller & Shlosman (1996), who studied the effects of massive circular and elliptical nuclear rings on the orbits within bars. Intriguingly, the presence of a circular ring tended to make the bar-supporting orbits — normally elongated parallel with the bar — rounder in the vicinity of the ring (see their Section 4.2 and Fig. 9). It could be that the presence of a disk would cause a similar phenomenon, and in this case the circularized, inner orbits would be a plausible mechanism for supporting the inner disks.
8 Summary
We have presented a morphological, photometric, and kinematic analysis, using both ground-based and HST images and ground-based long-slit spectra, of two barred S0 galaxies with distinct, kiloparsec-scale inner disks inside their bars. We show that these disks are probably flat and circular, and are thus geometrically disk-like. They also have clear exponential profiles, making them similar to classical large disks as well.
Published and newly-reduced archival stellar kinematics from long-slit spectra indicate that the inner disks are dominated by rotation rather than by random stellar motions, so they are probably kinematically disk-like (as previously pointed out for one of the galaxies by Kormendy, 1982a). We also find evidence for inner Lindblad resonances in the inner-disk region of both galaxies. This suggests that the inner disks could be supported by (bar-perpendicular) orbits in the bar potential; alternately, the influence of a massive inner disk on the potential may make the bar-supporting orbits more nearly circular in the inner-disk region, and thus capable of supporting the disk.
Due to their short scale lengths and high central surface brightness, these inner disks appear as central excesses above the outer-disk luminosity profile. Consequently, they can be — and indeed have been — erroneously classified as the “bulges” of these galaxies, and are thus good examples of what Kormendy (2001) and Kormendy & Gebhardt (2001) term “pseudobulges” (see also Kormendy, 1993).
It is important to note that both galaxies do in fact have central bulges which are distinct from the inner disks. These “true bulges” appear as excesses above the inner disk profile, are rounder in projection than the inner disks (suggesting they are oblate or mildly triaxial spheroids), and have non-exponential () light profiles. The true bulges constitute much smaller fractions of the total galaxy light than a simplistic bulge-disk decomposition of the global light profiles would indicate: such decompositions assign light from the inner disk to the bulge component. In NGC 2787, the inner disk has twice the luminosity of the true bulge; in NGC 3945, the inner disk is almost ten times more luminous than the true bulge, making the true bulge/total ratio of the galaxy 5%, a value more typical of Sc galaxies than S0 galaxies. We estimate that –30% of S0 galaxies may have similar “composite bulges” or “pseudobulges,” where a significant fraction of the inner light comes from an inner disk or bar, rather than a spheroidal, kinematically hot bulge. This means that a substantial number of bulge sizes, luminosities, and bulge-to-disk ratios may have been overestimated.
References
- Aguerri, Debattista, & Corsini (2003) Aguerri, J. A. L., Debattista, V. P., & Corsini, E. M. 2003, MNRAS, 338, 465
- Athanassoula & Martinet (1980) Athanassoula, E., & Martinet, L. 1980, A&A, 87, L10
- Baggett et al. (1998) Baggett, W. E., Baggett, S. M., & Anderson, K. S. J. 1998, AJ, 116, 1626
- Bender (1988) Bender, R., 1988, A&A, 193, L7
- Bender (1990) Bender, R. 1990, A&A, 229, 441
- Bender, Saglia, & Gerhard (1994) Bender, R., Saglia, R. P., & Gerhard, O.E. 1994, MNRAS, 269, 785
- Benedict et al. (2002) Benedict, G. F., Howell, D. A., Jørgenson, I., Kenney, J. D. P., & Smith, B. J. 2002, AJ, 123, 1411
- Bertola et al. (1995) Bertola, F., Cinzano, P., Corsini, E. M., Rix, H.-W., & Zeilinger, W. W. 1995, ApJ, 448, L13
- Binney (1978) Binney, J. 1978, MNRAS, 183, 501
- Binney & Merrifield (1998) Binney, J., & Merrifield, M. 1998, Galactic Astronomy (Princeton: Princeton University Press)
- Buta et al. (1994) Buta, R., et al. 1994, AJ, 107, 118
- Buta & Combes (1996) Buta, R., & Combes, F. 1996, Fund.Cosm.Phys., 17, 95
- Buta et al. (2001) Buta, R., Ryder, S. D., Madsen, G. J., Wesson, K., Crocker, D. A., & Combes, F. 2001, AJ, 121, 225
- Carollo et al. (1997) Carollo, C. M., Stiavelli, M., de Zeeuw, P. T., & Mack, J. 1997, AJ, 114, 2366
- Carollo, Stiavelli, & Mack (1998) Carollo, C. M., Stiavelli, M., & Mack, J. 1998, AJ, 116, 68
- Caon, Capaccioli, & D’Onofrio (1993) Caon, N., Capaccioli, M., & D’Onofrio, M. 1993, MNRAS, 265, 1013
- Combes et al. (1992) Combes, F., Gerin, M., Nakai, N., Kawabe, R., & Shaw, M. A. 1992, A&A, 259, L27
- Crocker, Baugus, & Buta (1996) Crocker, D. A., Baugus, P. D., & Buta, R. 1996, ApJS, 105, 353
- de Jong & van der Kruit (1994) de Jong, R. S., & van der Kruit, P. C. 1994, A&AS, 106, 451
- de Jong (1996) de Jong, R. S. 1996, A&AS, 118, 557
- de Vaucouleurs et al. (1975) de Vaucouleurs, G. 1975, ApJS, 29, 193
- de Vaucouleurs et al. (1991) de Vaucouleurs, G., de Vaucouleurs, A., Corwin, H. G., Buta, R. J., Paturel, G., & Fouqué, P. 1991, Third Reference Catalogue of Bright Galaxies (New York: Springer-Verlag) (RC3)
- Elmegreen & Elmegreen (1985) Elmegreen, B., & Elmegreen, D. 1985, ApJ, 288, 438
- Emsellem et al. (1994) Emsellem, E., Monet, G., Bacon, R., & Nieto, J.-L. 1994, A&A, 285, 739
- Erwin & Sparke (1999) Erwin, P., & Sparke, L. S. 1999, ApJ, 512, L37
- Erwin et al. (2001) Erwin, P., Vega Beltrán, J. C., & Beckman, J. E. 2001, in The central kpc of starbursts and AGN: the La Palma connection, ed. J.H. Knapen, J.E. Beckman, I. Shlosman, & T.J. Mahoney (San Francisco: ASP), 85
- Erwin & Sparke (2002) Erwin, P., & Sparke, L. S. 2002, AJ, 124, 65
- Erwin & Sparke (2003) Erwin, P., & Sparke, L. S. 2003, ApJS, 146, 299
- Erwin (2003) Erwin, P. 2003, in prep
- Freedman et al. (2001) Freedman, W., et al. 2001, ApJ, 553, 47
- Gerssen, Kuijken, & Merrifield (1997) Gerssen, J., Kuijken, K., & Merrifield, M. R. 1997, MNRAS, 288, 618
- Graham (2001a) Graham, A. W. 2001a, AJ, 121, 820
- Graham (2001b) Graham, W. W. 2001b, MNRAS, 326, 543
- Hasan, Pfenniger, & Norman (1993) Hasan, H., Pfenniger, D., & Norman, C. 1993, ApJ, 409, 91
- Heller & Shlosman (1996) Heller, C. H., & Shlosman, I. 1996, ApJ, 471, 143
- Ho et al. (1997) Ho, L. C., Filippenko, A. V., Sargent, W. L. W., & Peng, C. Y. 1997, ApJS, 112, 391
- Holtzman et al. (1995) Holtzman, J. A., Burrows, C. J., Casertano, S., Hester, J. J., Trauger, J. T., Watson, A. M., & Worthey, G. 1995, PASP, 107, 1065
- Jarrett, Chester, & Cutri (2000) Jarrett, T. H., Chester, T., & Cutri, R. 2000, AJ, 119, 2498
- Jedrzejewski (1987) Jedrzejewski, R. I. 1987, MNRAS, 226, 747
- Kenney et al. (1999) Kenney, J. D. P., Friedli, D., & Benedict, G. F. 1999, in Galaxy Dynamics, ed. D. Merritt, J. A. Sellwood, & M. Valluri (San Francisco, 1999), 235
- Kent (1985) Kent, S. M. 1985, ApJS, 59, 115
- Kent (1987) Kent, S. M. 1987, AJ, 93, 816
- Khosroshahi, Wadadekar, & Kembhavi (2000) Khosroshahi, H. G., Wadadekar, Y., & Kembhavi, A. 2000, ApJ, 533, 162
- Kormendy (1979) Kormendy, J. 1979, ApJ, 227, 714
- Kormendy (1982a) Kormendy, J. 1982a, ApJ, 257, 75
- Kormendy (1982b) Kormendy, J. 1982b, in Morphology and Dynamics of Galaxies: Twelfth Advanced Course of the Swiss Society of Astronomy and Astrophysics, ed. L. Martinet & M. Mayor (Sauverny: Observatoire de Genève), 113
- Kormendy (1984) Kormendy, J. 1984, ApJ, 286, 116
- Kormendy (1993) Kormendy, J., 1993, in Galactic Bulges, IAU Symposium 153, ed. H. Dejonghe & H. J. Habing (Dordrecht: Kluwer), 209
- Kormendy (2001) Kormendy, J. 2001, Rev.Mex.A.&A., Serie de Conferencias, 10, 69
- Kormendy & Illingworth (1983) Kormendy, J., & Illingworth, G. 1983, ApJ, 265, 632
- Kormendy & Gebhardt (2001) Kormendy, J., & Gebhardt, K. 2001, in The 20th Texas Symposium on Relativistic Astrophysics, ed. J. C. Wheeler & H. Martel (AIP), 363
- Lambas, Maddox, & Loveday (1992) Lambas, D. G., Maddox, S. J., & Loveday, J. 1992, MNRAS, 258, 404
- Lauer et al. (1995) Lauer, T. R., et al. 1995, AJ, 110, 2622
- Moiseev (2002) Moiseev, A. V. 2002, Astronomy Letters, 28, 755
- Moriondo, Giovanardi, & Hunt (1998) Moriondo, G., Giovanardi, C., & Hunt, L. K. 1998, A&AS, 130, 81
- Norman, Sellwood, & Hasan (1996) Norman, C., Sellwood, J. A., & Hasan, H. 1996, ApJ, 462, 114
- Neistein et al. (1999) Neistein, E., Maoz, D., Rix, H.-W., & Tonry, J. L. 1999, AJ, 117, 2666
- Peng et al. (2002) Peng, C. Y., Ho, L. C., Impey, C. D., & Rix, H.-W. 2002, AJ, 124, 266
- Pizzella et al. (2002) Pizzella, A., Corsini, E. M., Morelli, L., Sarzi, M., Scarlata, C., Stiavelli, M., & Bertola, F. 2002, ApJ, 573, 131
- Prieto et al. (2001) Prieto, M., Aguerri, J. A. L., Varela, A. M., & Muñoz-Tuñón, C. 2001, A&A, 367, 405
- Rest et al. (2001) Rest, A., van den Bosch, F. C., Jaffe, W., Tran, H., Tsvetanov, Z., Ford, H. C., Davies, J., & Schafer, J., 2001, AJ, 121, 2431
- Sarzi et al. (2001) Sarzi, M., Rix, H.-W., Shields, J. C., Rudnick, G., Ho, L. C., McIntosh, D. H., Filippenko, A. V., & Sargent, W. L. W. 2001, ApJ, 550, 65
- Sérsic (1968) Sérsic, J.-L. 1968, Atlas de Galaxias Australes (Cordoba: Obs. Astron.)
- Schlegel et al. (1998) Schlegel, D. J., Finkbeiner, D. P., & Davis, M. 1998, ApJ, 500, 525
- Scorza & van den Bosch (1998) Scorza, C., & van den Bosch, F. C. 1998, MNRAS, 300, 469
- Seifert & Scorza (1996) Seifert, W., & Scorza, C. 1996, A&A, 310, 75
- Shostak (1987) Shostak, G. S. 1987, A&A, 175, 4
- Simien & de Vaucouleurs (1986) Simien, F., & de Vaucouleurs, G. 1986, ApJ, 302, 564
- Stiavelli et al. (2001) Stiavelli, M., Miller, B. W., Ferguson, H. C., Mack, J., Whitmore, B. C., & Lotz, J. M. 2001, AJ, 121, 1385
- Tonry et al. (2001) Tonry, J. L., Dressler, A., Blakeslee, J. P., Ajhar, E. A., Fletcher, A. B., Luppino, G. A., Metzger, M. R., & Moore, C. B. 2001, ApJ, 546, 681
- Tully & Verheijen (1997) Tully, R. B., & Verheijen, M. A. W. 1997, ApJ, 484, 145
- Vazdekis et al. (1996) Vazdekis, A., Casuso, E., Peletier, R. F., & Beckman, J. E. 1996, ApJS, 106, 307
- Vega Beltrán et al. (2003) Vega Beltrán, Erwin, P., J. C., Coccato, L., Corsini, E., Pizzella, A., & Beckman, J. E. 2003, in prep
- Wardle & Knapp (1986) Wardle, M., Knapp, G., 1986, AJ, 91, 23
- Wozniak et al. (1995) Wozniak, H., Friedli, D., Martinet, L., Martin, P., & Bratschi, P. 1995, A&A, 111, 115
| Parameter | NGC 2787 | Source | NGC 3945 | Source |
|---|---|---|---|---|
| Morphological Type | SB(r) | RC3 | (R)SB(rs) | RC3 |
| 95″ | RC3 | 157″ | RC3 | |
| Heliocentric | 696 | LEDA | 1233 | LEDA |
| Distance | 7.5 Mpc | 1 | 19.8 Mpc | LEDA |
| Linear scale (1″) | 36 pc | 96 pc | ||
| Major axis PA | 109° | 2 | 158° | 3 |
| Inclination | 55° | 2 | 3 | |
| 11.27 | LEDA | 11.54 | LEDA | |
| 10.37 | LEDA | 10.65 | LEDA | |
| 8.80 | LEDA | LEDA | ||
| -18.10 | -19.94 | |||
| -19.00 | -20.83 | |||
| -20.57 | ||||
| Galactic extinction | 0.57 | 4 | 0.12 | 4 |
Note. — Unless otherwise noted, measurements are from this paper. The distance to NGC 3945 uses radial velocity, corrected for Virgo-centric infall, from LEDA and Mpc-1. Absolute magnitudes use total magnitude from LEDA and the distances listed here. Other sources: 1 = Tonry et al. 2001; 2 = Erwin & Sparke 2002b; 3 = Erwin & Sparke 1999; 4 = Schlegel, Finkbeiner, & Davis 1998, via NED; LEDA = Lyon-Meudon Extragalactic Database.
| Parameter | Value |
|---|---|
| Date | 24–26 Dec 1995 |
| Spectrograph | ISIS |
| Grating () | 1200 |
| Detector | TK1024 |
| Pixel size () | |
| Pixel binning | |
| Scale () | 0.36 |
| Reciprocal dispersion (Å pixel-1) | 0.40 |
| Slit width (′′) | 1.3 |
| Slit length (′) | 4.0 |
| Spectral range (Å) | 5000–5400 |
| Comparison lamp | CuNe+CuAr |
| Instrumental FWHM (Å) | |
| Instrumental () | 25 |
| Seeing FWHM (′′) | 1.3–1.8 |
| Exposure: major axis (PA ) | 2 x 600s |
| Exposure: offset 23″ NE | 2 x 1800s |
| Exposure: offset 23″ SW | 1 x 1800s |
Note. — The instrumental was measured at [O III].
| 209 | 106 | 123 | 40 | ||
| 188 | 118 | 122 | 8 | ||
| 158 | 130 | 136 | 22 | ||
| 150 | 151 | 132 | 0 | ||
| 132 | 182 | 123 | 44 | ||
| 116 | 182 | 124 | 34 | ||
| 106 | 177 | 113 | 34 | ||
| 117 | 178 | 120 | 26 | ||
| 114 | 218 | 103 | 31 | ||
| 110 | 220 | 103 | 20 | ||
| 100 | 241 | 115 | 25 | ||
| 69 | 227 | 82 | 38 | ||
| 65 | 241 | 90 | 26 | ||
| 63 | 215 | 91 | 46 | ||
| 44 | 228 | 98 | 44 | ||
| 22 | 246 | 98 | 27 | ||
| 257 | 96 | 36 | |||
| 0.3 | 257 | 96 | 53 | ||
| 0.6 | 222 | 91 | 32 | ||
| 1.0 | 200 | 99 | 41 | ||
| 1.4 | 214 | 92 | 45 | ||
| 1.9 | 242 | 87 | 62 | ||
| 2.6 | 189 | 89 | 76 | ||
| 3.3 | 192 | 85 | 85 | ||
| 4.2 | 179 | 73 | 109 | ||
| 5.3 | 196 | 0.0 | 41 | 111 | |
| 6.5 | 180 | 0.4 | 10 | 107 | |
| 8.2 | 169 | 0.7 | 91 | ||
| 10.1 | 175 | 1.1 | 60 | ||
| 12.6 | 158 | 1.4 | 57 | ||
| 16.1 | 135 | 1.8 | 51 | ||
| 22.3 | 168 | 2.2 | 50 | ||
| 37.4 | 73 | 2.5 | 26 | ||
| 60.6 | 144 | 2.9 | 26 | ||
| 3.2 | 34 | ||||
| 3.6 | 41 | ||||
| 4.0 | 50 | ||||
| 4.3 | 14 | ||||
| 4.7 | 25 | ||||
| 5.0 | 26 | ||||
| 5.4 | 31 | ||||
| 5.8 | 25 | ||||
| 6.3 | 37 | ||||
| 7.0 | 39 | ||||
| 7.7 | 47 | ||||
| 8.5 | 52 | ||||
| 9.2 | 48 | ||||
| 9.9 | 25 | ||||
| 10.8 | 38 | ||||
| 12.2 | 36 | ||||
| 14.0 | 25 | ||||
| 15.8 | 16 | ||||
| 17.6 | 23 |
Note. — Stellar and gaseous kinematics along the major axis (actually PA ) of NGC 2787. , , and are the radius, velocity, and velocity dispersion of the stars; the “g” subscript refers in a similar manner to the ionized-gas kinematics.
| NE offset | SW offset | ||||
|---|---|---|---|---|---|
| () | () | () | () | () | () |
| 185 | 123 | 170 | 48 | ||
| 165 | 68 | 163 | 118 | ||
| 153 | 69 | 122 | 124 | ||
| 143 | 84 | 110 | 178 | ||
| 105 | 100 | 81 | 106 | ||
| 115 | 102 | 53 | 119 | ||
| 56 | 99 | 48 | 107 | ||
| 49 | 114 | 56 | 151 | ||
| 50 | 136 | 22 | 115 | ||
| 1.7 | 11 | 100 | 10 | 146 | |
| 5.3 | 93 | 112 | |||
| 8.9 | 105 | 2.1 | 112 | ||
| 12.3 | 86 | 6.4 | 160 | ||
| 15.7 | 94 | 10.8 | 161 | ||
| 19.5 | 66 | 15.8 | 134 | ||
| 23.9 | 119 | 21.8 | 164 | ||
| 30.1 | 97 | 28.8 | 105 | ||
| 39.7 | 62 | 37.8 | 135 | ||
| 52.0 | 74 | 50.8 | 173 | ||
Note. — Stellar kinematics for NGC 2787 along offset slit positions (PA , offset the specified distances from the galaxy nucleus). , , and are the radius along the slit, velocity, and velocity dispersion of the stars; for each slit position, marks the closest point to the nucleus.
| Galaxy | Filter | Inner Disk | Bulge | |||
|---|---|---|---|---|---|---|
| (″/pc) | (″/pc) | |||||
| NGC 2787 | 16.20 | 8.76/318 | 17.28 | 4.27/155 | 2.31 | |
| NGC 3945 | 15.71 | 5.54/532 | 16.03 | 1.15/110 | 1.85 | |
Note. — For each galaxy, we give the results of a bulge-disk decomposition applied to the inner-disk region. Fits are to major-axis profiles of F814W WFPC2 images, converted to as described in the text, with corrections for Galactic extinction.
| Galaxy | Filter | mass () | ID/T | mass () | B/T | B/ID | ||
|---|---|---|---|---|---|---|---|---|
| NGC 2787 | -19.1 | 0.26 | -18.2 | 0.11 | 0.42 | |||
| NGC 3945 | -19.8 | 0.37 | -17.4 | 0.04 | 0.12 | |||
| -21.0 | — | -18.6 | — | 0.12 |
Note. — Absolute bulge and inner-disk (ID) magnitudes and masses, using fits from Table 5 and distances from Table 1. Because NGC 3945 lacks a total -band magnitude, we convert the -band inner-disk and bulge measurements to the -band, using (see text). For NGC 2787, we assumed inner-disk and truncation at ; for NGC 3945, and . For both galaxies, bulge . ID/T = ratio of inner-disk to total luminosity; B/T = ratio of bulge to total luminosity; B/ID = ratio of bulge to inner-disk luminosity. See text for mass estimation.
| Galaxy | Bulge radius (″) | Filter | Decomposition | Source |
|---|---|---|---|---|
| NGC 2787 | 4.6 | inner-disk | 1 | |
| 10.6 | full profile | 1 | ||
| 16.3 | full profile (MA) | 2 | ||
| 21.5 | visual estimate | 3 | ||
| NGC 3945 | 1.2 | inner-disk | 1 | |
| 12.9 | full profile | 1 | ||
| 16.3 | full profile (MA) | 2 | ||
| 16.0 | visual estimate | 3 | ||
| 17.0 | visual estimate | 4 |
Note. — Comparison of bulge size measurements. All except for the “visual estimate” measurements are effective radii from bulge-disk decompositions; the “full profile” decompositions use either the azimuthally averaged profile or a major-axis cut (“MA”). Because all methods except the inner-disk decompositions assume that the bulge and (outer) disk are the only components in each galaxy, they force the inner disk to be part of the bulge and thus overestimate the bulge size. Sources: 1 = this study; 2 = Baggett, Baggett, & Anderson 1998; 3 = Athanassoula & Martinet 1980; 4 = Kormendy 1982.