CCD PHOTOMETRY OF THE GLOBULAR CLUSTER
CENTAURI.
II. STELLAR POPULATIONS AND AGE-METALLICITY RELATION
Abstract
We present wide-field and high-precision and & Strömgren photometry of Centauri, which represents one of the most extensive photometric surveys to date for this cluster. The member stars of Cen are well discriminated from foreground Galactic field stars in the [=] vs. diagram. The resulting “cleaned” color-magnitude diagram (CMD) has allowed us to obtain an accurate distribution of the red horizontal branch (HB) and the asymptotic giant branch stars. We confirm the presence of several red giant branches (RGBs) with the most metal-rich sequence well separated from other bluer metal-poor ones. Our population models suggest that four populations with different metallicities can reproduce the observed nature of the RGB. The HB distribution is also found to be consistent with the multiple stellar populations of the RGB. From our population models, we propose that the most metal-rich population is about 4 Gyr younger than the dominant metal-poor population, indicating that Cen was enriched over this timescale. We identify, for the first time, a continuous and slanting RGB bump in the CMD of Cen, which is due to the metallicity spread amongst the RGB stars. Our photometry also reveals a significant population of blue straggler stars. The discovery of several populations and the internal age-metallicity relation of Cen provides good evidence that Cen was once part of a more massive system that merged with the Milky Way, as the Sagittarius dwarf galaxy is in the process of doing at the present time.
1 INTRODUCTION
The cluster Centauri (NGC 5139) has many unique characteristics amongst Galactic globular clusters (GGCs). It is the most luminous and massive cluster in the Galaxy (Harris 1996; Meylan et al. 1995), and one of the most flattened clusters (Meylan 1987; White & Shawl 1987) which must have resulted from its significant rotation (Meylan & Mayor 1986; Mayor et al. 1997; Merrit, Meylan, & Mayor 1997). The most intriguing and peculiar feature of Cen is the wide spread of metallicity. The majority of GGCs show homogeneity in iron-peak elements, while often exhibiting large variations in the lighter elements such as CNO, Na, Mg, and Al (Suntzeff 1993; Kraft 1994). However, unlike other GCs, Cen shows star-to-star abundance variations of the iron-peak elements.
Dickens & Woolley (1967) first noted the chemical inhomogenity of stars in Cen, from the large color width of the red giant branch (RGB) stars in the CMD shown by the photographic photometry of Woolley (1966), which was later confirmed by Cannon & Stobie (1973). Freeman & Rodgers (1975) and Butler, Dickens, & Epps (1978) also confirmed a diversity of chemical composition from the RR Lyrae variables in this cluster (see also Gratton, Tornambe, & Ortolani 1986; Rey et al. 2000). Recently, a series of spectroscopic studies for large samples of the RGB stars in Cen verified the range in abundances and derived detailed abundance patterns (e.g., Brown & Wallerstein 1993; Vanture, Wallerstein, & Brown 1994; Norris & Da Costa 1995; Smith, Cunha, & Lambert 1995; Norris, Freeman, & Mighell 1996; Suntzeff & Kraft 1996; Smith et al. 2000; Pancino et al. 2002; Cunha et al. 2002; Origlia et al. 2003). It has been reported that the abundance of iron spans a range from [Fe/H] -2.0 up to -0.5, along with high abundance of the s-process elements over the whole [Fe/H] range.
It also appears that this anomaly of chemical inhomogeneity found in Cen is closely linked to the kinematics and spatial distribution of the stars. Norris et al. (1997) found that the metal-rich RGB stars are more centrally concentrated and furthermore show evidence for different velocity dispersion and rotation properties compared to the dominating population of more metal-poor stars. The metal-poor population rotates, but the metal-rich stars do not. From this apparent difference in kinematics between the metal-poor and the metal-rich stars, as well as a second peak in the metallicity distribution, they suggested a merger of two clusters as a possible origin of Cen. The difference in spatial distribution between different metallicity populations is also confirmed by successive studies (Jurcsik 1998; Pancino et al. 2000, 2003; Hilker & Richtler 2000; see also Freeman 1985). Most recently, Ferraro, Bellazzini, & Pancino (2002) suggested that the newly discovered metal-rich RGB stars with [Fe/H] -0.6 may have a different proper motion distribution that is not compatible with that of the dominant metal-poor population of Cen, while Platais et al. (2003) commented that this could arise as a spurious effect in the proper motion determination. The close connection of metal abundance to the kinematics and spatial distribution of stars in Cen would provide some important constraints for its star formation and chemical enrichment histories when combined with wide-field high precision photometric data.
The first comprehensive and wide-field photographic study for Cen was undertaken by Woolley (1966). It remained the only wide-field study of Cen for more than three decades. He, and co-workers, obtained a CMD for several thousand stars which extends to about 1 mag fainter than the horizontal branch (HB), however the photometric errors for even bright RGB stars were somewhat large. These data are too shallow to allow accurate study of the properties of various populations in this cluster, despite being spatially complete. Recent wide field studies were initiated by Lee et al. (1999), who obtained high-precision homogeneous CCD CMDs for more than 130,000 stars in the field toward Cen, which represents one of the most extensive photometric surveys to date for this cluster (see also Pancino et al. 2000; Hilker & Richtler 2000; Majewski et al. 2000). Lee et al. (1999) discovered multiple RGBs, especially noteworthy being a red, metal-rich ([Fe/H] -0.5) sequence well separated from other, bluer, metal-poor ones in the CMD. This feature was not evident in previous photometry due to larger photometric uncertainties (e.g., Woolley 1966) and usually much smaller sample sizes. An independent survey by Pancino et al. (2000) confirmed the reality of this discovery. Furthermore, the most metal-rich population in Cen appears to be a few billion years younger than the most metal-poor ([Fe/H] -1.8) population in this system (Lee et al. 1999; Hughes & Wallerstein 2000; Hilker & Richtler 2000).
The multimodal metallicity distribution function and the apparent age-metallicity relation would suggest that the protocluster of Cen was massive enough to undergo some self-enrichment (e.g., Suntzeff & Kraft 1996; Ikuta & Arimoto 2000) and several early bursts of star formation with a variable rate. This suggests that Cen evolved within a dwarf galaxy size gas-rich subsystem until it merged and disrupted with our Galaxy a few billion years after the formation of its first generation of metal-poor stars, leaving its core as today’s GC Cen (Freeman 1993; Norris et al. 1997; Lee et al. 1999; Majewski et al. 2000; Hughes & Wallerstein 2000; Hilker & Richtler 2000). This is consistent with the fact that there is similarity in the distinct appearance of multiple stellar populations with an internal age-metallicity relation for both Cen and the Sagittarius dwarf galaxy (Sarajedini & Layden 1995; Layden & Sarajedini 1997, 2000; Bellazzini et al. 1999a, 1999b); the latter includes M54, the second most massive GGC as its nucleus and is now in a process of tidal disruption by the Milky Way, leading eventually to a complete merger.
In this paper, we discuss our photometry of Cen, which is the same data set used in the preliminary study by Lee et al. (1999), analyzing in detail the multiple stellar populations and their age-metallicity relations. The use of high precision and wide-field CCD photometry as presented here is essential for a better understanding of the characteristics and evolutionary history for Cen. We have also found some new properties of the various populations of Cen which were not apparent in the previous photometric studies. In Sec. 2 we describe our observations, the data reduction, and the photometric calibration. We present the resulting CMDs in Sec. 3 after subtracting the contamination of the field star sequence using the index which is the sensitive metallicity indicator of the & Strömgren photometric system. We also present some characteristics of various population sequences, such as the RGB, the RGB bump, the blue straggler stars (BSSs), and the HB, in the CMD of Cen. In particular, we present the evidence for multiple stellar populations evinced by the structure of the RGB. In Sec. 4, we present radial distributions of the RGB, HB, and BSS populations. Sec. 5 is devoted to the derivation of internal age-metallicity relation of Cen from our population models. In Sec. 6, we discuss the origin of Cen and consider the possibility of other massive GCs having a metallicity spread and multiple stellar populations like Cen. We summarize our results in Sec. 7.
2 OBSERVATIONS, DATA REDUCTION, AND PHOTOMETRIC MEASUREMENT
2.1 Observations
All the observations were made using the Cerro Tololo Inter-American Observatory (CTIO) 0.9m telescope and Tektronix 2048 No. 3 CCD during six nights of an observing run in 1996 April 5 - 10. At the f/13.5 Cassegrain focus, the image scale of the CCD is 0.396 arcsec/pixel, which gives a sky coverage of arcmin2. We covered nine regions in a 3 3 grid of Cen through the Johnson and filters, and observed 6 to 8 sequences of this grid per night. In total, 40 to 42 frames were taken in each filter and each field. Our whole program field, centered on the cluster, encompasses approximately a arcmin2 area of Cen, which approximates the area enclosed by the half-tidal radius. Exposure times were 180 sec and 120 sec for and , respectively. The seeing was between 1.0 and 1.7 arcsec, and all of the observing nights were fully photometric. The positions of all observed fields are given in Table 1 and in Figure 1.
The raw CCD frames were processed by zero-level subtraction followed by sky flat-field division using the IRAF QUADPROC routines to take into account the four amplifiers used. All exposure times were sufficiently long so that the center-to-corner shutter timing error was negligible. Typically, these procedures produced object frames flattened to better than 0.7%. Each of the 40 - 42 CCD frames for each filter and each field was reduced separately using the DAOPHOT II and ALLSTAR photometry package (Stetson 1987, 1995). Between 50 and 100 bright and isolated stars were used to construct the point-spread function (PSF) for each frame. The shape of the PSF was made to vary quadratically with radial position in the frame. The mean difference between the PSF-based magnitude and the total magnitude of selected PSF stars was calculated, and this aperture correction was applied to PSF-based instrumental magnitude for every star in each frame. The DAOMATCH/DAOMASTER programs (Stetson 1992) were then used to match stars of all frames for each filter and each field, and to derive their average instrumental magnitudes and rms scatters, keeping only those stars that were detected in at least 20 frames for each filter and each field. Finally, the mean instrumental and magnitudes were matched to form the color.
On each night, standard stars from the list of Landolt (1992) were observed to derive coefficients of the transformation equations between the instrumental magnitudes and the standard system magnitudes. The 33 standard stars observed cover and ranges of -0.27 to 1.91 and 11.08 to 15.02, respectively. The atmospheric extinction coefficients in each color have been determined by the same standard stars at different air masses. The final transformation equations were obtained by linear least-square fits. They are
where and are the color indices and visual magnitude in the standard system, and refer to instrumental magnitudes corrected for extinction. The calibration equations relate observed to standard values with rms residuals of 0.012 mag for both of and , as shown in Figure 2.
2.2 & Strömgren Observations
As part of our investigation of the metallicity of RR Lyrae stars in Cen, we have obtained & Strömgren CCD frames with the CTIO 0.9 m telescope and Tektronix 2048 No. 3 CCD, during three nights of an observing run in 1997 March. These observations cover similar fields to those of our observations. The details of observations and data reductions for these frames are described in Rey et al. (2000). We used these photometric data in order to discriminate the foreground Galactic field stars from the Cen member stars using different distributions in the [=] vs. diagram (see Section 3.2).
2.3 Comparison with Previous Results
We compared our CCD photometry with data taken from other studies for the stars in common. We made a comparison, shown in Figure 3, with the and CCD photometry of the Cen HST calibration field obtained by Walker (1994). The mean difference in the sense our measurements minus Walker’s is -0.030 0.017 and -0.007 0.016 in and , respectively, where the uncertainty is the standard deviation of the mean. Figure 3 also shows a comparison with photometry of Alcaino & Liller (1987). The mean differences are negligible, 0.007 0.023 and 0.001 0.078 in and , respectively, although with larger scatter per star.
3 STELLAR POPULATIONS OF CENTAURI
3.1 Color-Magnitude Diagrams
Figure 4 shows the , CMDs for each of the nine program fields, separately. The field F5 corresponds to the one placed on the cluster center. Figure 5 shows the , CMD of all observed stars in Cen, where more than 130,000 stars in our program fields are plotted. To eliminate the field stars superimposed on the Cen sequences (see Sec. 3.2), we matched photometric data with those from & Strömgren photometry. Due to the lower signal-to-noise ratio of the & Strömgren data compared to that for , the matched CMD includes only about 85,000 stars. These color-magnitude data for Cen stars and for field star candidates with 16.0 are tabulated in Table 2 and Table 3, respectively. The x-y positions in the tables refer to the pixel coordinates relative to the origin of the field F1. The full data table will be published in a forthcoming paper. For the following analyses, we selected stars with a frame-to-frame errors in the and magnitudes of less than 0.05 mag, with the CMD resulting from this more restrictive cut containing only 38,000 objects.
3.2 Field Star Elimination
As shown in the CMDs, the signature of the Galactic field star contamination is evident, primarily as a swathe of stars with 0.4 0.8 for 16 and with many fainter redder stars. This field star sequence, which probably corresponds to the old disk stars (Jonch-Sorensen & Knude 1994; Ng et al. 1995; Kaluzny et al. 1996, 1997), obviously complicates the interpretation of the data for some interesting sequences such as the red horizontal-branch (RHB), the asymptotic giant-branch (AGB), and the RGB.
The field star contamination can be minimized by using the metallicity-sensitive index, defined as from the & Strömgren photometric system (Anthony-Twarog et al. 1991; Twarog & Anthony-Twarog 1995; Anthony-Twarog & Twarog 1998). The & Strömgren photometric system is an extension of the standard Strömgren intermediate-band photometric system with the inclusion of a fifth filter, , centered on the K and H lines of Ca II (90 FWHM). We isolated relatively metal-rich field stars from the more metal-poor cluster members using the vs. diagram. Because even the most metal-rich ([Fe/H] -0.6, Pancino et al. 2002) stars in Cen are relatively metal-deficient compared to the typical disk field stars (Jonch-Sorensen & Knude 1994; Twarog & Anthony-Twarog 1995; Wyse & Gilmore 1995), it is possible to eliminate foreground field stars through the use of the index without seriously biasing the direct estimate of the abundance of stellar populations in the cluster.
As shown in the of Figure 6, at a given , more metal-rich stars are offset from the metal-poor ones by virtue of a larger index, therefore an upper envelope line which differentiates field stars can be drawn. Any star which lies below this envelope is tagged as a field star. The upper envelope of these field star candidates appears to cover empirical isometallicity lines for main-sequence dwarfs with [Fe/H] = -0.5 and 0.0 (solid lines, Anthony-Twarog et al. 2000). We selected 293 field star candidates for 16.0. The selected field stars show a prominent sequence, as expected, running through the middle of the Cen CMD (closed circles in the of Fig. 6). The foreground field stars at 16.0 are overlapped with the SGB and the RGB stars in the vs. diagram making their identification difficult from photometry alone. The radial distribution of the field star candidates is uniform and is significantly different from that of the Cen RGB sequence, which confirms that most of our selected field star candidates are in fact not members of Cen (see Fig. 14a). This suggests that the use of the vs. diagram is ideal for eliminating more metal-rich field stars from the member stars of Cen as well as most GGCs with reasonable resolution, and hence for constructing “cleaned” CMDs. The index is about 3 times more sensitive to metallicity than the index (see Fig. 9 of Twarog & Anthony-Twarog 1995), therefore it is a better discriminator of field stars from cluster member stars. In Figure 7, we present the result of the decontamination of the CMD for Cen, showing data with frame-to-frame errors in the and magnitudes of less than 0.05 mag after subtraction of the subset of field stars obtained from Fig. 6. The resulting “cleaned” CMD has allowed us to obtain a more accurate distributions of bright stars on the RHB, AGB, and RGB 111 Note that the cleaning of the field stars in our study is valid only for 16.0 and [Fe/H] -0.6 dex. .
3.3 Multiple Stellar Populations from Red-Giant Branches
One of the most notable features in our CMDs is the most metal-rich (MMR) sequence well separated from the bulk of bluer, more metal-poor stars, which was first discovered by Lee et al. (1999). The distinct feature of the MMR RGB sequence was later confirmed by Pancino et al. (2000) from their independent wide-field survey and could also be identified from other following surveys based on different photometric systems (e.g., Strömgren system of Hilker & Richtler 2000; Washington system of Majewski et al. 2000; Frinchaboy et al. 2002).
In order to investigate the nature of the RGB, in Figure 8, we plot histograms of the RGB color distribution for two magnitude ranges (12.5 13.0 and 13.0 13.5). Dereddened colors were derived, adopting = 0.12 (Rey et al. 2000). The RGB stars are selected in a relatively narrow magnitude range, so that the field star and the RGB bump contamination is minimized, and which also avoids mixing of the RGB stars with different metallicities in the histogram. The presence of three pronounced RGBs [i.e., most metal-poor (MMP), metal-poor (MP), and metal-rich (MR) RGBs] can be identified, while the MMR component is not as well distinguished as it is in the CMDs due to the small sample size of such stars in these magnitude ranges.
Because the intrinsic color of the RGB will vary with its metallicity, we obtained mean [Fe/H] abundances for the four main components using the relation between [Fe/H] and at fixed magnitude, based on the data of GGCs compiled by Ferraro et al. (1999a, hereafter F99). The peaks in the histograms correspond to colors of fiducial lines of four components at = 12.75 and = 13.25, which were adjusted by eye. From RGB fiducial lines of 55 GGCs in the absolute plane of [, ], which was kindly provided by F. R. Ferraro, we plotted the of the RGB measured at = -1.35 and -0.85 as a function of [Fe/H] in the Zinn & West (1984) scale. These two values of correspond to the mean magnitude of each magnitude range of Fig. 8, adopting V = 14.1 (Rey et al. 2000). Finally, we derived relations of [Fe/H] vs. for GGCs by third order polynomial fit (see also F99). We estimated their mean [Fe/H] abundances as -1.75, -1.45, -1.00, and -0.55, respectively, which are averaged from values obtained at two magnitude ranges using these relations. In Fig. 8, we label the four main components and indicate their mean [Fe/H] abundances 222 We compared photometric errors with the dispersions of Gaussian fitting for four RGB components in the histograms, and found that the dispersions, which must arise from an intrinsic metallicity spread, are much larger (factor of 2 - 5) than the photometric errors. . The [Fe/H] values of the first three components agree well with those by Pancino et al. (2000) at [Fe/H] = -1.7, -1.3, and -0.8, and by Frinchaboy et al. (2002) at [Fe/H] = -1.6, -1.2, and -0.9. Our metallicity estimation for the MMR RGB component ([Fe/H] -0.55) is also consistent with the value ([Fe/H] = -0.60) found by Pancino et al. (2002) from their high resolution spectroscopy observations for these stars 333 Because the color of the RGB also slightly depends on the age of the stars, we have to consider an effect of different age of the MMR RGB stars compared to the dominant metal-poor stars. Assuming the age of the MMP population is 12 Gyr and the MMR population is 4 Gyr younger than the MMP one (see Sec. 5), we calculate the offset in the RGB color associated with an offset in age as 0.05 mag at = -1 using the isochrones with z = 0.005 (Yi et al. 2001). This produces only about 0.1 dex offset in [Fe/H] of the MMR component (i.e., [Fe/H] -0.45). .
In the light of the detection of four separate populations with different metallicities, we divided our photometry of the RGB stars into four different sub-populations (i.e., MMP, MP, MR, and MMR RGBs). This division of the RGB stars will be adopted for the following analyses of the RGB stars. We relied on the shape of isochrones to divide the RGB stars into four sub-populations directly in the CMD, assuming the shape of the cluster RGB with different metallicity can be adequately represented by isochrones. We selected isochrones (Yi et al. 2001), which go through the dips in the histogrms and fully cover the RGB color distribution of Cen. We fitted isochrones to quadratric or cubic relations and then, using these relations, divided all RGBs into four sub-populations in the plane of vs. . The metallicity for each sub-population was empirically estimated using the relation of [Fe/H] vs. of GGCs, as explained above. We obtained relations between [Fe/H] vs. at = -1, 0, and +1. The metallicity for each RGB sub-population was obtained at each magnitude, and then averaged. The mean [Fe/H] of the four sub-populations are -1.8, -1.5, -1.1, and -0.5, respectively, and their uncertainties are 0.1 - 0.3 dex. These metallicities are, within the error, consistent with the ones obtained from the histogram of the color distribution (see Fig. 8).
Figure 9 shows a zoomed CMD of the RGB region which is divided into four RGB sub-populations. In order to estimate the reliability of our division of the RGB stars into four sub-populations, and of their estimated metallicities, we compared them with [Fe/H] values ([Fe/H]SK96) for a set of giants (bright giants and subgiants), which were obtained from spectroscopic Ca abundances by Suntzeff & Kraft (1996, hereafter SK96). In Fig. 9, we have marked the common stars observed by SK96 and us using different symbols for different metallicity groups: closed circles are stars with [Fe/H]SK96 -1.7, crosses have -1.6 [Fe/H]SK96 -1.3, closed squares have -1.3 [Fe/H]SK96 -0.7, and triangles have [Fe/H]SK96 -0.7. The giants belonging to the first three metal-poor groups of the SK96 sample are located consistently in our RGB sequences. However, the majority of the most metal-rich giants of SK96 deviate from the sequence of our MMR RGB. Most of these giants have [Fe/H]SK96 -0.3 - -0.6, and therefore these should be located near our MMR RGB sequence, if our method dividing RGB sub-populations is reliable. It is worth noting that the Ca triplet calibrations adopted by SK96 are usually rather uncertain in the high metallicity regime (see Norris et al. 1996; Pacino et al. 2002). Furthermore, from the first direct abundance determination based on high-resolution spectroscopy for the most metal-rich RGBs (i.e., “RGB-a” stars), Pancino et al. (2002) obtained their mean metallicity as [Fe/H] -0.60, which is about +0.3 dex more metal poor than one obtained from SK96 (see also Origlia et al. 2003). While SK96 obtained [Fe/H] = -0.23 and -0.33 for ROA 300 and ROA 371, respectively, Pancino et al. (2002) present their metallicities as [Fe/H] = -0.77 and -0.95, respectively, which are more consistent with their locations in the CMD. In any case, we believe this ambiguity of metallicities for a few of the brighter MMR RGB stars will not invalidate our below analyses.
3.4 Red-Giant Branch Bumps
Most CMDs of GGCs show the intriguing feature of an RGB bump, which is an evolutionary pause on the first-ascent RGB (Thomas 1967; Iben 1968; Fusi Pecci et al. 1990; Cassisi & Salaris 1997). The number of observational detections of the RGB bumps for GGCs has grown recently and the dependence of the RGB bump luminosities on their metallicities is now well established (Fusi Pecci et al. 1990; Cassisi & Salaris 1997; Alves & Sarajedini 1999; F99; Zoccali et al. 1999). The RGB bump of most GGCs generally is clumped due to the homogeneous metallicity among their stars. However, considering the wide spread of metallicity of the Cen RGB stars, one would expect a continuous and slanting RGB bump in the CMD of Cen, because the luminosity of the RGB bump becomes fainter as its metallicity increases. The large sample of stars, coupled with the high photometric accuracy, allowed us to identify this feature on the RGB of Cen. As one can see in our CMDs (e.g., Fig. 8), from [()o, ] (0.8, 14.3) to (0.9, 14.9), an inclined sequence of the RGB bump is evident. The RGB bump of the MMR population with [Fe/H] -0.5 is less clearly defined, as its sample is not populous, but probably is separated from the main feature of the RGB bump in the region of [()o, ] (0.95, 15.5).
In order to see the shape of the RGB bump in detail, we arbitrarily sliced the RGB into seven groups with different metallicities, and then examined their RGB bump features in the differential LFs. In the of Figure 10, we present seven RGB groups. The division of different RGB groups and the determination of their metallicities (see Table 4) are the same as ones presented in Sec. 3.3. The LFs for seven RGB groups are presented in the of Fig. 10. These LFs were obtained by counting the number of stars in bins of 0.05 mag width in . From the detection of slope change in the cumulative LF for each RGB group, we determined the magnitude of these RGB bumps. All bumps for the seven RGB groups are clearly defined and marked with arrows.
From our determination of luminosity and metallicity for seven RGB bumps of Cen, we constructed a plot of the RGB bump luminosity against metallicity and compared this with a general relation among GGCs, in order to see whether sub-populations in Cen follow this general trend. F99 gave a tight relation for the RGB bump luminosity (), in terms of the magnitude difference between the RGB bump () and the zero age horizontal-branch () in the RR Lyrae instability strip, as a function of metallicity using the data for 47 GGCs. In measuring the of Cen, we follow the procedures consistent with those of F99. We adopted a single mean magnitude of the HB stars for all RGB bumps, excluding the most metal-rich one, as = 14.640.10, which corresponds to the mean value for RR Lyrae stars at [Fe/H] -1.5 (see Fig. 6b of Rey et al. 2000). It is difficult to select the MMR RHB clump stars, because the expected location of the RHB clump overlaps with that of the more metal-poor RGB stars in the CMD. Therefore, from our synthetic HB models (see Sec. 5.1), we estimated = 14.700.04 for the mean magnitude of the RHB clump with [Fe/H] -0.5 and age 8 Gyr. It should be noted that metal-rich clusters with [Fe/H] -1.0 have no RR Lyrae stars and their RHB magnitude would be brighter than that of the RR Lyrae stars, if some existed (see the discussion in Lee, Demarque, & Zinn 1987, 1990; Castellani, Chieffi & Pulone 1991). In order to provide a consistent determination of with those of the metal-poor HB, the of the RHB clump at the level of the RR Lyrae instability strip was evaluated by adding 0.100.05 mag (i.e., = 14.80), according to the suggestion by Fullton et al. (1995) and Cassisi & Salaris (1997). The was converted to magnitude as suggested by F99 (see their Equation 2), and then finally, the were derived. The errors have been calculated by quadratically combining the errors on and , where the uncertainties of and are standard deviations of the mean and binning size of LF, respectively. Table 4 lists the relevant observational quantities for the RGB bumps of Cen.
In Figure 11a, we present the parameter as a function of metallicity for the seven groups of the Cen RGB (closed circles). The data for 42 GGCs, is also plotted as open circles. The best fit to the data for GGCs obtained by F99 (see their Table 6) is also overplotted in the figure (dotted line). As shown in the figure, the behavior of Cen regarding its relation between luminosity and metallicity of the RGB bumps shows excellent agreement with that for the GGCs. In order to avoid an uncertainty of ZAHB level of the MMR population predicted by our synthetic HB models, it is useful to see directly the absolute magnitude of the RGB bump [] as a function of metallicity. In Figure 11b, we plotted against [Fe/H]ZW for 42 GGCs from the catalogue of F99 and superimposed a best fit to the data as a dotted line, which shows a tight correlation. The RGB bumps with different metallicities of Cen also follow the general relation found for GGCs in this diagram.
3.5 Horizontal-Branch Stars
From the distinct multiple populations of the Cen RGB stars and their wide spread of metallicity, it is naturally expected that the HB distribution of Cen should be represented by a mixture of different populations following the internal age-metallicity relation (Lee et al. 1999; Hughes & Wallerstein 2000; Hilker & Richtler 2000; see Sec. 5 for details). Figure 12 shows the HB region of the CMD after subtraction of the field stars. In this figure, the RR Lyrae variables are plotted using mean and values from our photometric data. The HB of Cen is predominantly blueward of the RR Lyrae instability strip, which is in agreement with the low metallicity of the majority population of this cluster. It is also clear that the BHB of Cen shows a long tail of very blue stars, with gaps occurring at 16.6, 17.0, and 17.7. The overall HB distribution is consistent with the discrete nature of the RGB populations: there are BHB and RR Lyrae variables mainly associated with the metal-poor and old RGBs (i.e., MMP and MP RGBs), some RR Lyrae and RHB stars associated with the metal-rich and slightly younger population (i.e., MR RGB), and finally the RHB clump superimposed on the RGB, which must be associated with the most metal-rich and younger population (i.e., MMR RGB; see Sec. 5 for details).
The “cleaned” CMD has allowed us to obtain a more accurate distribution of the RHB stars which must be located from the red edge of the RR Lyrae instability strip to the base of the AGB stars. We defined RHB stars as having 14.20 14.85 and 0.55 0.71, marked by a box (dashed line) in the CMD. The CMD indicates that the RHB stars are loosely grouped and separated by a luminosity gap from stars at the base of the AGB. The vertical extent of the RHB stars in the CMD is about 0.7 mag. This indicates that the majority of these stars are metal-rich ([Fe/H] -1.0) and have higher stellar masses, following blue loops prior to rapidly evolving redwards (Lee & Demarque 1990; Yi, Demarque, & Kim 1997). Some bright RHB stars are probably not ZAHB stars, but may be MP ([Fe/H] -1.5) stars that have evolved from the BHB, at the final phase of core helium burning, to the AGB (Lee et al. 1990). Several bright stars, about 0.7 mag above the mean magnitude of the RHB stars, with 0.58 0.73 and 13.5 14.0 are believed to be highly evolved low mass stars from the MMP ([Fe/H] -1.8) BHB. There is a group (13.95 14.60, 0.71 0.79) of stars slightly brighter than the RHB stars which are well separated from the base of the AGB but mixed with stars in the red edge of the RHB. They are probably the BSS progeny candidates evolved from the main population of the BSS (see Sec. 3.6).
3.6 Blue Straggler Stars
Due to small sample size and large photometric errors, only a few BSSs have been reported from the early photometry for Cen (e.g., Da Costa, Norris, & Villumsen 1986). Recently, Kaluzny et al. (1996, 1997) reported about 200 BSS candidates as a byproduct of their OGLE project. Our photometry has also revealed a significant population of the BSS in Cen. In our CMDs, most of the BSSs form a well defined sequence extending from the MSTO to about 2 mag brighter than the MSTO.
Fig. 12 shows the BSS region of the CMD where the total of 222 BSSs are plotted as closed circles. The definition of the “BSS region” is somewhat arbitrary at the edge between the BSS region and the upper MS. It should be noted that, unlike the distribution of the BSSs in many other GCs, the blue edge of the BSS sequence of Cen is clearly defined. We shall refer to it as the blue straggler main sequence (BSMS) following the suggestion of Mandushev et al. (1997) from a narrow and tight BSS distribution seen in M55. The BSS sequence redder than the BSMS shows a broad distribution in color. The spread in color is probably intrinsic and could be attributed to the effect of stellar evolution of the BSSs with different masses off the BSMS. The broadening may partially result from the wide spread of metallicity of Cen, given that the mean location of the cluster BSS sequence is correlated with its metallicity, since the BSS sequences are progressively located to the redside with increasing cluster metallicity (Sarajedini & Da Costa 1991; Fusi Pecci et al. 1992). However, considering the fact that the metal-poor population comprises more than 80 % of the Cen population, this metallicity effect may be small.
In Fig. 12, we overplot isochrones (Yi et al. 2001) for the ZAMS (solid line) and a few different ages (2, 3, 4, 5, and 6 Gyr, long dashed lines) for the BSS region of the CMD. These isochrones match the MMP population of Cen with Z = 0.0006 (see Sec. 5), and correspond to a MSTO mass range of about 1.0 - 1.5 M⊙, consistent with the general expectation of higher masses for the BSSs than for the MS stars. We also plot the 12 Gyr isochrone (gray line) as a reference. The brightest BSS lies below the 2 Gyr isochrone, which suggests that the masses of the BSSs in our sample do not exceed 1.4 M⊙. In our final list of the BSSs, we excluded a few bright stars which are located above the BSS sequence at 15.2 - 15.8, due to their large scatter from the main BSS sequence and their proximity to the HB.
There is an intriguing group of stars (crosses in Fig. 12) which are separated from the bulk of the main branch of the BSSs and lie above the cluster SGB in the region of 16.0 16.8 and 0.40 0.55. At first glance, these stars appear to lie in a series of distinct sequences evolving from the BSSs towards redder colors. They are unlikely to be field stars, because, at 16.5, they have bluer colors than expected for the foreground field sequence. Such stars, so called “yellow straggler stars” (YSSs), have been found in many clusters, and interpreted as being an optical blend of BSSs with SGB stars (Ferraro, Fusi Pecci, & Buonanno 1992; Ferraro et al. 1992). The images of these stars were inspected on the CCD frames in order to check the possibility that our photometry of these stars has been affected by their neighboring stars. Most (about 70 ) of these stars are found to be isolated and clearly defined. Hesser et al. (1984) explained the YSSs as being evolved BSSs which are located between the BSSs and the cluster giant branch (e.g., post-mass-transfer binaries, Landsman et al. 1997). The lack of YSSs in many GCs is ascribed to the effects of rapid stellar evolution after the hydrogen exhaustion in the core of the BSS (Sarajedini & Da Costa 1991; Sandquist, Bolte, & Hernquist 1997). However, considering the large number of BSSs in Cen, we cannot rule out a possibility that some of these stars are chemically unmixed structures evolved from the main BSS sequence (e.g., Sandquist et al. 1997). On the other hand, these YSSs appear to be separated from the main BSSs by a gap and are located about 0.7 mag brighter than the BSSs. This suggests that, alternatively, some of these stars might be the binary BSSs with roughly equal masses (Mandushev et al. 1997). This latter hypothesis is consistent with the observed centrally concentrated radial distribution of the YSSs (see Sec. 4.3) and the hint of higher probability of finding binary BSSs in the inner region of Cen (see Table 8 of Kaluzny et al. 1997).
It is suggested that some stars located both redder and brighter than the normal RHB stars could be the BSS progeny candidates, which may be evolved from the BSSs and are in the core helium burning phase (Renzini & Fusi Pecci 1988; Fusi Pecci et al. 1992). In several GGCs, a few BSS progeny candidates were identified (Fusi Pecci et al. 1992; Ferraro et al. 1997a, 1997b, 1997c, 1999b). Given our finding of a large population of the BSSs and a few YSSs, we can also expect the existence of the BSS progeny candidates in Cen. From the comparison with a CMD of M3 (Ferraro et al. 1997a), we estimate the possible region of the Cen BSS progeny stars in our CMD. In Fig. 12, we define the Cen BSS progeny region as a box (solid line; 13.95 14.60, 0.71 0.79) following that of M3 represented by Ferraro et al. (1997a, see their Fig. 18). There are 24 stars in this region, which are slightly brighter than the normal RHB stars and well separated from the base of the AGB.
According to the theoretical models for the formation of BSSs, the BSS LF may be a good tool to discriminate between different origin scenarios: stellar collisions and primordial binary mergers (e.g., Bailyn & Pinsonneault 1995, hearafter BP95). The BSSs formed by two different processes would lead to different lifetimes and evolutionary tracks in the CMD and, therefore, lead to different LFs for the BSSs. The BSSs created by primordial binary mergers would be seen less often at the bright end of the LF compared to the BSSs created by stellar collisions. As shown in Figure 13, we obtained observed BSS LFs of Cen for the inner ( 3rc, ) and outer regions ( 3rc, ) of the cluster, respectively, and compared those with the models of BP95. The error bars represent Poisson noise. The models of BP95 are represented by a dashed line (collisional model) and a dotted line (primordial binary merger model), respectively. Estimating the MSTO magnitude of Cen as = 18.2 from our photometry and assuming a differential bolometric correction of -0.1 mag between the BSS and the MSTO stars, we derive the BSS bolometric luminosity from the relation , following BP95. The observed LFs of the inner and outer regions appear to be different from each other, at the 99.9 % confidence level from the Kolmogorov-Smirnov (K-S) test. While the BSSs in the inner region show a flat LF for all magnitudes, the BSS LF of the outer region has a shape of increasing numbers of stars with magnitude. Furthermore, the shape of the BSS LF of the inner region appears to be similar to that of the collisional model (dashed line), while the LF of the outer region resembles the merger model (dotted line). The comparison in Fig. 13 presents observational support for the hypothesis that the origin of BSSs might be at least partially affected by overall environmental conditions even in different regions of a single GC (Ferraro et al. 1997b; Rey et al. 1998), in addition to the case of GCs with different overall structural properties (Fusi Pecci et al. 1992; Sarajedini 1993; Piotto et al. 1999).
4 RADIAL DISTRIBUTIONS
4.1 Red Giant Branch stars
Norris et al. (1997) noted that the metal-rich RGB stars of Cen are more centrally concentrated than the metal-poor ones. From their wide-field observations, Hilker & Richtler (2000) also confirmed that the metal-rich RGBs with [Fe/H] -0.9 are more centrally concentrated than the metal-poor counterpart with [Fe/H] -1.8. However, they found that the most metal-rich RGB stars with [Fe/H] -0.5 appear less concentrated than the other metal-poor populations. On the other hand, Pancino et al. (2000, 2003) suggested that their most metal-rich RGB stars (i.e., “RGB-a” stars) have a similar distribution with their intermediate metallicy RGB ones, and both seem to be more centrally concentrated than the most metal-poor population.
The cumulative radial distributions of our four RGB sub-populations (see Sec. 3.3) with different metallicities are plotted as a function of the projected radius in Figure 14a. We included only bright RGB stars with 15.0 for these distributions. As a reference, we present a distribution of the probable foreground field stars (thick gray line) extracted from our & Strömgren photometry (see Sec. 3.2). The radial distribution of the selected field star candidates is uniform, and significantly different from those for the Cen RGB stars. Two-sided K-S tests show that the radial disribution of the MP RGB is different from that of the MPP and the MR RGB at the 77.4 % and 57.2 % confidence level, respectively. The radial distribution of the MR RGB is found to be different from that of the MPP RGB at the 96.9 % confidence level. However, we could not confirm a central concentration of more metal-rich RGB stars compared to metal-poor counterparts as suggested by previous studies (Norris et al. 1997; Hilker & Richtler 2000; Pancino et al. 2000).
A notable feature of Fig. 14a is the radial distribution of the MMR RGB with [Fe/H] -0.5 which is different from those of other more metal-poor ones. The MMR RGB appears to marginally show a bimodal distribution. The cumulative radial distribution suggests that the MMR RGB has a slight dip in the distribution between 8 and 17. A two-sided K-S test applied to two distributions between the MMP and the MMR RGBs confirms that they are different at the 99.6% significance level. Since all RGB samples have approximately the same photometric accuracy and completeness, our analysis tentatively suggests that the MMR RGB stars have a bimodal radial distribution, with a high frequency in the inner and outer regions but a dip in the intermediate region. In Figure 15, we plot a x-y position map for the MMP (Fig. 15a) and the MMR (Fig. 15b) RGB stars with 15.0. A gap of the distribution in the MMR RGB stars toward the east direction, which can primarily explain this bimodal distribution, is visible. On the other hand, the MMP RGB stars show a different distribution without a hint of bimodality. For more clarity, in Fig. 14b and Fig. 14c, we also present cumulative radial distributions of the MMP and the MMR RGB stars in the regions of east and west direction, respectively. The K-S tests show that the bimodal distribution of the MMR RGB in the eastern region appears to be more significant (99.9%) than that for the western region (90.1 %). A group of the MMR RGB stars in the outer part of the eastern region seems to be isolated from the main distribution, although statistical significance is low due to small number counts for these stars. However, recently, Pancino et al. (2000, 2003) also presented a complex and perturbed distribution for their most metal-rich RGB stars [see also Fig. 3 of Pancino et al. (2000) and Fig. 1 of Pancino et al. (2003), respectively]. Both our and Pancino’s results suggest that there might be a peculiar substructure among the MMR RGB stars of Cen.
4.2 Horizontal Branch Stars
We present the radial distributions for the BHB and the RHB stars in Figure 16. In order to check if they are consistent with being drawn from the same parent distribution of the RGB, we also present radial distributions of two RGB populations (gray lines) with [Fe/H] -2.0 - -1.3 (i.e., MMP and MP RGBs) and [Fe/H] -1.0 (i.e., MR RGB) which must be associated with the BHB and the RHB, respectively. We have made the comparison for stars with a roughly equivalent magnitude range of 14.0 15.0, so as to minimize a difference of completeness between the HB and the RGB stars. In Fig. 16a, the BHB shows a consistent distribution with that of the MMP and the MP RGB populations. In contrast, the radial distribution of the RHB is somewhat different from that of the correspondng MR RGB (Fig. 16b), with the RHB (solid line) appearing to be more centrally concentrated than the MR RGB 444 It is difficult to find a reason for the inconsistency between the RHB and the MR RGB radial distributions. From an evident feature of the field star sequence extending through the RHB in the CMD (see lower panel of Fig. 6), it might be suggested that some field stars from our selection could really be bona-fide RHB stars, if our field star selection was overly restrictive. In this case, if we convert some field stars, whose radial distribution is uniform for all radii (see Fig. 14a), into RHB stars, the radial distribution of the RHB can be made similar to that of the MR RGB. However, we consider this explanation rather unlikely, considering the clear separation between the RHB and the field star candiates in the vs. distribution (see upper panel of Fig. 6). . A one-sided K-S test shows that the distribution of the RHB stars is different from that of the MR RGB stars at the 77.6% confidence level. In Fig. 16c, we also compared the radial distributions between the BHB and the RHB. The RHB shows more central concentration than the BHB with 89.2% K-S probability. This result is consistent with the situation for most dwarf galaxies in the local group (Harbeck et al. 2001).
We show a radial distribution of stars located in the hot and faint HB (16.018.4, -0.400.15) in Figure 17. For comparison, we also plot a distribution of the MS and SGB stars (16.018.4, 0.50.8) in the same magnitude range of the hot HB stars. The MS and SGB stars have been chosen to lie within 0.05 mag in of the cluster fiducial sequence 555 Although the MS and SGB stars have been selected around the fiducial, a small contamination by field stars might still be present for 16. . The hot HB stars are apparently more concentrated toward the cluster center than are the MS and SGB stars. From one-sided K-S test, we found that the central concentration of the hot HB stars is more significant with a 99.0% confidence level. This result is consistent with that of Bailyn et al. (1992) that extreme BHB stars of Cen are centrally concentrated with respect to the SGB and the BHB stars.
4.3 Blue Straggler Stars
We compare the radial distribution of the BSSs with that of the SGB/MS stars selected to have similar photometric uncertainty and completeness. The SGB/MS stars have been chosen to lie within 0.05 mag in of the cluster fiducial sequence between 16.0 18.4. Figure 18a shows the cumulative radial distribution of the BSSs (solid line) compared with the SGB/MS stars (dotted line). This figure appears to indicate that the radial distribution of the Cen BSSs is similar to that of the SGB/MS stars with similar magnitude and might seem to contradict the general results that the BSSs are more massive and more centrally concentrated than the other cluster stars, in the context of the BSS formation scenario as being due to the merger of close binary stars or to the direct collision of two or more stars (Stryker 1993; Bailyn 1995). In Fig. 18b, in order to secure more stars in the central region, we present cumulative radial distributions for the BSSs and the SGB/MS stars with frame-to-frame error in the and magnitudes of less than 0.1 mag, which is larger than that used for our final good photometric list and Fig. 18a. A K-S test applied to these two distributions indicates the BSSs to be more centrally concentrated than the SGB/MS stars at the 97.0% level. Although our results are based on data with some large errors, we suggest it can not be ruled out that the radial distribution of the BSSs is different to that of the SGB/MS stars, the former being more concentrated toward the cluster center. The spatial distribution of the YSSs is compared with that of the bright (16.0 17.2) BSSs in Fig. 18c. The YSSs appear to be more centrally concentrated than the bright BSSs. A one-sided K-S test shows that the distribution of the YSSs is different from that of the bright BSSs at the 95.3% significance level. This suggests that the YSSs are slightly higher mass single stars that evolved from the main BSS population, or alternatively, may be the high mass binary BSSs.
5 AGE-METALLICITY RELATION OF CEN
For sufficiently old ( 8 Gyr) stellar populations, evolutionary models (e.g., Lee et al. 1994) predict that the surface temperature distribution of the HB stars is very sensitive to age, which makes it an attractive age indicator from the interpretation of the HB morphology in the CMDs. For a fixed metal abundance, age differences of several billion years produce dramatic changes in the morphology of the HB in the sense that older clusters have bluer HB’s. Our most recent update of the HB models makes the HB morphology more sensitive to age (see Fig. 9 of Rey et al. 2001) compared to our earlier models (Lee et al. 1994). For the case of clusters and dwarf galaxies with multiple stellar populations and internal age-metallicity relation among them, once we have information on metallicities of different populations it is possible to interpretate a HB morphology in terms of relative age differences between different populations. In our following analysis using our updated synthetic HB models for Cen, we have estimated the age difference between four sub-populations from the HB morphology once a good match is obtained between the observed and model HB’s. In particular, we have made an estimation of the total age spread within Cen from the location of the RHB clump (i.e., the MMR RHB) associated with the MMR RGB with respect to the BHB associated with the MMP RGB.
5.1 Horizontal-Branch Models and Synthetic Color-Magnitude Diagram
We constructed synthetic CMDs of Cen using our most updated version of the HB population models based on the Y2 isochrones (Yi et al. 2001) and corresponding HB evolutionary tracks (Yi, Demarque, & Kim 1997). First of all, we assumed the absolute age of the oldest GGCs and the MMP population of Cen is about 12 Gyr, as suggested by the Hipparcos distance calibration and other improvements in stellar models (Gratton et al. 1997; Reid 1998; Chaboyer et al. 1998; Grundahl, VandenBerg, & Andersen 1998; Yi et al. 2001). We assumed primodial helium abundance = 0.23 and a helium enrichment factor Y/Z = 2, respectively (see Yi et al. 2001). We adopted [/Fe] = 0.3 for the three metal-poor populations with [Fe/H] -0.8 (Norris & Da Costa 1995; Smith et al. 2000), and we assumed that it declines to 0.1 for the most metal-rich population of Cen (Pancino et al. 2002; Origlia et al. 2003). The treatment suggested by Salaris, Chieffi, & Straniero (1993) was used to simulate the effect of -element enhancement. The empirical mass-loss law of Reimers (1975) was used in order to consider the effect of age and metallicity on the mass-loss from the RGB to the HB. The reader is referred to Lee et al. (1990, 1994) and Park & Lee (1997) for the details of model constructions (see also Rey et al. 2001).
After a series of model calculations with various combinations of metallicity and age, we found our best estimates for the metallicities and ages of four distinct sub-populations as [, Age (Gyr)] = (0.0006, 12), (0.001, 12), (0.002, 10.8), and (0.006, 8). The metallicities correspond to the [Fe/H] obtained from the peak values in the color distribution of the RGB stars (see Fig. 8). In Figure 19, the observed CMD of Cen (grey dots) is overplotted by our synthetic HB models, which include the scatter expected from the random errors in magnitude and in color as estimated by our photometry. We also overplotted four isochrones representing four distinct populations. One can see from Fig. 19 that the HB morphology produced by our synthetic HB models is consistent with the observed complex nature of the RGB (see also Fig. 1 of Ree et al. 2002). The RHB clump associated with the MMR RGB overlaps in the CMD with the RGB bumps of the less metal-rich populations. Note again that the BHB is from the combination of the metal-poor and old populations (i.e., MMP and MP RGBs), the RHB is from the metal-rich population (i.e., MR RGB), and finally the RHB clump is from the most metal-rich and younger population (i.e., MMR RGB).
5.2 Age-Metallicity Relation
RR Lyrae stars are intrinsically an abundance-biased sample due to the failure of the metal-rich RHB stars to penetrate into the instability strip. Furthermore, the frequency of RR Lyrae stars at a given metallicity depends on the HB morphology as well as the metallicity distribution of the underlying stellar population (e.g., Lee 1992 for RR Lyrae stars in Baade’s window). Our models suggest that the RR Lyrae variables are mainly produced by the two metal-poor (MMP and MP; = 0.0006, 0.001) populations with similar ages ( 12 Gyr), and some RR Lyraes are from the younger ( 10.8 Gyr) metal-rich (MP; = 0.002) population, which is consistent with the metallicity measurements of these stars (Butler et al. 1978; Gratton et al. 1986; Rey et al. 2000). For the RR Lyrae stars in Cen, we have new metallicity measurements from our & Strömgren photometry (Rey et al. 2000), and therefore more detailed comparison with the models is possible. We confirm that our models reproduce the luminosity vs. metallicity and the period-shift vs. metallicity relations of the RR Lyrae variables in Cen, including the sudden upturn of the RR Lyrae luminosity and corresponding increase in period-shift at [Fe/H] -1.5, which is a result of redward evolution from the BHB (see Rey et al. 2000; Yoon & Lee 2002). This suggests we have a very good understanding of what is happening in the instability strip of Cen.
The estimated ages of the MP and the MR populations in our HB models are based on the observational relations, such as luminosity vs. metallicity and period-shift vs. metallicity of the RR Lyrae stars in Cen (Rey et al. 2000). The suggested age (12 Gyr) of the MP population is supported by the observed number of the RR Lyrae stars in the range of [Fe/H] -2.0 - -1.5. If the age of the MP population is younger than the MMP population by 1 Gyr, for example, more HB stars of the MP population could penetrate into the instabilty strip, and the number of the RR Lyrae stars would be increased, which is not consistent with the observational results. The HB color distribution of the MR component ( = 0.002) in our models is almost centered at the red edge ( = 0.5) of the instability strip with same number of stars on either sides. The observational data suggest that some metal-rich RR Lyrae stars with [Fe/H] -1.0 do exist and they would be unevolved ZAHB stars (see Rey et al. 2000). With these constraints from the RR Lyrae distribution in Cen, we estimate the age of the MR population to be about 1.2 Gyr younger than the MMP and the MP populations 666 While the BHB can be reasonably fitted by HB models with metal-poor and old populations, the model RHB stars ( 80 stars) are too many to be explained by the number of observed stars ( 50 stars). Furthermore, the observed mean luminosity of the RHB stars is brighter than the expected ZAHB levels by about 0.2 mag. As shown in Fig. 12, we suggest some bright stars in the region of the RHB might be old metal-poor stars which have evolved from the BHB towards the AGB. Although there are some discrepancies between models and observations for the MR RHB stars, we strongly suggest that the MR RHB stars are not more than 2 Gyr younger than the MMP population. .
Our models also reproduce 150 RHB clump stars associated with the MMR RGB stars, but only when the age of the MMR population is somewhat younger (a few Gyr) than the MMP population. This is illustrated in Figure 20, where we can see the variation of the RHB clump location in the CMD under different assumptions regarding the age difference between the MMP and the MMR populations. These figures illustrate the relative age estimation from the location of the RHB clump associated with the MMR RGB with respect to the BHB and the MMP RGB stars. Figure 20a shows the case where all the stars in Cen have the same age despite their different metallicities. However, from the shape of the LF of the MMP RGB (see the LF of the RGB1 in Fig. 10), we can rule out the case of no age difference between the Cen populations, because the observed LF does not show a prominent peak at V 14.8 which corresponds to the mean magnitude of the RHB clump predicted by our models. Furthermore, this predicts the blue part of the RHB clump should be clearly bluer than the MMP RGB sequence at the level of the HB. Age differences greater than 6 Gyr (Fig. 20d) can also be excluded from the observed LF of the RGB (RGB6 of Fig. 10), because the observed LF of the RGB does not show a significant peak at V 14.7 due to enhancement of the RGB by the RHB clump. On the other hand, the observed CMDs do not show a spur of the MMR MSTO stars rising above the MMP SGB stars, similar to the feature corresponding to the metal-rich and young ( 7 Gyr) population seen in the CMD of the Sagittarius dwarf galaxy (see Layden & Sarajedini 2000). Therefore we conclude that the acceptable range of age differences are 2 - 4 Gyr as shown in Fig. 20b and c.
This conclusion is somewhat affected by the presence of the RGB bumps associated with the discrete RGBs (see Sec. 3.4), because the expected location of the RHB clump overlaps with that of the more metal-poor RGB bump on the CMD. Therefore, it is important to discriminate the RHB clump from the more metal-poor RGB bump stars for better estimation of relative age between the MMP and the MMR populations. Figure 21 shows the CMD that highlights the RGB and the RGB bump region. For the purpose of the analysis, the RGB is divided into three groups with different metallicities. The RGB bump is shaped as an inclined sequence due to the metallicity spread of the Cen RGB stars. A smaller box indicates the predicted location of the RHB clump with [Fe/H] -0.5, from our synthetic HB models, which is younger ( 4 Gyr) than the MMP population. As shown in the , if 4 Gyr, then the RHB clump is predicted to be superimposed on the RGB bump of the intermediate metallicity (-1.5 [Fe/H] -1.0) population, and therefore we could expect an enhancement of stars on the intermediate metallicity RGB by the RHB clump stars. In the , we compared normalized LFs of the metal-poor ([Fe/H] -1.5) RGB stars (dashed line) with that of the intermediate metallicity RGB ones (solid line). The LF of the metal-poor RGB is shifted horizontally in order to coincide its RGB bump with that of the intermediate metallicity RGB. An arrow indicates the predicted location of the RHB clump, from our models, which is younger ( 4 Gyr) than the MMP population. It is worthwhile to note that the peak of the intermediate metallicity RGB bump appears to be higher than that of the metal-poor one, indicating that the RHB clump stars might enhance the intermediate metallicity RGB bump feature due to their similar locations. A one-sided K-S test shows that the peak of the LF of the intermediate metallicity RGB is higher than that of the metal-poor one at the 99.5 % significance level. In the case of 2 Gyr from our HB models, we did not find a significant enhancement of the LF of the RGB. From this and similar analyses under different assumptions regarding , we conclude that a of 4 Gyrs is our best estimate for the age spread within Cen, in the sense that the MMR population is younger.
Our conclusion is in qualitative agreement with the results based on the Strömgren photometry of MS stars (Hughes & Wallerstein 2000; Hilker & Richtler 2000). Recently, from their preliminary results obtained from AAT 2dF observations for a sample redwards of the MS, Cannon et al. (2002) found that faint and red members of Cen, which must be the most metal-rich and young population in the vicinity of the SGB, do indeed exist. In Table 5, we summarize our final suggestions on the age-metallicity relation and characteristics of the four distinct populations in Cen
6 DISCUSSION
6.1 The Origin of Centauri
The recent discovery of multiple stellar populations and the internal age-metallicity relation of Cen found in our work and others (Lee et al. 1999; Pancino et al. 2000; Hilker & Richtler 2000; Hughes & Wallerstein 2000), resembling the characteristics of the Sagittarius dwarf galaxy, suggest that Cen was massive enough for the processes of self-enrichment and several bursts of star formation to proceed over several Gyr. These properties of Cen are also consistent with the characteristics of Local Group dwarf spheroidal galaxies, which are known to have complex star formation histories with extended timescales, and clearly distinct from the single age and metallicity characteristics of a typical GGC (Mateo 1998; van den Bergh 1999; Grebel 2001).
The relatively extended enrichment period of 4 Gyrs then indicates that the initial evolution of Cen occurred away from the dense central regions of the young Milky Way because at smaller galactocentric distances, such as the current location of Cen, we would expect the gaseous materials to have been stripped from the proto Cen on a much shorter timescale as a result of disk shocking or similar processes. This view is not inconsistent with the rather unusual kinematics and retrograde orbit of Cen which would allow the proto Cen to have a long orbital decay time (Dinescu, Girard, & van Altena 1999; Dinescu 2002; Mizutani, Chiba, & Sakamoto 2003). This scenario also is supported by the interesting result that the s-process elements are enriched over the whole [Fe/H] range (Norris & Da Costa 1995; Smith et al. 2000), which implies a sufficient time interval (order of 2 - 3 Gyr) to allow the formation of the low-mass (1 - 3 ) AGB stars from interstellar gas retained in the deep potential well.
From the apparently discrete nature of the RGB in the CMD as well as dynamical and structural pecularities between RGBs with different metallicities, it might be suggested that Cen could be a merger of two or several GCs (Norris et al. 1997; Smith et al. 2000; see also Catelan 1997). But mergers of clusters are very unlikely, if not impossible, in the Milky Way, considering the rather high velocities between the clusters in the halo. Furthermore, the broad metallicity distribution of the Cen RGB cannot be explained by simple merging of monometallic GCs (Pancino et al. 2002). We cannot rule out this scenario in dwarf galaxies however, because the internal velocity dispersion is much lower than in the Milky Way (van den Bergh 1996; Thurl & Johnston 2002; Fellhauer & Kroupa 2003).
On the other hand, the origin and evolution of the MMR population with [Fe/H] -0.5 may play a key role in the picture of the formation and evolution of Cen. Pancino et al. (2000) and Hilker & Richtler (2000) found that the spatial distribution of the MMR population is significantly different from that of the MMP one. Furthermore, Norris et al. (1997) earlier reported that the metal-rich stars do not show rotation, whereas the metal-poor ones do rotate. These studies suggest that the MMR population may have a different formation mechanism with respect to the bulk of the cluster popuation. Within the hypothesis that Cen is the relic of a larger galaxy and was disrupted by the Galactic tidal field, Ferraro et al. (2002) suggested that the MMR stars were part of a small independent stellar system that has been accreted by the proto larger Cen. They propose this idea as an example of hierarchical merging on the subgalactic scale.
Alternatively, the observational results of cold kinematics and central concentration for more metal-rich stars with respect to the metal-poor ones can lead to the speculation that the MMR stars were formed from the chemically enriched gas which has selectively low angular momentum and was moved to the center of the cluster (Norris et al. 1997; Freeman 2002). This may be possible from the barlike asymmetry in the inner region which occurred in the process of the interactions between Cen and the Milky Way (Norris et al. 1997; Mayer et al. 2001a, 2001b). Close to the pericentric passage, Cen could develop a central bar, allowing part of the gas to funnel into the center of Cen and generating one burst of star formation. Stars in this central region could more efficiently lose their angular momentum because of the bar instability (Mayer et al. 2001a, 2001b). Probably the past “tidally stirred” interaction between Cen and the Milky Way has disrupted the previously smooth and well-ordered distributions of the metal-poor populations in Cen and made it more efficient to trigger star formation of the MMR stars. If this is the case, the overall star formation of Cen must be an outside-in process. The initial star formation of the old MPP and MP populations occurred over the whole proto Cen far away from the young Milky Way, and susequent bursts of the young and more metal-rich populations were progressively more centrally concentrated, which may be dynamically connected to interactions with the Milky Way (Mayer et al. 2001a, 2001b; see also Strader et al. 2003 for the Fornax dwarf galaxy). If the MMR population was formed during the accretion to the Milky Way, the age of the MMR population may provide a hint of time taken for Cen to be accreted into the Galaxy.
While the detailed mechanism of star formation in Cen is not currently clear, all of above information strongly suggest that Cen is a relict or nucleus of a disrupted dwarf galaxy. The cases of Cen and the Sagittarius dwarf system therefore provide direct evidence for past and continuing accretion of protogalactic fragments, which suggest that similar accretion events may have continued throughout the history of Milky Way formation in the context of surviving “building blocks” of large galaxies (e.g., Searle & Zinn 1978; Larson 1988; Zinn 1993).
6.2 Other Globular Clusters with Metallicity Spread and Multiple Populations?
Finally, it is of interest to note that Cen and M54, now proposed as possible nuclei or parts of disrupted dwarf galaxies, are respectively the most massive GC and second most massive GC in our Galaxy. Thus it is interesting to examine other massive GCs for indications that they have similar histories, and of these NGC 6388 and NGC 6441 deserve detailed examination. They are the 3rd and 5th most massive GGCs, respectively, and they both have very peculiar bimodal HB distributions. In particular, they show color spreads among the RGB stars which appear to be larger than the effects expected from photometric errors and differential reddenings (Rich et al. 1997). Moreover, recent studies also have suggested a possible intrinsic spread in metallicity of these two clusters, although direct star by star metallicity determinations need to be made (Piotto et al. 1997; Pritzl et al. 2001; Sweigart 2002).
Our population models for these unusual clusters show that the adoption of two distinct populations within the systems and very mild internal age-metallicity relations between the two populations can reproduce the observed features on the HB and the RGB (Ree et al. 2002; Yoon, Ree, and Lee 2003). The age and metallicity spreads, required to reproduce their CMD morphologies, are only about 1.2 Gyr and 0.15 dex for both clusters. This conclusion is also supported by the fact that the mean period of RR Lyrae variables in these clusters are too long for their high metallicities ([Fe/H] -0.5 - -0.6, Pritzl et al. 2000), which is understood in the two populations scenario if the RR Lyraes are highly evolved stars from the older and metal-poor BHB population.
It is worth noting that the most recent observations of the GC G1 in M31, which is more than twice as massive as Cen, also shows intrinsic metallicity dispersion (Meylan et al. 2001), implying a deep potential well enables massive clusters to retain enriched gas. It is suggestive therefore that there are additional GCs in the Milky Way and M31 that are the relicts of disrupted dwarf galaxies, as probably are Cen and M54.
6.3 Classification of the Galactic Halo Globular Cluster System
Our conclusions on the origin of Cen and other massive GCs, when combined with other recent findings on the origin of the GGC system, suggests that the present day Galactic halo GCs can be subdivided into three different types:
(a) Clusters formed in a collapsing proto-Galaxy (e.g., Eggen, Lynden-Bell, & Sandage 1962). They are located mostly in the inner halo and are only genuine GGCs, in the classic sense.
(b) Clusters originally formed in satellite dwarf galaxies later accreted to the Milky Way. They include GCs (Ter7, Ter8, Arp2, & Pal12) belonging to the Sagittarius dwarf galaxy (Ibata, Irwin, & Gilmore 1994; Ibata et al. 1997; Bellazzini, Ferraro, & Ibata 2003 and references therein), and young outer halo clusters with retrograde motion (Zinn 1993; van den Bergh 1993). Most recently, Yoon & Lee (2002) also reported very compelling evidence that metal-poor ([Fe/H] -2.0) Oosterhoff II clusters have the positional and orbital characteristics fully consistent with the hypothesis that they originated from a satellite galaxy such as the Magellanic Clouds.
(c) Nuclei (or relicts) of disrupted dwarf galaxies. Cen and M54, the nucleus of the Sagittarius dwarf, are belonging to this type. Our population models suggest other massive GCs with bimodal HBs (e.g., NGC 6388 and NGC 6441) might also be included in this category.
7 CONCLUSIONS
In this paper, we present wide-field and high-precision photometry for Cen, which represents one of the most extensive photometric surveys yet obtained for this cluster. We draw the following conclusions:
1. From our and Strömgren photometry, we removed foreground field populations with 16.0 and [Fe/H] -0.6 dex in the CMD. The distinctly different distributions between Cen and the foreground field stars in the vs. diagram, which is correlated with metallicity, has allowed us to discriminate the foreground field stars from the member stars of Cen and then to construct decontaminated CMDs.
2. The “cleaned” CMDs of Cen show the presence of several RGBs. Notably, there exists a prominent feature of the MMR ([Fe/H] -0.5) RGB which is clearly separated and far redward from the main metal-poor RGBs. From the histograms of the RGB color distribution, we confirmed the existence of multiple stellar populations. The HB distribution is also consistent with the multimodal nature of the RGB. The evidence of discrete RGBs and corresponding HBs suggests that star formation in Cen occurred in successive bursts.
3. We identified, for the first time, a continuous and slanting RGB bump in the CMD of Cen, which is an unique feature among GGCs, and due to the metallicity difference between the stars. We found that multiple peaks of the RGB bump in the differential LF and the luminosities of these peaks depend on their metallicities, which is in good agreement with observational data among GGCs. All of these findings again allow us to confirm the existence of complex and multiple stellar populations with a wide spread in metallicity within Cen.
4. Our photometry has revealed a significant population of the BSSs in Cen. We found an intriguing group of stars, clearly separated from the main branch of the BSSs and lying above the cluster SGB, which may be stars evolved from the main BSS sequence. We also detected the BSS progeny candidates of Cen which are slightly brighter than the normal RHB stars and well separated from the AGB base. From the different shape of the observed BSS LFs for the inner and outer regions and comparison with the models, we found that there might be two different origins of the BSSs in Cen.
5. From our population models, we confirmed that four distinct populations with different metallicities can reproduce the observed multimodal nature of the RGB and the corresponding HB distributions. We determined the age-metallicity relation between the four distinct sub-populations in Cen by comparing the observed HB distribution with our population models. We suggest that the MMR ([Fe/H] -0.5) population is a few billion years younger ( 4 Gyr) than the MMP ([Fe/H] -1.8) population. A consistent picture of the evolved stars in Cen is given by the presence of (1) a metal-poor population of [Fe/H] -1.8 - -1.3 and age 12 Gyr with exclusively BHB and blue side of the RGB (MMP and MP sub-populations), (2) a metal-rich population of [Fe/H] -1.0 and age 11 Gyr with the RHB and red side of the RGB (MR sub-population), and (3) the most metal-rich population of [Fe/H] -0.5 and age 8 Gyr required to explain the distinctly separated RGB sequence and its RHB clump visible in the more metal-poor RGB bump region (MMR sub-population). From the discovery of several distinct populations and the internal age-metallicity relation found in our work and others (Lee et al. 1999; Pancino et al. 2000; Hilker & Richtler 2000; Hughes & Wallerstein 2000), we suggest Cen was once part of a more massive system that merged with the Milky Way, as the Sagittarius dwarf galaxy is in the process of doing now.
New observational data are required to confirm our conclusions presented above. In particular, detection of any RHB clump stars residing amongst more metal-poor RGB stars would be possible via a spectroscopic and/or spectrophotometric (e.g., Strömgren photometry) survey for stars around the RHB clump region in the CMD. From derived metallicity and gravity values, the RHB clump stars could be directly discriminated from the more metal-poor RGB stars. This would clarify the age-metallicity relation suggested by our models, which is based on the location of the RHB clump in the CMD.
References
- (1) Alcaino, G., & Liller, W. 1987, AJ, 94, 1585
- (2)
- (3) Alves, D. R., & Sarajedini, A. 1999, ApJ, 511, 225
- (4)
- (5) Anthony-Twarog, B. J., & Twarog, B. A. 1998, AJ, 116, 1922
- (6)
- (7) Anthony-Twarog, B. J., Laird, J. N., Payne, D., & Twarog, B. A. 1991, AJ, 101, 1902
- (8)
- (9) Anthony-Twarog, B. J., Sarajedini, A., Twarog, B. A., & Beers, T. C. 2000, AJ, 119, 2882
- (10)
- (11) Bailyn, C. D. 1995, ARA&A, 33, 133
- (12)
- (13) Bailyn, C. D., & Pinsonneault, M. H. 1995, ApJ, 439, 705 (BP95)
- (14)
- (15) Bailyn, C. D., Sarajedini, A., Cohn, H., Lugger, P., & Grindlay, J. E. 1992, AJ, 103, 1564
- (16)
- (17) Bellazzini, M., Ferraro, F. R., & Buonanno, R. 1999a, MNRAS, 304, 633
- (18)
- (19) Bellazzini, M., Ferraro, F. R., & Buonanno, R. 1999b, MNRAS, 307, 619
- (20)
- (21) Bellazzini M., Ferraro, F. R., & Ibata, R. A. 2003, AJ, 125, 188
- (22)
- (23) Brown, J. A., & Wallerstein, G. 1993, AJ, 106, 133
- (24)
- (25) Butler, D., Dickens, R. J., & Epps, E. A. 1978, ApJ, 225, 148
- (26)
- (27) Cannon, R. D., & Stobie, R. S. 1973, MNRAS, 162, 207
- (28)
- (29) Cannon, R. D., Da Costa, G., Norris, J., Stanford, L., & Croke, B. 2002, in ASP Conf. Ser. 296, New Horizons in Globular Cluster Astronmy, ed. G. Piotto, G. Meylan, G. Djorgovski, & M. Riello (San Francisco: ASP), 175
- (30)
- (31) Cassisi, S., & Salaris, M. 1997, MNRAS, 285, 593
- (32)
- (33) Castellani, V., Chieffi, A., & Pulone, L. 1991, ApJS, 76, 911
- (34)
- (35) Catelan, M. 1997, ApJ, 478, L99
- (36)
- (37) Chaboyer, B., Demarque, P., Kernan, P. J., & Krauss, L. M. 1998, ApJ, 494, 96
- (38)
- (39) Cunha, K., Smith, V, V., Suntzeff, N. B., Norris, J. E., Da Costa, G. S., & Plez, B. 2002, AJ, 124, 379
- (40)
- (41) Da Costa, G. S., Norris, J., & Villumsen, J. V. 1986, ApJ, 308, 743
- (42)
- (43) Dickens, R. J., & Woolley, R. v. d. R. 1967, R. Obs. Bull., 128, 255
- (44)
- (45) Dinescu, D. I. 2002, in ASP Conf. Ser. 265, Centauri: A Unique Window into Astrophysics, ed. F. van Leeuwen, J. D. Hughes, & Piotto, G (San Francisco: ASP), 365
- (46)
- (47) Dinescu, D. I., Girard, T. M., & van Altena, W. F. 1999, AJ, 117, 1792
- (48)
- (49) Eggen, O. J., Lynden-Bell, D., & Sandage, A. R. 1962, ApJ, 136, 748
- (50)
- (51) Fellhauer, M., & Kroupa, P. 2003, ApSS, 284, 643
- (52)
- (53) Ferraro, F. R., Bellazzini, M., & Pancino, E. 2002, ApJ, 573, L95
- (54)
- (55) Ferraro, F. R., Fusi Pecci, F., & Buonanno, R. 1992, MNRAS, 256, 376
- (56)
- (57) Ferraro, F. R., Clementini, G., Fusi Pecci, F., Sortino, R., & Buonanno, R. 1992, MNRAS, 256, 391
- (58)
- (59) Ferraro, F. R., Carretta, E., Corsi, C. E., Fusi Pecci, F., Cacciari, C., Buonanno, R., Paltrinieri, B., & Hamilton, D. 1997a, A&A, 320, 757
- (60)
- (61) Ferraro, F. R., Paltrinieri, B., Fusi Pecci, F., et al. 1997b, A&A, 324, 915
- (62)
- (63) Ferraro, F. R., Paltrinieri, B., Fusi Pecci, F., Cacciari, C., Dorman, B., & Rood, R. T. 1997c, ApJ, 484, L145
- (64)
- (65) Ferraro, F. R., Messineo, M., Fusi Pecci, F., de Palo, M. A., Straniero, O., Chieffi, A., & Limongi, M. 1999a, AJ, 118, 1738 (F99)
- (66)
- (67) Ferraro, F. R., Paltrinieri, B., Rood, R. T., & Dorman, B. 1999b, ApJ, 522, 983
- (68)
- (69) Freeman, K. C. 1985, in IAU Symp. 113, Dynamics of Star Clusters, ed. J. Goodman and P. Hut (Dordrecht: Reidel), 33
- (70)
- (71) Freeman, K. C. 1993, in ASP Conf. Ser. 48, The Globular Cluster-Galaxy Connection, ed. G. H. Smith and J. P. Brodie (San Francisco: ASP), 27
- (72)
- (73) Freeman, K. C. 2002, in ASP Conf. Ser. 265, Centauri: A Unique Window into Astrophysics, ed. F. van Leeuwen, J. D. Hughes, & G. Piotto (San Francisco: ASP), 423
- (74)
- (75) Freeman, K. C., & Rodgers, A. W. 1975, ApJ, 201, L71
- (76)
- (77) Frinchaboy, P. M., et al. 2002, in ASP Conf. Ser. 265, Centauri: A Unique Window into Astrophysics, ed. F. van Leeuwen, J. D. Hughes, & G. Piotto (San Francisco: ASP), 143
- (78)
- (79) Fullton, L. K., Carney, B. W., Olszewski, E. W., Zinn, R., Demarque, P., Janes, K. A., Da Costa, G. S., & Seitzer, P. 1995, AJ, 110, 652
- (80)
- (81) Fusi Pecci, F., Ferraro, F. R., Crocker, D. A., Rood, R. T., & Buonanno, R. 1990, A&A, 238, 95
- (82)
- (83) Fusi Pecci, F., Ferraro, F. R., Corsi, C. E., Cacciari, C., & Buonanno, R. 1992, AJ, 104, 1831
- (84)
- (85) Gratton, R. G., Tornambe, A., & Ortolani, S. 1986, A&A, 169, 111
- (86)
- (87) Gratton, R. G., Fusi Pecci, F., Carretta, E., Clementini, G., Corsi, C. E., & Lattanzi, M. 1997, ApJ, 491, 749
- (88)
- (89) Grebel, E. K. 2001, in ASP Conf. Ser. 239, Microlensing 2000: A New Era of Microlensing Astrophysics, ed. J. W. Menzies & Penny D. Sackett (San Francisco: ASP), 280
- (90)
- (91) Grundahl, F., VandenBerg, D. A., & Andersen, M. I. 1998, ApJ, 500, L179
- (92)
- (93) Harbeck, H., Grebel, E. K., Holtzman, J., et al. 2001, AJ, 122, 3092
- (94)
- (95) Harris, W. E. 1996, AJ, 112, 1478
- (96)
- (97) Hesser, J. E., McClure, R. D., Hawarden, T. G., Cannon, R. D., von Rudloff, R., Kruger, B., & Egles, D. 1984, PASP, 96, 406
- (98)
- (99) Hilker, M., & Richtler, T. 2000, A&A, 362, 895
- (100)
- (101) Hughes, J., & Wallerstein, G. 2000, AJ, 119, 1225
- (102)
- (103) Ibata, R. A., Irwin, M. J., & Gilmore, G. 1994, Nature, 370, 194
- (104)
- (105) Ibata, R. A., Wyse, R. F. G., Gilmore, G., Irwin, M. J., & Suntzeff, N. B. 1997, AJ, 113, 634
- (106)
- (107) Iben, I. 1968, Nature, 220, 143
- (108)
- (109) Ikuta, C., & Arimoto, N. 2000, A&A, 358, 535
- (110)
- (111) Jonch-Sorensen, H., & Knude, J. 1994, A&A, 288, 139
- (112)
- (113) Jurcsik, J. 1998, ApJ, 506, L113
- (114)
- (115) Kaluzny, J., Kubiak, M., Szymanski, M., Udalski, A., Krzeminski, W., & Mateo, M. 1996, A&AS, 120, 139
- (116)
- (117) Kaluzny, J., Kubiak, M., Szymanski, M., Udalski, A., Krzeminski, W., Mateo, M., & Stanek, K. 1997, A&AS, 122, 471
- (118)
- (119) Kraft, R. P. 1994, PASP, 106, 553
- (120)
- (121) Landolt, A. V. 1992, AJ, 104, 340
- (122)
- (123) Landsman, W., Aparicio, J., Bergeron, P., Di Stefano, R., & Stecher, T. P. 1997, ApJ, 481, L93
- (124)
- (125) Larson, R. B. 1988, in IAU Symp. 126, Globular Cluster Systems in Galaxies, ed. G. Grindlay & A. Philip (Dordrecht: Kluwer), 311
- (126)
- (127) Layden, A. C., & Sarajedini, A. 1997, ApJ, 486, L107
- (128)
- (129) Layden, A. C., & Sarajedini, A. 2000, AJ, 119, 1760
- (130)
- (131) Lee, Y.-W. 1992, AJ, 104, 1780
- (132)
- (133) Lee, Y.-W. & Demarque, P. 1990, ApJS, 73, 709
- (134)
- (135) Lee, Y.-W., Demarque, P., & Zinn, R. J. 1987, in IAU Colloq. 95, Second Conference on Faint Blue Stars, ed. A. G. D. Philip & J. Liebert (Schenectady: L. Davis), 137
- (136)
- (137) Lee, Y.-W., Demarque, P., & Zinn, R. J. 1990, ApJ, 350, 155
- (138)
- (139) Lee, Y.-W., Demarque, P., & Zinn, R. J. 1994, ApJ, 423, 248
- (140)
- (141) Lee, Y.-W., Joo, J.-M., Sohn, Y.-J., Rey, S.-C., Lee, H.-c., & Walker, A. R. 1999, Nature, 402, 55
- (142)
- (143) Majewski, S. R., Patterson, R., Dinescu, D., Johnson, W., Ostheimer, J., Kunkel, W., & Palma, C. 2000, in The Galactic Halo: From Globular Clusters to Field Stars, ed. A. Noels, et al. (Liège: Univ. Liège), 619
- (144)
- (145) Mandushev, G. I., Fahlman, G. G., Richer, H. B., & Thompson, I. B. 1997, AJ, 114, 1060
- (146)
- (147) Mateo, M. 1998, ARA&A, 1998, 36, 435
- (148)
- (149) Mayer, L., Governato, F., Colpi, M., Moore, B., Quinn, T., Wadsley, J., Stadel, J., & Lake, G. 2001a, ApJ, 547, L123
- (150)
- (151) Mayer, L., Governato, F., Colpi, M., Moore, B., Quinn, T., Wadsley, J., Stadel, J., & Lake, G. 2001b, ApJ, 559, 754
- (152)
- (153) Mayor, M., et al. 1997, AJ, 114, 1087
- (154)
- (155) Merrit, D., Meylan, G., & Mayor, M. 1997, AJ, 114, 1074
- (156)
- (157) Meylan, G. 1987, A&A, 184, 144
- (158)
- (159) Meylan, G., & Mayor, M. 1986, A&A, 166, 122
- (160)
- (161) Meylan, G., Mayor, M., Duquennoy, A., & Dubath, P. 1995, A&A, 303, 761
- (162)
- (163) Meylan, G., Sarajedini, A., Jablonka, P., Djorgovski, S. G., Bridges, T., & Rich, R. M. 2001, AJ, 122, 830
- (164)
- (165) Mizutani, A., Chiba, M., & Sakamoto, T. 2003, ApJ, 589, L89
- (166)
- (167) Ng, Y. K., Bertelli, G., Bressan, A., Chiosi, C., & Lub, J. 1995, A&A, 295, 655
- (168)
- (169) Norris, J. E., & Da Costa, G. S. 1995, ApJ, 447, 680
- (170)
- (171) Norris, J. E., Freeman, K. C., & Mighell, K. J. 1996, ApJ, 462, 241
- (172)
- (173) Norris, J. E., Freeman, K. C., Mayor, M., & Seitzer, P. 1997, ApJ, 487, L187
- (174)
- (175) Origlia, L., Ferraro, F.R., Bellazzini, M., & Pancino, E. 2003, ApJ, 591, 916
- (176)
- (177) Pancino, E., Ferraro, F. R., Bellazzini, M., Piotto, G., & Zoccali, M. 2000, ApJ, 534, L83
- (178)
- (179) Pancino, E., Pasquini, L., Hill, V., Ferraro, F. R., & Bellazzini, M. 2002, ApJ, 568, L101
- (180)
- (181) Pancino, E., Seleznev, A., Ferraro, F. R., Bellazzini, M., & Piotto, G. 2003, preprint (astro-ph/0305524)
- (182)
- (183) Park, J.-H., & Lee, Y.-W. 1997, ApJ, 476, 28
- (184)
- (185) Piotto, G., Sosin, C., King, I. R., et al. 1997, in Advances in Stellar Evolution, ed. R. T. Rood, & A. Renzini (Cambridge: Cambridge Univ. Press), 84
- (186)
- (187) Piotto, G., Zoccali, M., King, I. R., Djorgovski, S. G., Sosin, C., Dorman, B., Rich, R. M., & Meylan, G. 1999, AJ, 117, 264
- (188)
- (189) Platais, I., Wyse, R. F. G., Hebb, L., Lee, Y.-W., & Rey, S.-C. 2003, ApJ, 591, 127
- (190)
- (191) Pritzl, B., Smith, H. A., Catelan, M., & Sweigart, A. V. 2000, ApJ, 530, L41
- (192)
- (193) Pritzl, B., Smith, H. A., Catelan, M., & Sweigart, A. V. 2001, AJ, 122, 2600
- (194)
- (195) Ree, C. H., Yoon, S.-J., Rey, S.-C., & Lee, Y.-W. 2002, in ASP Conf. Ser. 265, Centauri: A Unique Window into Astrophysics, ed. F. van Leeuwen, J. D. Hughes, & G. Piotto (San Francisco: ASP), 101
- (196)
- (197) Reid, I. N. 1998, AJ, 115, 204
- (198)
- (199) Reimers, D. 1975, Mem. Soc. R. Sci. Liège, 8, 369
- (200)
- (201) Renzini, A., & Fusi Pecci, F. 1988, ARA&A, 26, 199
- (202)
- (203) Rey, S.-C., Lee, Y.-W., Byun, Y.-I., & Chun, M.-S. 1998, AJ, 116, 1775
- (204)
- (205) Rey, S.-C., Lee, Y.-W., Joo, J.-M., Walker, A. R., & Baird, S. 2000, AJ, 119, 1824
- (206)
- (207) Rey, S.-C, Yoon, S.-J. Lee, Y.-W., Chaboyer, B., & Sarajedini, A. 2001, AJ, 122, 3219
- (208)
- (209) Rich, R. M., et al. 1997, ApJ, 484, L25
- (210)
- (211) Salaris, M., Chieffi, A., & Straniero, O. 1993, ApJ, 414, 580
- (212)
- (213) Sandquist, E. L., Bolte, M., & Hernquist, L. 1997, ApJ, 477, 335
- (214)
- (215) Sarajedini, A. 1993, in ASP Conf. Ser. 53, Blue Stragglers, ed. R. Saffer and M. Livio (San Francisco: ASP), 14
- (216)
- (217) Sarajedini, A., & Da Costa, G. S. 1991, AJ, 102, 628
- (218)
- (219) Sarajedini, A., & Layden, A. C. 1995, AJ, 109, 1086
- (220)
- (221) Searle, L., & Zinn, R. 1978, ApJ, 225, 357
- (222)
- (223) Smith, V. V., Cunha, K., & Lambert, D. L. 1995, AJ, 110, 2827
- (224)
- (225) Smith, V. V., Suntzeff, N. B., Cunha, K., Gallino, R., Busso, M., Lambert, D. L., & Straniero, O. 2000, AJ, 119, 1239
- (226)
- (227) Stetson, P. B. 1987, PASP, 99, 191
- (228)
- (229) Stetson, P. B. 1992, in IAU Colloq. 136, Stellar Photometry-Current Techniques and Future Developments, ed. C. J. Butler and I. Elliot (Cambridge: Cambridge Univ. Press), 291
- (230)
- (231) Stetson, P. B. 1995, DAOPHOT II User’s Manual, Dominian Astrophysical Observatory
- (232)
- (233) Strader, J., Brodie, J. P., Forbes, D. A., Beasley, A., & Huchra, J. P. 2003, AJ, 125, 1291
- (234)
- (235) Stryker, L. L. 1993, PASP, 105, 1081
- (236)
- (237) Suntzeff, N. B. 1993, in ASP Conf. Ser. 48, The Globular Cluater-Galaxy Connection, ed. G. H. Smith and J. P. Brodie (San Francisco: ASP), 167
- (238)
- (239) Suntzeff, N. B., & Kraft, R. P. 1996, AJ, 111, 1913 (SK96)
- (240)
- (241) Sweigart, A. V. 2002, Highlights of Astronomy, 12, 292
- (242)
- (243) Thomas, H. 1967, Z. Astrophys, 67, 420
- (244)
- (245) Thurl, C., & Johnston, K. V. 2002, in ASP Conf. Ser. 265, Centauri: A Unique Window into Astrophysics, ed. F. van Leeuwen, J. D. Hughes, & G. Piotto (San Francisco: ASP), 337
- (246)
- (247) Twarog, B. A., & Anthony-Twarog, B. J. 1995, AJ, 109, 2828
- (248)
- (249) van den Bergh, S. 1993, AJ, 105, 971
- (250)
- (251) van den Bergh, S. 1996, ApJ, 471, L31
- (252)
- (253) van den Bergh, S. 1999, A&A Rev., 9, 273
- (254)
- (255) Vanture, A. D., Wallerstein, G., & Brown, J. A. 1994, PASP, 106, 835
- (256)
- (257) Walker, A. R. 1994, PASP, 106, 828
- (258)
- (259) White, R. E., & Shawl, S. J. 1987, ApJ, 317, 246
- (260)
- (261) Woolley, R. v. d. R. 1966, R. Obs. Ann., No. 2
- (262)
- (263) Wyse, R. F. G., & Gilmore, G. 1995, AJ, 110, 2771
- (264)
- (265) Yi, S., Demarque, P., & Kim, Y.-C. 1997, ApJ, 482, 677
- (266)
- (267) Yi, S., Demarque, P., Kim, Y.-C., Lee, Y.-W., Ree, C. H., Lejeune, T., & Barnes, S. 2001, ApJS, 136, 417
- (268)
- (269) Yoon, S.-J., & Lee, Y.-W. 2002, Science, 297, 578
- (270)
- (271) Yoon, S.-J., Ree, C. H, & Lee, Y.-W. 2003, submitted
- (272)
- (273) Zinn, R. 1993, in ASP Conf. Ser. 48, The Globular Cluster-Galaxy Connection, ed. G. Smith & J. Brodie (San Francisco: ASP), 38
- (274)
- (275) Zinn, R., & West, M. J. 1984, ApJS, 55, 45
- (276)
- (277) Zoccali, M., Cassisi, S., Piotto, G., Bono, G., & Salaris, M. 1999, ApJ, 518, L49
- (278)


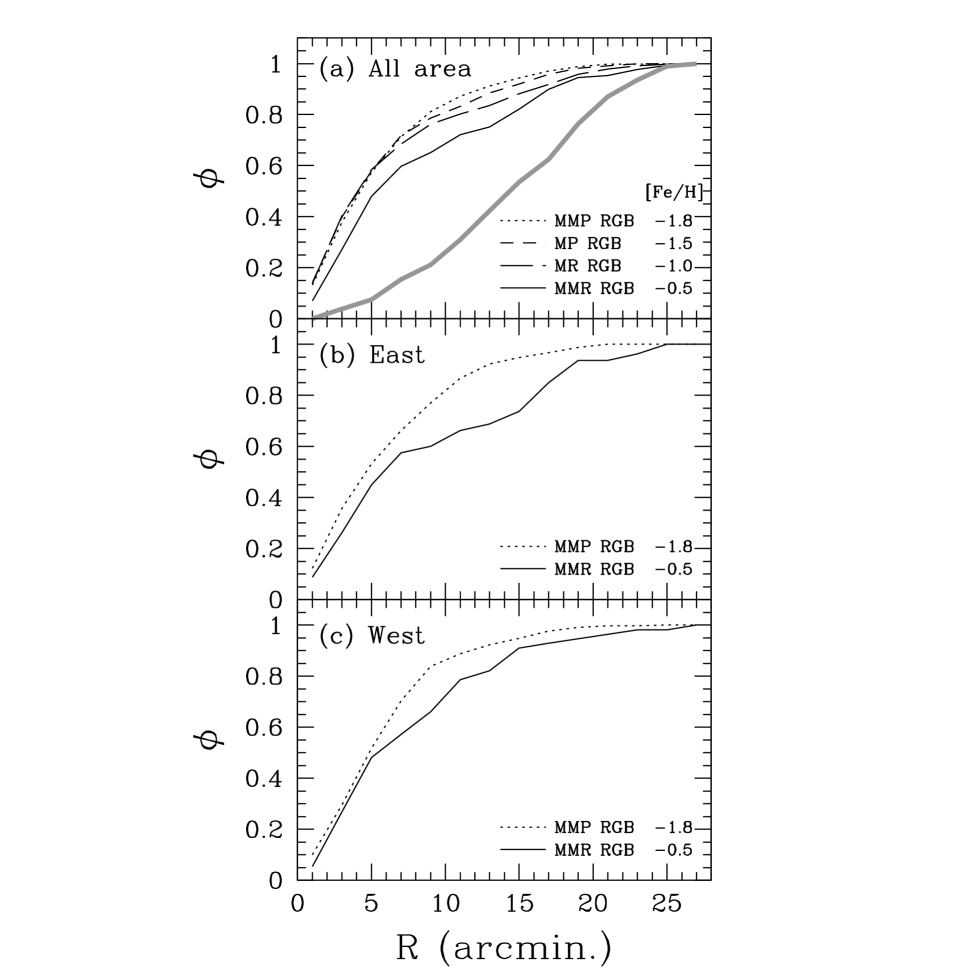

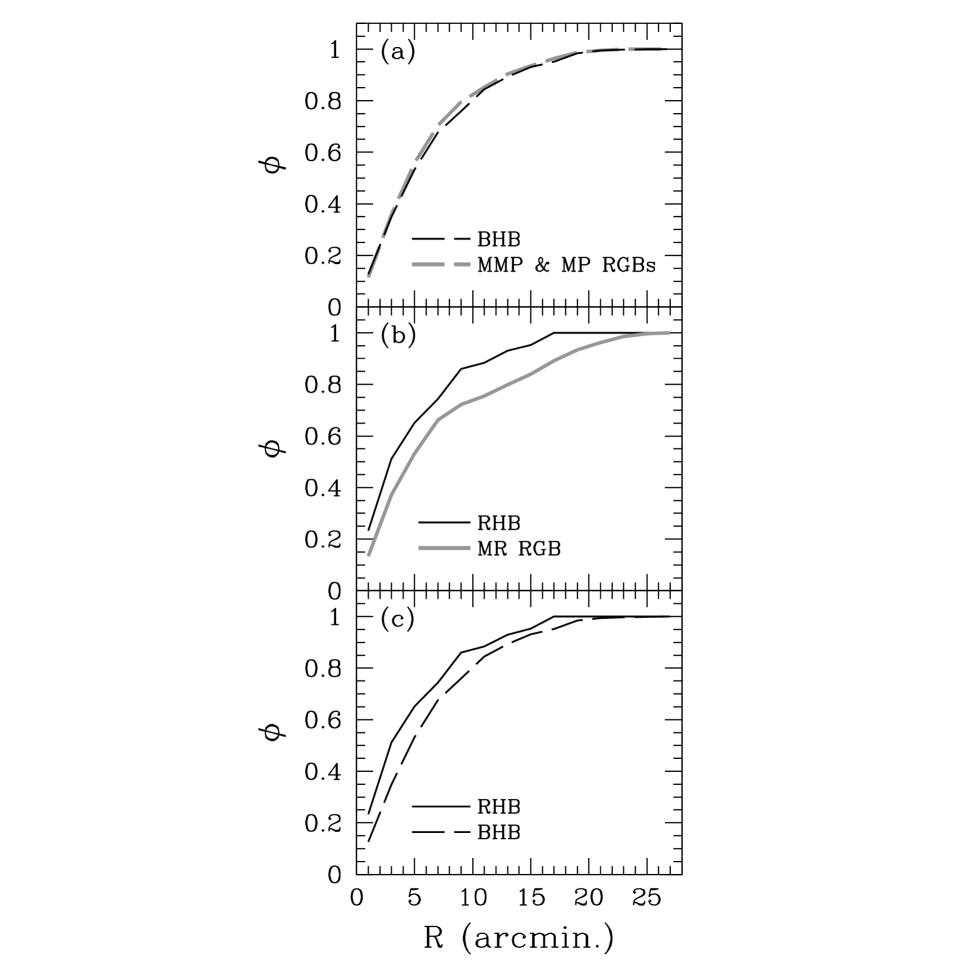


| Field | RA (2000) | DEC (2000) | Comment |
|---|---|---|---|
| F1 | 13:28:04.60 | -47:41:32.10 | SE |
| F2 | 13:28:04.90 | -47:28:30.30 | E |
| F3 | 13:28:05.20 | -47:15:30.20 | NE |
| F4 | 13:26:48.60 | -47:15:30.20 | N |
| F5 | 13:26:47.90 | -47:28:38.70 | Cluster center |
| F6 | 13:26:48.10 | -47:41:33.70 | S |
| F7 | 13:25:31.00 | -47:41:35.60 | SW |
| F8 | 13:25:30.50 | -47:28:32.90 | W |
| F9 | 13:25:30.00 | -47:15:35.30 | NW |
| ID | ||||||
|---|---|---|---|---|---|---|
| 1 | 3702.16 | 1874.11 | 9.846 | 0.009 | 1.034 | 0.010 |
| 2 | 4769.50 | 497.98 | 10.009 | 0.006 | 1.286 | 0.007 |
| 3 | 1754.23 | 1229.86 | 10.041 | 0.010 | 1.348 | 0.010 |
| 4 | 4671.58 | -63.43 | 10.050 | 0.004 | 1.141 | 0.004 |
| 5 | 136.88 | 409.37 | 10.288 | 0.005 | 1.683 | 0.005 |
| ID | ||||||
|---|---|---|---|---|---|---|
| 1 | 1041.68 | -1702.05 | 9.458 | 0.008 | 0.460 | 0.013 |
| 2 | 4973.86 | -1018.14 | 10.406 | 0.008 | 0.295 | 0.009 |
| 3 | 2198.69 | 319.31 | 10.499 | 0.004 | 0.573 | 0.005 |
| 4 | 1825.23 | -3152.36 | 10.514 | 0.008 | 0.478 | 0.008 |
| 5 | 270.93 | 1119.84 | 10.770 | 0.003 | 0.531 | 0.004 |
| RGB bump | [Fe/H]ZW | ||
|---|---|---|---|
| 1 | 14.28 0.05 | -0.44 0.11 | -1.92 0.14 |
| 2 | 14.35 0.05 | -0.36 0.11 | -1.74 0.11 |
| 3 | 14.50 0.05 | -0.20 0.11 | -1.56 0.14 |
| 4 | 14.55 0.05 | -0.15 0.11 | -1.37 0.13 |
| 5 | 14.73 0.05 | 0.02 0.11 | -1.19 0.13 |
| 6 | 14.93 0.05 | 0.21 0.11 | -0.94 0.21 |
| 7 | 15.45 0.05 | 0.55 0.09 | -0.51 0.29 |
| Population | [Fe/H] | Z | Age (Gyr) | RR Lyraes | Remark | |
|---|---|---|---|---|---|---|
| 1 | MMP RGB and BHB | -1.8 | 0.0006 | 12 | many | age from isochrones |
| 2 | MP RGB and BHB | -1.5 | 0.001 | 12 | many | from HB models |
| 3 | MR RGB and RHB | -1.0 | 0.002 | 10.8 | few | from HB models |
| 4 | MMR RGB and RHB clump | -0.5 | 0.006 | 8 | none | from HB models and RGB LF |