The VLA Galactic Plane Survey (VGPS)
Abstract
The VLA Galactic Plane Survey (VGPS) consists of measurements of the 21cm HI line and 1420 MHz continuum at angular resolution over much of the first quadrant of Galactic longitude within a few degrees of the Galactic plane. In combination with similar surveys of the fourth longitude quadrant and the outer Galaxy made with other instruments, the VGPS will provide comprehensive data on the interstellar medium in most of the regions of active star formation in the Galaxy. This paper describes the parameters of the VGPS, reports on its status, and discusses some early scientific results from the survey.
National Radio Astronomy Observatory, Green Bank, WV
Department of Physics and Astronomy, University of Calgary
1. Introduction
Following the success of the Canadian Galactic Plane Survey (CGPS) of the northern Milky Way (Taylor et al 2003), work was begun on two additional surveys: the Southern Galactic Plane Survey of the fourth longitude quadrant made with the Australia Telescope Compact Array (McClure-Griffiths 2002), and the VLA survey of the first quadrant of Galactic longitude (Taylor et al 2002). The goal of all these surveys is to provide a comprehensive, uniform data set in the 21cm HI line and 1420 MHz continuum at an angular resolution of covering the sky within a few degrees of the Galactic plane. With such a data set it would be possible to make synoptic studies of the interstellar medium throughout the Galaxy. Initial results from the surveys show that the combination of high angular resolution and large area coverage reveals interstellar structures which were not known previously (e.g., Normandeau, Taylor, & Dewdney 1996; Gray et al 1998; Knee & Brunt 2001; McClure-Griffiths et al 2000, 2002). As the portion of the Galaxy covered by the VLA observations contains important regions of star formation and many molecular clouds, it is expected that this will be a particularly rich data set.
2. Description of the VGPS

The area covered by the VLA Galactic Plane Survey (VGPS) is shown in Figure 1. Over this part of the sky the VLA in D-configuration was used to observe 990 positions on a grid spacing of . The pointing positions lie within Galactic latitudes at the lower longitudes and at the higher longitudes. An important feature of the surveys is the addition of zero-spacing data to provide the information on large angular scale emission which is missed by the interferometer. Zero-spacing data for the 1400 MHz continuum were obtained from observations with the Effelsberg 100-meter telescope (Reich & Reich 1986; Reich, Reich & Fürst 1990), while zero-spacing data for the 21cm HI line were supplied from a brief survey of the entire area made with the new 100-meter Robert C. Byrd Green Bank Telescope (GBT).
At the VLA, HI spectra were taken over 256 channels separated by 1.28 km s-1, centered on a velocity which varied with longitude to track Galactic rotation. The spectra from the two senses of circular polarization were offset by about 64 km s-1 and one-half channel from each other to provide coverage of velocities beyond that expected for Galactic HI. This produced an ample number of channels on either end of each spectrum which did not contain HI emission and could therefore be used to determine the continuum level. The result is coverage at full sensitivity of about 240 km s-1 of the 21cm spectrum.
2.1. Observations
At the VLA each field was observed in several 3 minute snapshots at different hour angles to vary the UV coverage. The field centers were separated by , which is 80% of the primary VLA beam FWHM. The GBT data have angular resolution and were taken in a quick raster scan across the Galactic plane. Standard gain and phase calibration was performed for the VLA data, but the flux scale for these data is calibrated with respect to fluxes within each pointing of sources observed in the NVSS (Condon et al 1998). In the final data processing the GBT flux scale is forced into agreement with that of the VLA, on average, for baselines which overlap in the two data sets.
| Longitude | |
|---|---|
| Latitude | |
| Angular Resolution | |
| Vel. Coverage | 240 km s-1 |
| Vel. Resolution | 1.5 km s-1 |
| Noise (Continuum) () | 2 mJy per beam |
| Noise (HI) () | 2.0 K |
2.2. Image Processing
Continuum subtraction was done in the UV plane by fitting a linear function to the visibilities in line-free channels. Strong, compact continuum sources were cleaned by using data only from projected baselines longer than . These absorbed sources were subtracted from the HI images and restored with a Gaussian beam before deconvolution of the line emission. This procedure eliminates the sidelobes around absorbed continuum sources, in particular, the radial spokes which occur on the 20% level in the dirty beam of VLA snapshots. The HI line emission was then deconvolved with an maximum entropy algorithm (Cornwell & Evans 1985). The deconvolved model of clean components was restored with a circular Gaussian beam which is uniform over the VGPS survey area.
Figure 2 gives an example of the quality of the survey data and also illustrates the importance of the single-dish, low spatial-frequency data in deriving complete information on Galactic HI. Although the left section of the figure, which contains VLA data alone, shows considerable detail which is invisible in the lower-resolution GBT data (right segment), it is only with combination of the two that both the detail and the correct overall amplitude of the HI is recovered. The central section of Figure 2 is representative of the quality expected in one velocity channel of the final, fully-processed HI data.
2.3. The Final Data Products
The final VGPS data product will consist of continuum images and HI 21-cm spectral line cubes with velocity channels spaced by 0.82 (to match the velocity channels of the CGPS), angular resolution of , and r.m.s. sensitivity of 2 K per velocity channel (). At the time of this writing all the data have been edited and the final calibration of the individual VLA pointings is in progress. Completed cubes should be available for portions of the VGPS area by the end of 2003 and the complete data set will be distributed in mid-2004. The VGPS parameters are summarized in Table 1.
3. Some Early Results

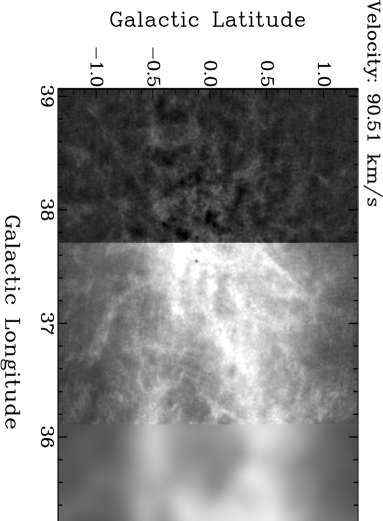
The survey data have already revealed several interesting HI features. One is a well-defined, expanding HI shell with in neutral gas found lying about 100 pc below the Galactic plane (Stil et al 2003). Another is the remarkable cloud shown in Figure 3.
This HI cloud, at km s-1 has a velocity about 50 km s-1 greater than permitted by Galactic rotation in this direction, so one might initially suspect that it is some sort of compact high-velocity HI cloud not associated with the Galactic disk. However, recent studies of HI above the Galactic plane using the GBT have shown that there is a population of HI clouds similar to this one, with velocities determined mainly by circular Galactic rotation, but with a large cloud-cloud velocity dispersion of several tens of km s-1 (Lockman 2002). These “halo” HI clouds can be traced down to fairly low latitude before they blend with other HI emission and are lost to view. It is likely that G25.48+0.16 is a member of this group. Because of its very high random velocity it can be distinguished from confusing HI even near the plane. Similar clouds, though with a smaller random component of velocity, are seen elsewhere in the GBT data at low latitudes. The association with the halo clouds implies that G25.48+0.16 most likely lies near the tangent point at a distance of 7.7 kpc, otherwise its random velocity would be even more extreme than it already is.
The cloud’s physical properties (diameter pc, cm-2, cm-3), are not exceptional, and in fact are quite a good match to the McKee & Ostriker (1977) model for a cold cloud (see their Table 1). But the 50 km s-1 random velocity of the cloud is perplexing, for if the cloud is located in a medium of cm-3, it will sweep up its mass in only 106 years and thus be decelerated rapidly. Most of the halo HI clouds are sufficiently far from the plane that their lifetime is not a major problem, but how can this cloud exist at all, unless it is traveling through a region of very low density? This cloud may be one of a population of “shocked interstellar clouds” proposed by Radhakrishnan & Srinivasan (1980; see also Kulkarni & Fich 1985) to explain the extensive wings of HI profiles at low latitude.
These tantalizing results from a crude perusal of partially-reduced data give a taste of what is to come. When the VGPS is available in its final form we expect that it will have a major impact on Galactic studies.
Acknowledgments.
We thank J. M. Dickey, Y. Pidoprihora and A.R. Taylor for helpful comments. The National Radio Astronomy Observatory is operated by Associated Universities, Inc., under a cooperative agreement with the National Science Foundation.
References
Condon, J. J., Cotton, W. D., Greisen, E. W., Yin, Q. F., Perley, R. A., Taylor, G. B., & Broderick, J. J. 1998, AJ, 115, 1693
Cornwell, T. J., & Evans, K. F., 1985, A&A 143, 77
Gray, A. D., Landecker, T.L., Dewdney, P.E., & Taylor, A.R. 1998, Nature, 393, 660
Knee, L.B.G. & Brunt, C.M. 2001, Nature, 412, 308
Kulkarni, S.R., & Fich, M. 1985, ApJ, 289, 792
Lockman, F.J. 2002, ApJ, 580, L47
McClure-Griffiths, N.M. 2002, in “Seeing Through the Dust”, ASP Conf. Ser. Vol. 276, ed. A.R. Taylor, T.L. Landecker, & A.G. Willis, p. 58
McClure-Griffiths, N.M., Dickey, J.M., Gaensler, B.M., Green, A.J., Haynes, R.F., & Wieringa, M.H. 2000, AJ, 119, 2828
McClure-Griffiths, N.M., Dickey, J.M., Gaensler, B.M., & Greene, A.J. 2002, ApJ, 578, 176
McKee, C.F., & Ostriker, J.P. 1977, ApJ, 218, 148
Normandeau, M., Taylor, A.R., & Dewdney, P.E. 1996, Nature, 380, 687
Radhakrishnan, V., & Srinivasan, G. 1980, J. Astr. Ap., 1, 47
Reich, P., & Reich, W., 1986, A&AS, 63, 205
Reich, W., Reich, P., & Fürst 1990, A&AS, 83, 539
Stil, J.M., Taylor, A.R., Martin, P.G., Rothwell, T., Dickey, J.M., & McClure-Griffiths, N.M. 2003, in press
Taylor A.R. et al 2002, in “Seeing Through the Dust”, ASP Conf. Ser. Vol. 276, ed. A.R. Taylor, T.L. Landecker, & A.G. Willis, p. 68
Taylor, A.R. et al 2003, AJ, 125, 3145