X-Ray Sources Overdensity Around the 3C 295 Galaxy Cluster
Abstract
We present a statistical analysis of the Chandra observation of the source field around the 3C 295 galaxy cluster (). The logN-logS of this field is in good agreement with that computed for the Chandra Deep Field South in this work and in previous ones. Nevertheless, the logN-logS computed separately for the four ACIS-I chips reveals that there is a significant excess of sources to the North-North East and a void to the South of the central cluster. Such an asymmetric distribution is confirmed by the two-dimensional Kolmogorov-Smirnov test, which excludes () a uniform distribution. In addition, a strong spatial correlation emerges from the study of the angular correlation function of the field: the angular correlation function is above that expected for X-ray sources on a few arcmin scales. In synthesis, the present analysis may indicate a filament of the large scale structure of the Universe toward 3C 295. This kind of studies may open-up a new way to map (with high efficiency) high-density peaks of large scale structures at high-z.
1 Introduction
N-body and hydrodynamical simulations show that high redshift clusters of galaxies lie at the nexus of several filaments of galaxies (see e.g. Peacock 1999). Such filaments map out the “cosmic web” of voids and filaments of the large scale structure of the Universe. Thus, rich clusters represent good indicators of regions of sky where several filaments converge. The filaments themselves could be mapped out by Active Galactic Nuclei (AGNs), assuming that AGNs trace galaxies.
Cappi et al. (2001) studied the distribution of the X-ray sources around 3C 295 (). The clusters was observed with the ACIS-S CCD array for a short exposure time ( ks). They found a high source surface density in the 0.5-2 keV band which exceeds the ROSAT (Hasinger et al. 1998) and Chandra (Giacconi et al. 2002) logN-logS by a factor of , with a significance of .
In this work an analysis of a deeper ( ks) Chandra observation of 3C 295 is performed, to check whether the overdensity of such a field in the keV band is real or not, to define the structure of the overdensity, and to extend the above considerations to the keV band.


2 Observation and Data reduction
Chandra observed the field around the 3C 295 cluster with ACIS-I on May 18, 2001, for ks.
The data reduction was carried out using the Chandra Interactive Analysis of Observations software version 2.1.3.
All the data analysis has been performed separately in the keV, in the keV and in the keV bands.
An identical analysis was performed for the Chandra Deep Field South (CDFS) in the keV and keV bands for comparison, and to check our analysis methods.
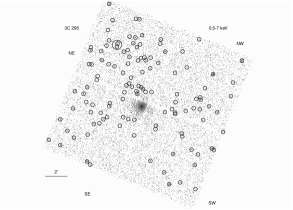
The source detection was carried out using the ‘PWDetect’ algorithm (Damiani et al. 1997). We identified sources in the keV band, sources in the keV band and sources in the keV band (see fig. 1).
The counts in the keV, keV and keV bands were converted in keV, keV and keV fluxes using conversion factors appropriate for a power law spectrum with a galactic absorption toward the 3C 295 field of cm-2. Such values take into account the quantum efficiency degradation of the CCD.
3 Analysis
The following analysis has been perfomed:
The sky coverage has been computed for 3C 295 and CDFS fields.
The LogN-LogS in the soft and hard bands for the whole filelds have been produced (figs. 2 and 3).
The LogN-LogS in the soft, hard and whole bands have been produced separately for each ACIS-I chip of the 3C 295 observation (see fig. 4 for the keV band).
3C 295 chip-to-chip and CDFS LogN-LogS have been fitted to evaluate slopes and normalizations (fig. 5 for the keV band).
A two dimensional Kolmogorov-Smirnov test has been applied to check whether the sources were uniformly distributed or not (tab. 1).
The angular correlation function has been computed in order to estimate at which scales the sources in the two fields were clustered; the errors associated to the function (fig. 6) have been calculated using both poisson and bootstrap statistics (Barrow, Bhavsar & Sonoda 1984).


4 Main results
The following results have been achieved:
3C 295 and CDFS LogN-LogS are in very good agreement both in the soft and hard band, and with the CDFS LogN-LogS by Rosati et al. 2002 (figs. 2 and 3).
The 3C 295 LogN-LogS in the soft, hard and broad bands computed separately for each ACIS-I chip show an overdensity of sources in the North-East (NE) chip (fig. 4 for the keV band) which reflects the clustering of sources clearly visible in fig. 1.
The discrepancy between the normalization of the LogN-LogS for the NE and SW chip is , and in the soft, hard and broad band, respectively; fig. 5 shows the normalization vs. slope plot for the broad band.
The two dimensional Kolmogorov-Smirnov test shows that there is a considerable probability that CDFS sources are uniformly distributed ( in the soft and hard bands), while the probability that the 3C 295 sources are uniformly distributed is only a few per cent, and drops below 1 if we consider the keV band (tab. 1).
The angular correlation function of the 3C 295 sources features a strong signal on scales of a few arcmins, and also on lower scales in the keV band (fig. 6). Moreover, the function is above the value found by Vikhlinin & Forman (1995) for a large sample of ROSAT sources. On the other hand, no signs of a similar behavior is featured by the CDFS.

| 3C 295 | CDFS | |
|---|---|---|
| keV | ||
| keV | ||
| keV | - |
Tab.1 KS test for CDFS and 3C 295 fields
5 Discussion
In this work we studied in great quantitative details the excess of sources clearly visible in the upper left corner of the Chandra observation of the 3C 295 galaxy cluster field (see fig. 1). Since N-body and hydrodynamical simulations show that clusters of galaxies lie at the nexus of several filament, this excess could represent a filament of the large scale structure of the Universe.
Moreover, if the redshift of our sources were the same of 3C 295 (), we could compute the galaxy overdensity of the field assuming a spherical distribution. Under these assumption, we obtain a density contrast of which, despite large uncertainties, is intriguingly close to the expected galaxy overdensity of filaments , and much smaller than the overdensities of clusters of galaxies ().
Thus, in order to study this candidate filament, further Chandra observations and optical identifications are pursued to obtain the redshift of the sources, to map out the 3C 295 region, and delimiting the filament properties up to scales of arcmin (i.e., Mpc) from the 3C 295 cluster.
More details on the present work can be found in D’Elia et al., A&A, submitted.
References
- [1] Barrow, J.D., Bhavsar, S.P. & Sonoda, D.H. 1984, MNRAS, 210, 19
- [2] M. Cappi et al., 2001, ApJ, 548, 624
- [3] F. Damiani, A. Maggio, G. Micela & S. Sciortino, 1997, ApJ, 483, 350
- [4] G. Hasinger et al., 1998, A&A, 329, 482
- [5] J.A. Peacock, 1999, “Cosmological Physics” (Cambridge: Cambridge University Press)
- [6] P. Rosati et al., 2002, ApJ, 566, 667
- [7] A. Vikhlinin & W. Forman, 1995, ApJL, 455, 109