The manifold spectra and morphologies of EROs††thanks: Based on observations made at the European Southern Observatory, Paranal, Chile (Program 70.A-0140(B)).
Deep VLT optical spectroscopy, HST+ACS (GOODS) imaging and VLA observations are used to unveil the nature of a complete sample of 47 EROs with and . The spectroscopic redshift completeness is 62%. Morphological classification was derived for each ERO through visual inspection and surface brightness profile fitting. Three main ERO morphological types are found: E/S0 galaxies (%), spiral-like (%) and irregular systems (%). The only ERO detected in the radio is likely to host an obscured AGN. The average radio luminosity of the star-forming EROs undetected in the radio implies star formation rates of the order of 33 M⊙yr-1. The colors, redshifts and masses of the E/S0 galaxy subsample imply a minimum formation redshift . With this there is enough time to have old and massive stellar spheroids already assembled at . We verify that the vs. color diagram is efficient in segregating old and dusty-star-forming EROs.
Key Words.:
Galaxies: evolution; Galaxies: elliptical and lenticular, cD; Galaxies: starbust; Galaxies: formation1 Introduction
Extremely Red Objects (EROs) are important probes of galaxy evolution. On one hand, they allow to constrain the formation epoch, the evolutionary pattern and the clustering of the oldest early-type galaxies at 1 (e.g. Daddi et al. 2000a,b; McCarthy et al. 2001; Cimatti et al. 2002a; Smith et al. 2002; Firth et al. 2002; Moustakas & Somerville 2002; Roche et al. 2002, 2003; Saracco et al. 2003). On the other hand, they allow to select dusty star-forming galaxies and obscured AGN in a way complementary to submillimeter surveys (Cimatti et al. 1998; Afonso et al. 2001; Mohan et al. 2002; Cimatti et al. 2002a; Franceschini et al. 2002; Brusa et al. 2002). Although recent VLT spectroscopy shed new light on moderately bright EROs with 19 (Cimatti et al. 2002a), the characteristics of fainter EROs is still unclear mainly because of their weakness which makes spectroscopy very challenging even with 8-10m-class telescopes. However, as different morphologies are expected in case of spheroids or star-forming systems, HST imaging can be used to complement spectroscopy for the faint ERO population (e.g. Moriondo et al. 2000; Yan & Thompson 2003). The main open questions about EROs include: the relative fraction of different ERO types, the nature and star formation rates of dusty EROs, the number density of the oldest high- spheroids selected as EROs, the fraction of obscured AGN hosted by EROs. In this paper we present the main results of very deep VLT spectroscopy, HST imaging and VLA observations aimed at investigating the nature of a complete sample of 47 EROs with . The properties of the sample will be presented in a companion paper (Cassata et al. 2003, in preparation). km s-1 Mpc-1, and are adopted.
2 The sample and the observations
The complete sample (already described by Cimatti et al. 2002a) is made by the 47 EROs with and present in the 32.2 arcmin2 area of the Chandra Deep Field South (CDFS; Giacconi et al. 2001) covered by the K20 survey (Cimatti et al. 2002b). One object was removed from the original sample because it was found to be a blend of two objects both with .
New VLT-UT4+FORS2 multi-object optical spectroscopy was made in November 2002 with the red-sensitive CCD array. The total integration time was 7.8 hours during 0.7′′-1.0′′ seeing conditions, with 1.0′′ wide slits, grism 300I (R660) and dithering of the targets along the slits. The mask included 13 EROs of the K20/CDFS sample that were previously unidentified or not observed. The spectra were reduced and analyzed with the methods described Cimatti et al. (2002a, 2002b). VLT spectroscopy was complemented with the HST+ACS imaging in the bands taken in the GOODS/HST Treasury Program (Giavalisco et al. 2003).
Deep radio data were obtained with the VLA at 1.4 GHz in 1999 October with a bandwidth of 25 MHz in each of two circular polarizations, and at 4.8 GHz in 1999 Feb with a bandwidth of 100 MHz in each of two circular polarizations, for 12-hours total at both frequencies (Kellermann et al. 2003, in preparation). The rms sensitivities were 8.6 Jy and 9.6 Jy at 1.4 and 4.8 GHz, respectively, each with a full-width half-power resolution of . The reductions were made using AIPS and each field was self-calibrated. The position and flux density of each source with a peak flux density greater than 3.5-rms was determined from a Gaussian model fit of the source.
3 VLT spectroscopy and HST imaging results
The 13 ERO spectra provided 9 new redshift measurements: 7 star-forming galaxies at with [OII]3727 emission, and 2 early-type objects at . When added to the previous identifications of Cimatti et al. (2002a), the spectroscopic redshift completeness for the EROs in the K20/CDFS area increases to 81% (21/26) () and 62% (29/47) (). Photometric redshifts for the 18 spectroscopically unidentified EROs were derived using the ESO/GOODS VLT+FORS1 and the new VLT+ISAAC public imaging and the software (Bolzonella et al. 2000). The agreement between spectroscopic and photometric redshifts is good and does not depend on the ERO class, with =0.001 and =0.16 (29 EROs). Figure 1 shows the redshift distributions divided into morphological classes (see Section 4).

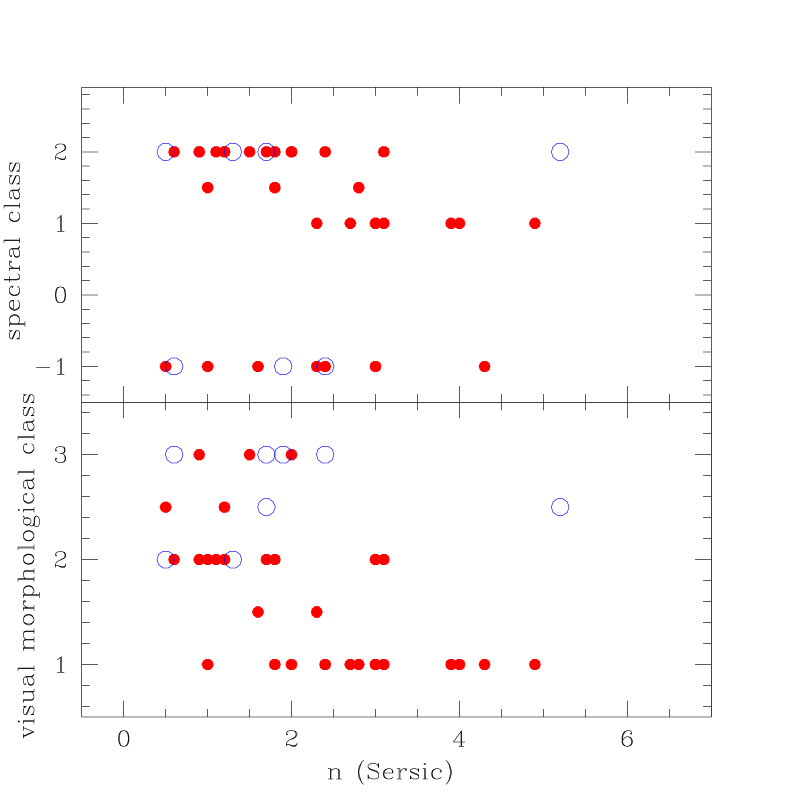
The morphological type of EROs was first estimated by visual inspection of the ACS images and isophotal maps in the four available bands (). One ERO (not observed spectroscopically) is unresolved and has colors consistent with being a M star. Since in some cases the spatial resolution and/or the S/N ratio turned out to be limited, we just assigned each object to one of the following broad classes: E/S0 galaxies (class 1), spiral-like objects (class 2) and irregular/interacting systems (class 3). Ambiguous cases were flagged by introducing the intermediate classes 1.5 and 2.5. Thus, we used the GASPHOT software (Pignatelli and Fasano 1999) to carry out a quantitative analysis on the -band ACS images (filter F850LP) by fitting the surface brightness profile of each ERO with the Sersic law (), convolved with the average PSF extracted from the stars in the field. Being the bulk of the sample at , the filter F850LP is close to the rest-frame -band, thus minimizing the effects of dust extinction and morphological K-correction for the available set of ACS filters. EROs belonging to the class 1.5 and having 2.5 or 1.5 were assigned to the class 1 or 2, respectively, while the cases with 1.52.5 were assigned to intermediate class 1.5. Instead, the Sersic index showed to be ineffective in disentangling classes 2 and 3, making advisable to leave unchanged most of the dubious cases with flag 2.5 (10 objects). Indeed, for six of these objects the fitting algorithm failed to converge, due to the extremely irregular and noisy image structure. These objects are not reported in the lower panel of Fig.2, where the final classification is plotted versus the Sersic index. We note that the larger number of class-2.5 vs. class-1.5 objects and the higher redshifts of “irregular” EROs (Fig.1) may be due to morphological K-correction effects (e.g. Marcum et al. 2001; Windhorst et al. 2002). By taking into account the previous uncertainties, the ranges of morphological fractions are 30–37% (class 1 – class 1+1.5), 24–46% (class 2 – class 2+2.5) and 17–39% (class 3 – class 2.5+3). The fractions are in reasonable agreement with the recent results by Moustakas et al. (2003) and Gilbank et al. (2003), and do not significantly change as a function of the limiting magnitude. Fig.2 (top panel) and Fig.3 show that a rather good agreement is present between the morphological and spectroscopic classes.
4 Dusty star-forming EROs and obscured AGN
Only one object was detected at level ( Jy) in the 1.4 GHz radio source catalog of the CDFS (Kellermann et al. 2003, in preparation). Our radio detection rate (1/46 at poissonian confidence level) is compatible with the preliminary results of the Phoenix Deep Survey (Hopkins et al. 2003) where 6% of a sample of 425 EROs (, ) are detected with fluxes Jy () (J. Afonso, private communication), with the results of Smail et al. (2002) (3/50 EROs with , and Jy at 1.4 GHz) and Roche et al. (2002) (1/31 EROs with , and Jy at 1.4 GHz).
The ERO detected in the radio is an emission line object with [OII]3727 at and a spiral-like morphology. The flux densities at 1.4 GHz and 4.8 GHz are 106.88.6 Jy and 155.19.6 Jy respectively, implying a flat/inverted spectrum with (). The object is also present in the X-ray catalog of Alexander et al. (2003) (RA=03:32:10.80, Dec= -27:46:27.6, J2000) with fluxes F(0.5-2 keV)=8.67 cgs and F(0.5-8 keV)=3.08 cgs, corresponding to luminosities of 1.4 erg s-1 and 5 erg s-1 respectively. Its X-ray luminosity, and location in typical segregation diagrams (e.g. vs. radio flux, optical flux vs. 0.5-8 keV flux; Bauer et al. 2002) are more suggestive of a Type 2 AGN than a starburst galaxy. The lack of broad MgII2800 emission implies obscuration of the active nucleus. From the X-ray hardness ratio we derive log(NH) 22.7 cm-2 (assuming a photon index ).
Although EROs are often found as faint counterparts of X-ray selected sources (e.g. Yan et al. 2003), the fraction of -selected EROs with X-ray emission is rather small (e.g. Alexander et al. 2002; 14% at 20.1; Roche et al. 2003; 8% at ). Taking into account the only other X-ray source detected in our ERO sample (Brusa et al. 2002), the fraction of X-ray emitting EROs amounts to 2/46 (1.5-10% at 1 poissonian confidence level), consistently with the above mentioned results.
Although only one ERO has been detected significantly in the radio, a mean flux density of the undetected sources was estimated by comparing the flux density distribution of the non-detected ERO sources with that expected from noise and confusion. The radio intensity distribution at 1.4 GHz for the 28 non-detected spiral-like + irregular ERO sources has a rms of Jy and an average value of Jy compared with an rms of Jy and average value of Jy for the control sample of 270 random locations in the field. From this excess we infer that the average flux density of ERO sources at 1.4 GHz is Jy. At 5 GHz we estimate an average flux density of Jy. For the 17 E/S0 galaxies we obtained limit of Jy at both 1.4 and 5 GHz.
Adopting a radio spectral index , the average rest-frame 1.4 GHz luminosity is W Hz-1 for the average redshift of the 28 undetected star-forming EROs (). Following Condon (1992) and Haarsma et al. (2000) (with Salpeter IMF and 0.1-100 M⊙ mass range), we derive SFR 33 M⊙ yr-1. The estimated SFRs are consistent with those obtained by Brusa et al. (2002) using the X-ray emission (5–44 M⊙ yr-1). Following Kennicutt (1998), the expected average far-IR luminosity is L⊙ corresponding to 850m observed fluxes below 1 mJy, thus explaining the low detection rate of EROs with submm/mm continuum observations (e.g. Mohan et al. 2002). In comparison, the [OII]3727 luminosity of all the spectroscopically identified star-forming EROs in the CDFS provides an average SFR=2.8 M⊙ yr-1. If this difference with the radio is solely due to dust extinction, the required average reddening is . This amount of reddening is significantly larger than in Lyman-break galaxies (median , range ; Giavalisco 2002 and references therein). The average SFR(radio) implies a cosmic SFR density of EROs at of 0.008 M⊙ yr-1 Mpc-3 (adopting the comoving volume between and ), corresponding to about 12% of the total budget at that redshift (e.g. Somerville et al. 2001). This is strictly a lower limit because our sample is limited to and due to the conservative volume adopted between and .
5 The oldest and massive spheroids at 1
The reddest spheroidals selected as EROs represent the oldest envelope of the E/S0 population at 1 and are crucial to constrain the earliest epoch of massive system formation.
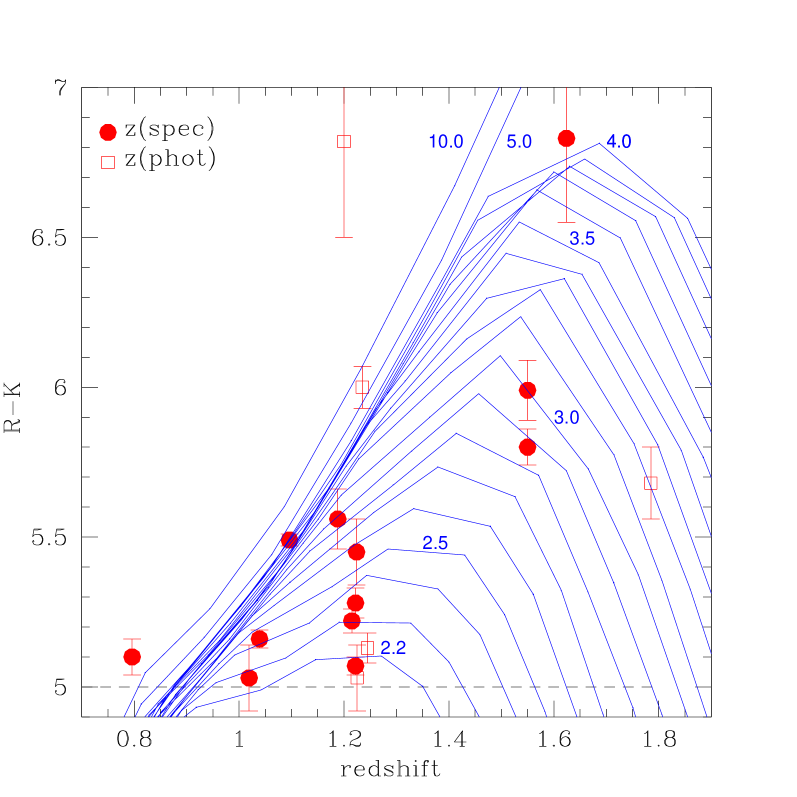
Taking into account the non-poissonian fluctuations due to clustering (Daddi et al. 2000a; Roche et al. 2002), the observed surface density of E/S0 galaxies (morphological class 1-1.5) is arcmin-2 () ( at ). The Pure Luminosity Evolution (PLE) model of Daddi et al. (2000b) with a star formation -folding time Gyr and a formation redshift predicts surface densities of 2 arcmin-2 and 0.9 arcmin-2 for the 2MASS local early-type (E+S0+ some contamination by Sa galaxies; Kochanek et al. 2001) and the local elliptical (E only; Marzke et al. 1994) luminosity functions respectively. Although the large uncertainties on the surface density prevent a stringent comparison with the PLE model, we note that the observed density of E/S0 galaxies at 0.81.6 is still formally consistent with the above PLE predictions within 1-2. The question of high- early-type galaxies is still controversial (e.g. Treu 2003 and references therein), and large area surveys are required to overcome the effects of the strong clustering. Figure 4 shows a significant spread in the formation redshifts of the identified E/S0 galaxies (2.24.0 for Gyr). If Gyr, the range is 23. From the lowest acceptable formation redshift () to there is enough time to reach an age of 2.5 Gyr, compatible with that estimated from the average spectrum and from the 4000 Å continuum break amplitude of old EROs at (Cimatti et al. 2002a), and within the range of the ages of spheroidal galaxies (1.5- 3.5 Gyr) estimated with different spectral synthesis models (e.g. Nolan et al. 2001 and references therein). The rest-frame near-IR luminosities of old EROs in our sample are in the range of -24.5 and -27 (Pozzetti et al. 2003), and their stellar masses are – M⊙ (Fontana et al. 2003, in preparation).
The morphology, spectral properties, luminosities, inferred ages, formation redshifts and stellar masses imply the existence of a substantial population of old, passively evolving and fully assembled massive spheroids at which requires that major episodes of massive galaxy formation occurred at 2. Daddi et al. (2003) uncovered a population of massive and clustered star-forming galaxies at which may represent the long sought-for progenitors of massive spheroids.
6 Testing the photometric segregation of EROs
We used our sample to test the segregation of morphologically classified EROs in the – diagram proposed by Pozzetti & Mannucci (2000) (Fig. 5). The colors were derived from the new public ESO GOODS imaging taken with the VLT FORS1 () and ISAAC ().
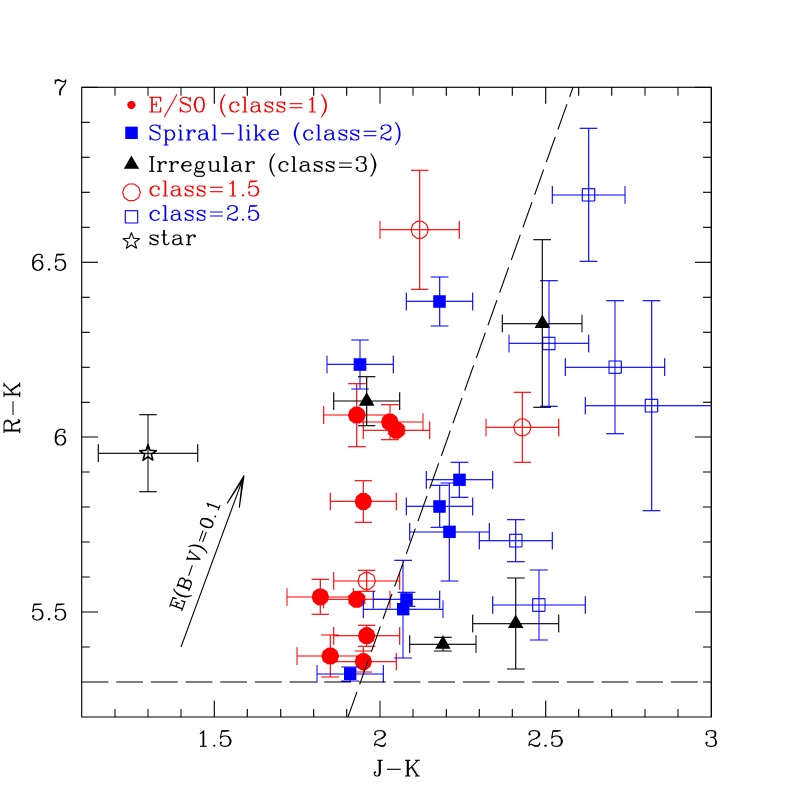
The relation used in Fig. 5 (dashed line) to define the boundary line between “old” and “dusty” EROs is =0.34()+0.09. This relation was derived specifically for the set of filters of our photometry, and is valid for 5.3 (Pozzetti & Mannucci 2000).
Two main results are evident from Fig.5: (1) the E/S0 galaxies with secure morphological classification (class=1) and most of star-forming EROs lie in their expected regions, (2) a few star-forming EROs (classes=2-3), however, are found in the region of E/S0 galaxies. If we consider only the EROs with reliable morphological classification, the contamination of the E/S0 region is 4/15 (27%), whereas 4/18 (22%) star-forming EROs do not fall in their expected locus. The contamination of the E/S0 region may be due to star-forming galaxies with a substantial underlying old stellar population which dominates the colors. Our results indicate that the color – color segregation is efficient and that the typical contamination amounts to 20-30% (see also Pierini et al. 2003).
Acknowledgements.
We thank R. Gilli for useful discussion, J. Afonso for information about the Phoenix survey and the referees for the constructive suggestions.References
- (1) Afonso J., Mobasher B., Chan B., Cram L. 2001, ApJ, 559, L101
- (2) Alexander D.M., Vignali C., Bauer F.E. et al. 2002, ApJ, 123, 1149
- (3) Alexander D.M., Bauer F.E., Brandt W.N. et al. 2003, ApJ, in press
- (4) Bauer F.E., Alexander D.M., Brandt W.N. et al. 2002, AJ, 124, 2351
- (5) Bolzonella M., Miralles J.-M., Pelló R. 2000, A&A, 363, 476
- (6) Brusa M., Comastri A., Daddi E., Cimatti A., Mignoli M., Pozzetti L. 2002, ApJ, 581, L89
- (7) Cimatti A., Andreani P., Röttgering H., Tilanus R., 1998, Nature 392, 895
- (8) Cimatti A., Daddi E., Mignoli M. et al. 2002a, A&A, 381, L68
- (9) Cimatti A., Mignoli M., Daddi E. et al. 2002b, A&A, 392, 395
- (10) Condon J.J. 1992, ARA&A, 30, 575
- (11) Daddi E., Cimatti A. & Renzini A., 2000b, A&A 362, L45
- (12) Daddi E., Cimatti A., Pozzetti L., et al., 2000a, A&A 361, 535
- (13) Daddi E., Cimatti A., Renzini A. et al. 2003, ApJL, in press
- (14) Firth A.E., Somerville R.S., McMahon R.G. et al. 2002, MNRAS, 332, 617
- (15) Franceschini A., Fadda D., Cesarsky C.J., Elbaz D., Flores H., Granato G.L. 2002, ApJ, 568, 470
- (16) Giacconi R., Rosati P., Tozzi P. et al. 2001, ApJ,551,624
- (17) Giavalisco M. 2002, ARA&A, 40, 579
- (18) Giavalisco M., Ferguson H.C., Koekemoer A.M. et al. 2003, ApJL, in press
- (19) Gilbank D.G., Smail I., Ivison R.J., Packham C. 2003, MNRAS, in press
- (20) Haarsma D.B., Partridge R.B., Windhorst R.A., Richards E.A. 2000, ApJ, 544, 641
- (21) Hopkins A.M., Afonso J., Chan B. et al. 2003, AJ, 125, 465
- (22) Kennicutt R.C. 1998, ARA&A, 36, 189
- (23) Kochanek C.S., Pahre M.A.,Falco E.E. et al. 2001,ApJ,560,566
- (24) Marcum P.M., O’Connell R.W., Fanelli M.N. 2001, ApJS, 132, 129
- (25) Marzke R.O., Geller M.J., Huchra J.P., Corwin H.G. 1994, AJ, 108, 437
- (26) McCarthy P.J., Carlberg R.G., Chen H.-W. et al. 2001, ApJ, 560, L131
- (27) Mohan N.R., Cimatti A., Röttgering H.J.A., et al. 2001, A&A, 383, 440
- (28) Moriondo G., Cimatti A. & Daddi E., 2000, A&A 364, 26
- (29) Moustakas L.A, Somerville R.S. 2002, ApJ, 577, 1
- (30) Moustakas L.A, Casertano S., Conselice C. et al 2003, ApJL,in press
- (31) Nolan L.A., Dunlop J.S., Jimenez R. 2001, MNRAS, 323, 385
- (32) Pierini D., Maraston C., Bender R., Witt A.N. 2003, MNRAS in press
- (33) Pignatelli E., Fasano G. 1999, Ap&SS, 269, 657
- (34) Pozzetti L., Mannucci F. 2000, MNRAS, 317, L17
- (35) Pozzetti L., Cimatti A., Zamorani G., et al. 2003, A&A, 402, 837
- (36) Roche N.D., Dunlop J., Almaini O. 2003, MNRAS, in press
- (37) Roche N.D., Almaini O., Ivison R.J., Willott C.J. 2002, MNRAS, 337, 1282
- (38) Saracco P., Longhetti M., Severgnini P. et al. 2003, A&A, 398, 127
- (39) Smail I., Owen F., Morrison G.E., Keel W.C., Ivison R.J., Ledlow M.J. 2002, ApJ, 581, 844
- (40) Smith G.P., Smail I., Kneib J.-P. et al. 2002, MNRAS, 330, 1
- (41) Somerville R.S, Primack J.R.,Faber S.M. 2001,MNRAS,320,504
- (42) Treu T. 2003, in ”Carnegie Observatories Astrophysics Series, Vol. 3: Clusters of Galaxies: Probes of Cosmological Structure and Galaxy Evolution”, ed. J.S. Mulchaey, A. Dressler, and A. Oemler (Cambridge Univ. Press)
- (43) Windhorst R.A., Taylor V.A., Jansen R.A. et al. 2002, ApJS, 143, 113
- (44) Yan H., Windhorst R.A., Röttgering H.J.A. et al. 2003, ApJ, 585, 67
- (45) Yan L., Thompson D. 2003, ApJ, 586, 765