The Ultraluminous X-ray Source NGC 1313 X-2 (MS 0317.7-6647) and its Environment
Abstract
We present new optical and Chandra observations of the field containing the ultraluminous X-ray source NGC 1313 X-2. On an ESO 3.6 m image, the Chandra error box embraces a point-like object and excludes a previously proposed optical counterpart. The resulting X-ray/optical flux ratio of NGC 1313 X-2 is . The value of , the X-ray variability history and the spectral distribution derived from a re-analysis of the ROSAT, ASCA and XMM data indicate a luminous X-ray binary in NGC 1313 as a likely explanation for NGC 1313 X-2. If the X-ray soft component observed in the XMM EPIC spectrum originates from an accretion disk, the inferred mass of the compact remnant is , making it an intermediate mass black hole. The derived optical luminosity () is consistent with that of a companion. The properties of the environment of NGC 1313 X-2 are briefly discussed.
1 Introduction
First revealed by the Einstein Observatory (see e.g. Fabbiano 1989), point-like, off-nuclear X-ray sources with luminosities significantly exceeding the Eddington limit for one solar mass are being progressively discovered in the field of many nearby galaxies. To date, hundreds of such sources have been found in dozens of galaxies, both ellipticals and spirals (e.g. Colbert & Ptak 2002). These powerful objects, commonly referred to as ultraluminous X-ray sources (ULXs), do not appear to have an obvious Galactic counterpart. Despite some of them have been identified with supernovae or background active galactic nuclei, the nature of most of these sources remains unclear. X-ray spectra have been obtained with the Einstein, ROSAT, ASCA and recently XMM-Newton and Chandra satellites. Although the statistics is rather poor, in many cases fitting with simple models indicates that the spectral properties are consistent with those of Galactic black hole binaries (e.g. Foschini et al. 2002a). About half of them show some degree of variability in the X-ray flux. Among the various possibilities, the most favored explanation is that ULXs are powered by accretion and that they are somewhat special X-ray binaries, either containing an intermediate mass black hole (BH) with (e.g. Colbert & Mushotzky 1999; Kaaret et al. 2001) or having beamed emission toward us (e.g. King et al. 2001; Kaaret et al. 2003). For a recent review on the properties of ULXs we refer to Fabbiano & White (2003).
Optical observations are of fundamental importance to better assess the nature of these sources but they are still rather scarce (see e.g. Cagnoni et al. 2003; Foschini et al. 2002b). Some ULXs have optical counterparts in the Digitized Sky Survey or Hubble Space Telescope images (e.g. NGC 5204 X-1; Roberts et al. 2001; Goad et al. 2002) and some appear to be embedded in emission nebulae a few hundred parsecs in diameter (Pakull & Mirioni, 2002).
NGC 1313 X-2 was one of the first sources of this type to be found. It was serendipitously discovered in an Einstein IPC pointing toward the nearby SBc galaxy NGC 1313 (Fabbiano & Trinchieri, 1987). Originally included in the Einstein Extended Medium Sensitivity Survey as MS 0317.7-6647, it is located south of the nucleus of NGC 1313. Stocke et al. (1995) investigated the nature of MS 0317.7-6647 on the basis of X-ray, optical and radio observations. They identified a possible optical counterpart and concluded that the source could be either a Galactic isolated neutron star or a binary containing a massive BH in NGC 1313. Spectral fits to ROSAT PSPC data (Stocke et al., 1995; Colbert et al., 1995; Miller et al., 1998) yielded results consistent with many single component models. ASCA observations (Petre et al., 1994; Makishima et al., 2000) are described successfully by a multi-color disk blackbody (MCD) model, representing thermal emission from a standard accretion disk around a BH. A very recent analysis of a XMM EPIC-MOS observation of NGC 1313 (Miller et al., 2003) indicates that two spectral components, soft and hard, are required to fit the spectrum of NGC 1313 X-2 and the normalization of the soft component yields a conspicuous mass of the black hole .
We present new optical111Based on observations collected at the European Southern Observatory, Chile, Program number 68.B-0083(A). and Chandra observations of NGC 1313 X-2, with the aim to shed further light on its enigmatic nature. In § 2 we present Chandra data and re-analyze all the available X-ray observations of NGC 1313 X-2. In § 3 optical observations of the field of this ULX are reported. Finally, the implications of our results on the nature of NGC 1313 X-2 are discussed in § 4.
2 X-ray Data
NCG 1313 X-2 was first observed by Einstein with the IPC instrument in 1980. It was then pointed several times by ROSAT (PSPC and HRI) between 1991 and 1998 (Stocke et al., 1995; Colbert et al., 1995; Miller et al., 1998; Schlegel et al., 2000), by ASCA (SIS and GIS) in 1993 and 1995 (Petre et al., 1994; Makishima et al., 2000) and by XMM (EPIC) in 2000 (Miller et al., 2003). Most recent data are from a 2002 Chandra (ACIS-S) pointing, reported here for the first time. The Chandra observation began on 13 Oct 2002 and had a duration of 19.9 ks. The primary goal of the observation was to study sources near the center of the galaxy, but the aim-point was adjusted to also place NGC 1313 X-1, NGC 1313 X-2, and SN 1978K on the S3 chip of the ACIS-S. In addition, we present here a complete analysis of the XMM observation, including the EPIC-PN data, which were not considered by Miller et al. (2003).
2.1 X-ray astrometry
An accurate determination of the X-ray position of NCG 1313 X-2 can be obtained from the 2002 Chandra pointing, using the Chandra aspect solution. Chandra data were extracted from the S3 chip on the ACIS-S and subjected to standard processing and event screening. No strong background flares were found, so the entire observation was used. Because the source is off axis, the point spread function was fitted with an ellipsoidal Gaussian (1.9′′ and 1.1′′ along the two axes, rms values). Also, the pixel with the highest number of counts is offset by 0.8′′ from the center of the fitted ellipse. Taking these uncertainties into account, we conservatively estimate a positional error of 0.7′′ (1-). The final Chandra position is: 03h 18m 22.27s0.12s, -660 36′ 03.80.7′′.
In order to check the accuracy of the Chandra aspect solution, we exploited the presence in the field of view of a quite peculiar supernova, SN 1978K, that shows powerful radio and X-ray emission. The Chandra position of SN 1978K is 03h 17m 38.69s, -660 33′ 03.6′′ (J2000), within from the accurate (0.1′′) radio position of Ryder et al. (1993). This is consistent with the expected Chandra aspect accuracy.
The position of NGC 1313 X-2 was previously determined from the ROSAT HRI (Stocke et al. 1995; Schlegel et al. 2000) and XMM EPIC-MOS (Miller et al., 2003) images. Typical 1- error boxes are for ROSAT HRI and for XMM EPIC-MOS. The ROSAT and XMM positions and corresponding error boxes are summarized in Table 1.
2.2 X-ray spectrum and lightcurve
We analyzed the XMM EPIC data from both the MOS and PN cameras (operated with the medium filter). The EPIC-PN spectrum is reported here for the first time and was extracted directly from the observation data file because the automatic pipe-line processing failed to produce a standard event list for the EPIC-PN camera. Both reduction procedures (epchain and epproc) were used to extract the data obtaining similar results (differing typically by a few percents). Data screening, region selection and event extraction were performed using standard software (XMMSELECT v 2.43.2). An analysis of the MOS and PN light curves shows that solar flares are present in both datasets. They were filtered out using the standard criterion (total off-source count rate above 10 keV 5 counts s-1 for MOS and 15 counts s-1 for PN). We extracted the source counts from a circle of 40′′ and 30′′ for the MOS and PN cameras, respectively. The proximity of the source to one of the CCD edges in the EPIC-MOS data requires some care. We eliminated the area of a box aligned and superimposed to the CCD boundary to avoid contamination from bad pixels close to the source. The background was selected from a circle of 60′′ in a nearby source-free region of the same CCD. Ancillary and response files were produced using the appropriate XMMSELECT tasks. Data were grouped to require at least 20 counts per bin for the MOS data and 40 counts per bin for the PN data, and were then analyzed and compared with different models using XSPEC (v 11.2.0). To minimize the effects of possible relative calibration uncertainties, the fit of the MOS1, MOS2 and PN spectra were performed with an overall normalization constant (those of the two MOS cameras differ by %, while that of the PN instrument is larger by %). The count rates are 0.08 counts s-1 for the MOS cameras and 0.25 counts s-1 for the PN.
In order to reconstruct the X-ray variability history of NGC 1313 X-2, we have carefully re-analyzed also the ROSAT and ASCA observations. Extraction regions for the ASCA SIS data were chosen with care to avoid contamination from the CCD edges and SN 1978K. Spectra were grouped to require at least 15 counts per bin for the ROSAT data and 20 counts per bin for the ASCA data.
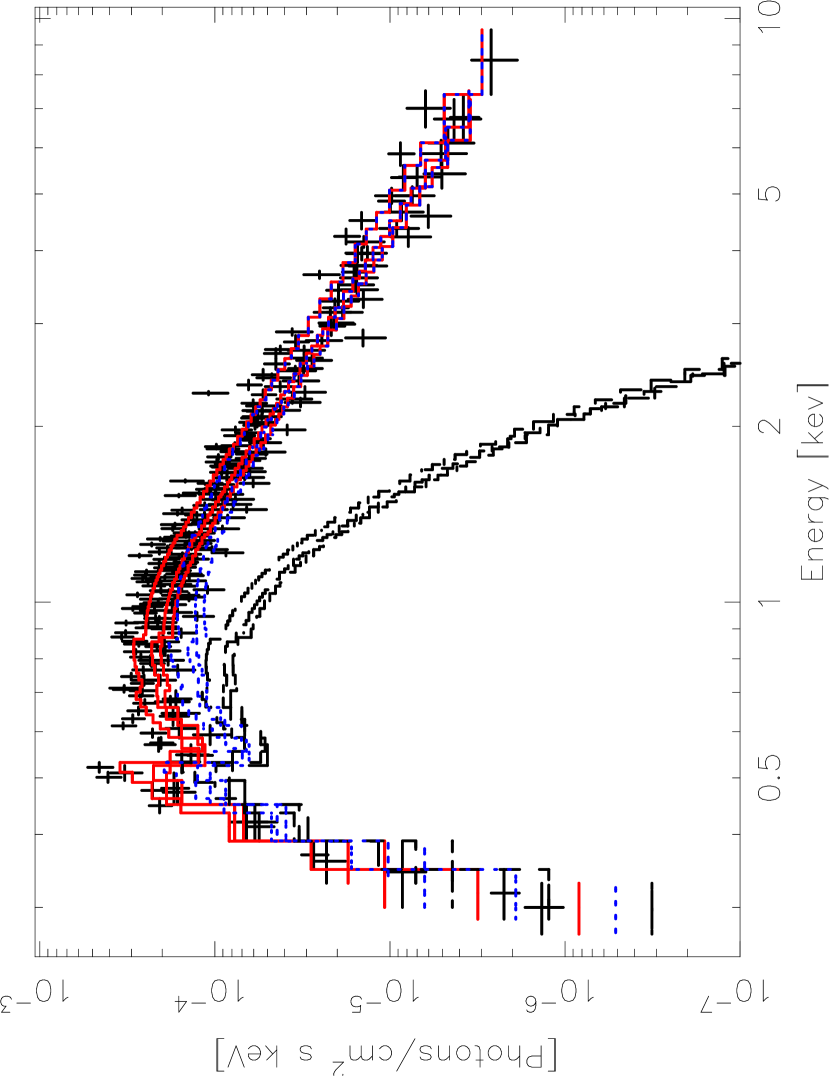
The results of the spectral analysis are listed in Table 2. The statistics of the XMM EPIC spectrum is significantly improved including the EPIC-PN data (the PN camera has almost twice more counts than each single MOS instrument). An absorbed power-law does not provide a satisfactory fit of the joint MOS1, MOS2 and PN spectra ( for 249 d.o.f.). Two components models provide a significant improvement over single component ones. The best fit is obtained with an absorbed soft, thermal component plus a power-law. Adding a MCD model to the power-law results in an improvement of the fit which is significant at the (epchain/epproc) level. Figure 2 shows the results for a MCD+power-law fit. The resulting best fitting parameters are eV, and cm-2 for the inner disk temperature, photon index and column density, respectively (see Table 2). There are residuals in the fit (mainly in the EPIC-PN spectrum) that suggest the possible presence of emission lines. We emphasize that the EPIC-PN data provide marginal evidence for the presence of a soft component even at low metallicities. Reducing the abundances of the absorbing gas at 0.5 solar, a simple power-law fit of the EPIC-PN data has (89 d.o.f.), while a MCD+power-law fit gives (87 d.o.f.). Finally, it is worth noting that the value of is % larger (although consistent within 1-) than that derived by Miller et al. (2003).
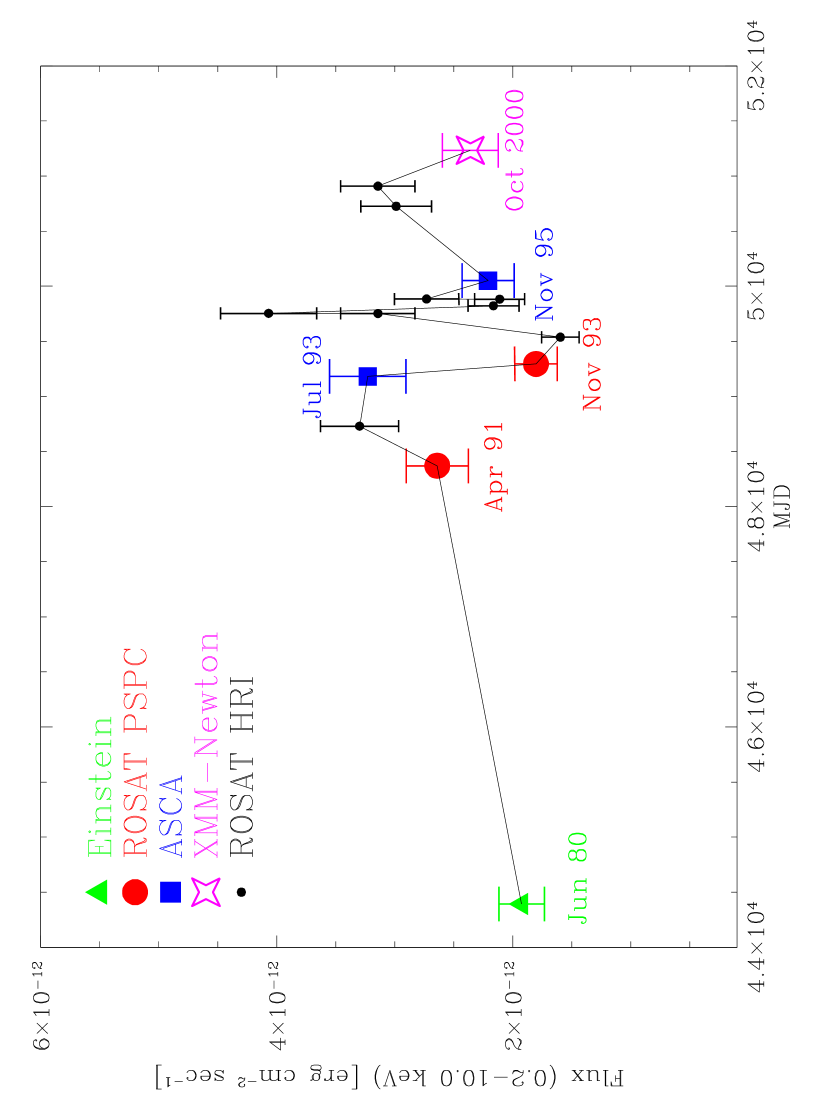
In Figure 1 we report the X-ray flux derived from all the available observations of NGC1313 X-2. The fluxes were consistently derived from the best fit parameters of the X-ray spectral analysis reported in Table 2. An approximate estimate of the errors, based on counting statistics, is 5-10%. The Chandra point is not included in Figure 1 because of pile-up problems. The unabsorbed 0.2–10 keV flux from both the XMM EPIC-MOS and PN instruments agree within and give an average value of erg cm-2s-1. This value is lower by a factor than that estimated by Miller et al. (2003). Variability of up to a factor 2 on a timescale of months is clearly present and it is reminiscent of the behavior observed in Galactic X-ray binaries. If uncertainties in the best-fitting spectral parameters are taken into account, the amplitude of variability is reduced but not eliminated. This suggests that a compact object is present in NGC 1313 X-2. If the emission is isotropic and the distance is that of the host galaxy ( Mpc; Tully 1988), the X-ray luminosity in the 0.2–10 keV range is erg s-1. If at maximum the source radiates at the Eddington limit , the BH mass is . Sub-Eddington accretion would imply an even larger mass.
Interestingly, comparing data from the first and second epoch ASCA observations, the X-ray flux of NGC 1313 X-2 appears to increase with increasing spectral hardness (see Table 2). This behavior is similar to that observed in the ULXs of the Antennae galaxy (Fabbiano et al., 2003) and is opposite to what is usually seen in Galactic BH X-ray binaries (e.g. Cyg X-1).
3 Optical Observations
Optical images of the field of NGC 1313 X-2 in the -band (Bessel filter) were taken on 16 January 2002 with the 3.6 m telescope of the European Southern Observatory (ESO) at La Silla (Chile). We used EFOSC2 with a Loral/Lesser CCD of 20482048 pixels yielding a field of view of at a resolution of 0.314′′/pixel (re-binned by a factor 2). The night was clear with a seeing of about 1′′. Four images were obtained for a total exposure time of 1320 s. Standard reduction of the data (including bias subtraction and flat-field correction) was performed within the IRAF (v 2.12) environment.
A spectrum of one of the field objects (object A; see below) was secured on the same night. We performed low-resolution (13.4 A, grism#4) spectroscopy for a total exposure time of 1200 s. After applying standard corrections and sky subtraction, cosmic rays were removed and the spectrum was corrected for atmospheric extinction. At the time of the optical observations object A had already been imaged at the 1.1 m Las Campanas telescope by Stocke et al. (1995) and was considered a possible counterpart of NGC 1313 X-2. Although the new accurate Chandra position rules out an association with this object (see below), the spectrum can be used to gain insight on the properties of a surrounding nebula, possibly associated with the X-ray source (see e.g. Pakull & Mirioni 2002).
3.1 Astrometry and photometry of field objects
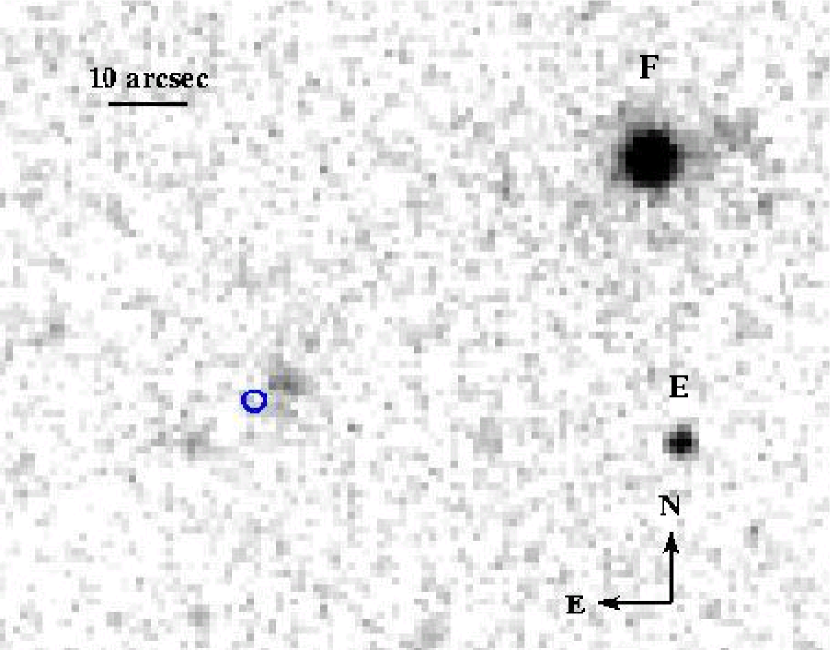
Our four ESO images were astrometrically calibrated using an IRAF task (PLTSOL) and performing a polynomial interpolation starting from the positions of GSC2 ESO field stars. The internal accuracy of this procedure was estimated comparing the actual positions of a number of GSC2 stars not used for astrometric calibration with the positions contained in the catalog. The accuracy is 0.3 (1-). The four calibrated images were then summed together and the resulting image is shown in Figure 3.
In order to check for the relative systematics between the optical and X-ray astrometric calibrations, we used again the position of SN 1978K. This supernova is inside the Chandra field of view but outside our optical image. Thus, we analyzed also an archival image of SN 1978K (from the Padova-Asiago Supernova Archive) taken on 13 September 1999 with the same telescope and a similar instrumental set-up (ESO 3.6m+EFOSC/2.9+R#642, exposure time 180 s). After calibrating the archival image, the position of SN 1978K is 03h 17m 38.605s, -660 33′ 03.13′′ (J2000). This is within 0.28′′ from the radio position of Ryder et al. (1993), improving significantly upon the previous optical position by the same authors. The difference between the centroids of the optical and Chandra positions of SN 1978K is 0.69′′ ( -0.085s, -0.47′′). Although this difference is small and comparable with the statistical errors, we decided to apply this correction to the Chandra position of NGC 1313 X-2 to eliminate any systematic error between the optical and X-ray astrometric calibrations. The resulting Chandra position of NGC 1313 X-2 is reported in Table 1.
The photometry of the objects in our optical image was performed calibrating the frame with the -band magnitudes of 23 stars from the SuperCosmos Sky Survey (Hambly, Irwin & MacGillivray, 2001) homogeneously distributed over the field of view. The internal accuracy of this calibration is 0.2 mag. Aperture (5′′ radius) magnitudes are reported in Table 1.
3.2 Spectroscopy of the emission nebula
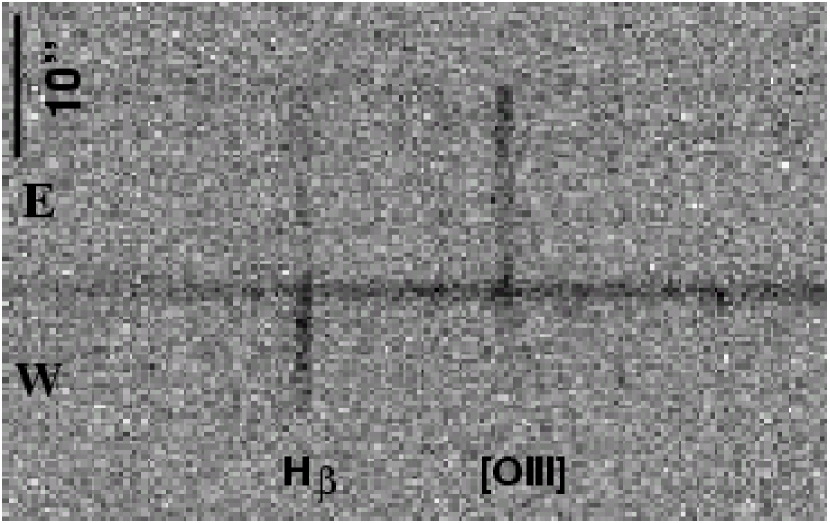
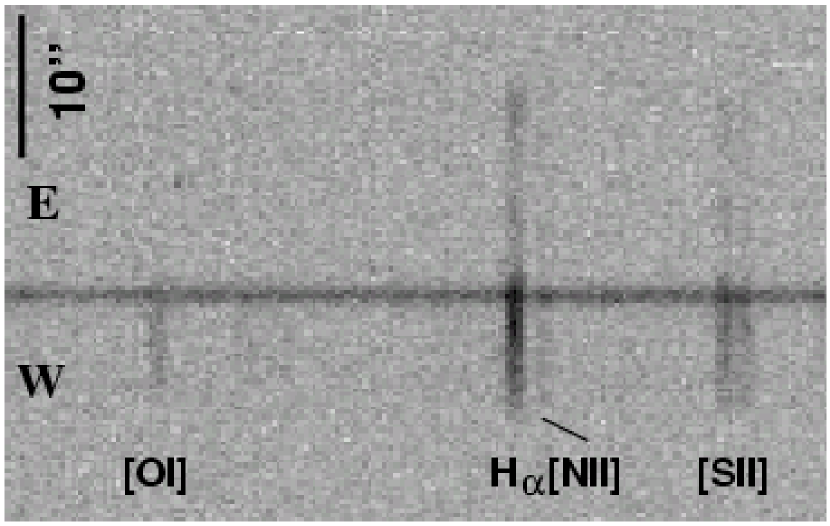
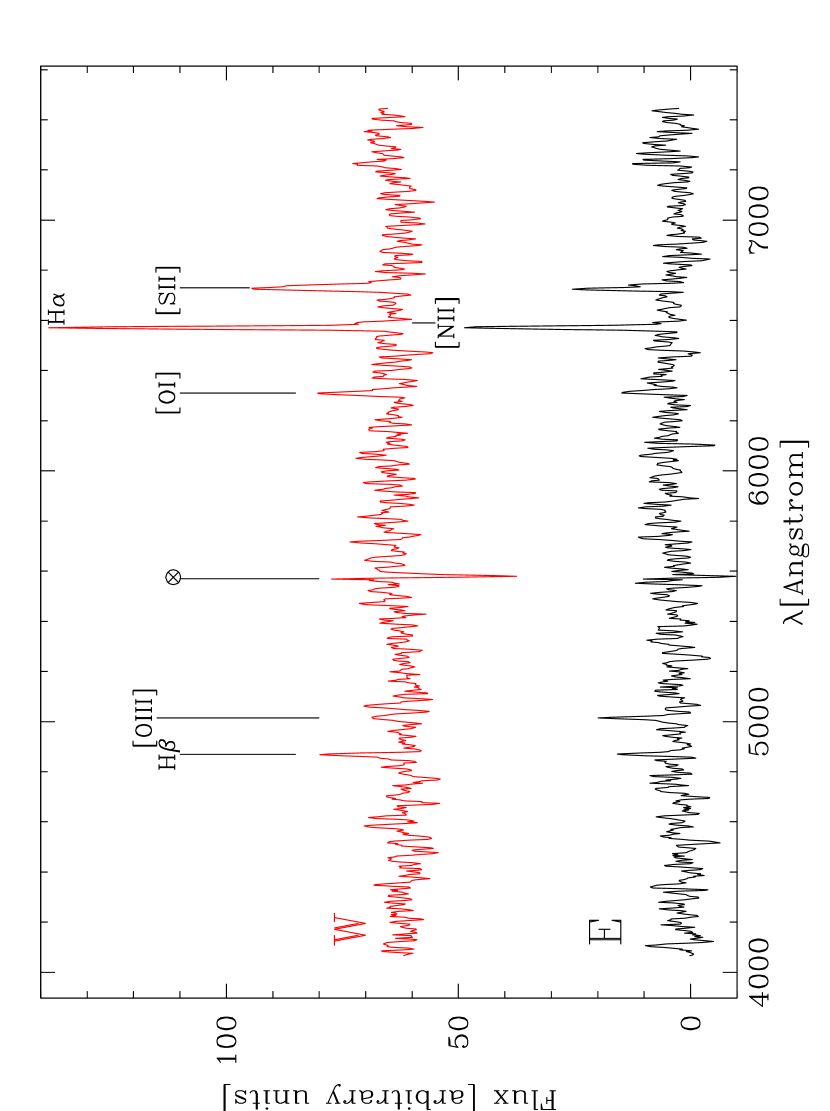
The two-dimensional spectrum of the field around object A (Figure 4) shows clear emission lines extending for tens of arcsecs from east to west, confirming the existence of an extended ( 400 pc) optical emission nebula that was first found in deep Hα images by Pakull & Mirioni (2002). A one-dimensional spectrum of the field was extracted over an aperture of 0.9′′ (3 pixels) from two regions east-ward and west-ward of the position of object A and adjacent to it (Figure 5). Wavelength and relative flux calibration were applied to the data. The one-dimensional spectrum shows strong emission lines of Hα, Hβ, [SII] 6717–6731 A, [OI] 6300 A and [OIII] 4959-5007 A. The shift of the centroid of the lines ( A) is consistent with the recession velocity of the galaxy and indicates that the emission nebula is located in NGC 1313.
It is worth emphasizing the abrupt change in the absolute and relative intensity of the emission lines from east to west, indicating variations in the physical conditions and/or geometry of the emission nebula. In particular, strong emission from [OIII] is present on the east side but almost absent on the west side, while emission from Hα, [SII], [OI] and other elements is present on the west side but weaker or absent on the east side. A careful inspection of the line intensity profiles (in particular those of Hα and [SII]) reveals a fairly symmetric, broadly peaked profile, centered at west of the position of object A, and a weaker, roughly constant intensity component extending in the east direction.
4 Discussion
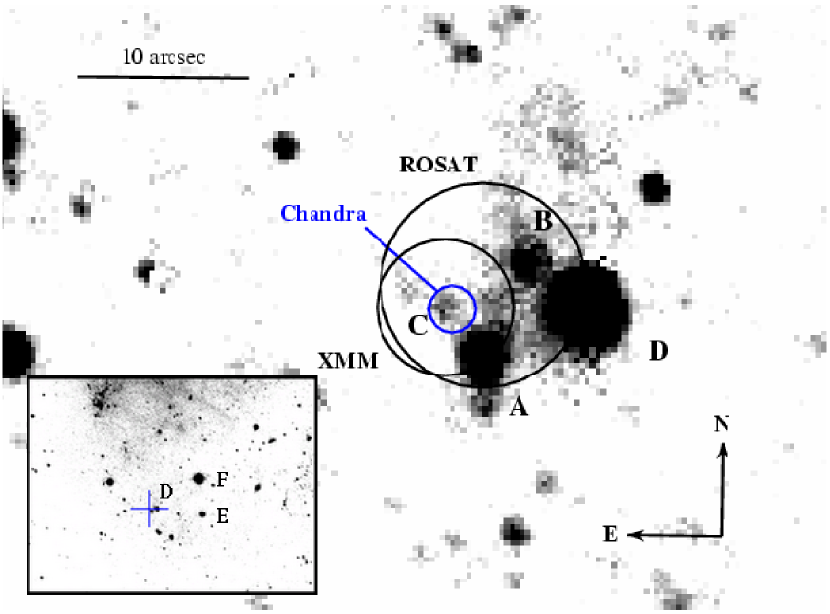
Our Chandra position of NGC 1313 X-2 (Table 1) is shown in Figure 3, together with the ROSAT HRI (Schlegel et al., 2000) and XMM EPIC-MOS (Miller et al., 2003) error boxes, overlaid on our ESO image. All measurements are consistent within 1-. The distance of the centroids of objects A, B and D with respect to the Chandra position is 3.6′′, 4.1′′ and 7.3′′, respectively. Even taking into account the statistical error on the optical positions (0.3′′), these three objects can be ruled out at a significance level of at least 3-. On the other hand, object C is inside the Chandra error box and its position coincides within 1- with that of NGC 1313 X-2, making it a likely counterpart.
From the maximum absorbed X-ray flux of NGC 1313 X-2 ( erg cm-2 s-1) and optical magnitude of object C (), we estimate . This value is very high, in agreement with the suggestion by Cagnoni et al. (2002) that ULXs can be selected on the basis of their large . Only Isolated Neutron Stars (INSs), heavily obscured AGNs and luminous X-ray binaries can reach such large values of the X-ray/optical flux ratio. INSs are extreme in this respect, with optical counterparts and typical X-ray-to-optical flux ratios (see e.g. Kaplan, Kulkarni & van Kerkwijk 2003) The presence of the relatively bright () object C in the Chandra error box makes this possibility unlikely. Furthermore, known INSs exhibit different spectral properties with no significant variability. On the other hand, a heavily obscured AGN is expected to have a rather hard X-ray spectrum and to emit significantly in the near-infrared (see e.g. Brusa et al. 2002). Given the X-ray luminosity of NGC 1313 X-2, an infrared magnitude is expected were it an obscured AGN. The lack of any IR counterpart on a K image of the 2MASS All Sky Image Service down to a limiting magnitude (10-) and the softer X-ray spectrum of NGC 1313 X-2 make this possibility unlikely, although a low resolution optical spectrum of object C is definitely required to settle this issue. Our accurate Chandra position and optical identification favor a very luminous X-ray binary in NGC 1313 as the likely explanation for NGC 1313 X-2. As a reference, the X-ray/optical flux ratio of persistent BH binaries at maximum is , while that of soft X-ray transients in outburst can reach (Masetti 1997). This is in line with the alleged binary nature of ULXs and is consistent with the observed properties of this source, such as the X-ray variability and the observed X-ray spectrum, including the presence of a soft component probably produced by an accretion disk.
If indeed NGC 1313 X-2 is a black hole binary, the X-ray spectral parameters, in particular the temperature of the MCD fit (hereafter referred to as ), can be used to estimate the BH mass. This is similar to what done by Miller et al. (2003) using the normalization of the MCD fit and, as discussed below, we reach similar conclusions. The effective temperature of a standard accretion disk depends on radius as , where is the accretion rate and is the innermost disk radius (e.g. Frank, King & Raine 1980). Assuming that represents an estimate of the maximum disk temperature, it is , with . Neglecting relativistic corrections and assuming that the disk terminates at the innermost stable circular orbit of a Schwarzschild BH, it is: , where is a color correction factor (, Shimura & Takahara 1995; Zampieri, Turolla & Szuszkiewicz 2001). Given the strong dependence of on temperature, any uncertainty in the accretion physics and radiative transfer may induce significant errors in the resulting value of . So, the inferred spectroscopic measurement of the BH mass should be taken simply as an approximate estimate. The low inner disk temperature obtained from the two-components fit to the XMM EPIC spectrum ( 200 eV) implies () for Eddington limited accretion, somewhat larger than that derived from the flux. This result removes the need for a rapidly spinning BH (invoked by Makishima et al. 2000 from an analysis of the ASCA data) and agrees with the conclusion of Miller et al. (2003) that NGC 1313 X-2 contains an intermediate mass BH. The large inferred BH mass does not require beamed emission. Then, the estimated accretion rate (assuming 10% efficiency) is , forcing the mass reservoir to be a companion star.
From the apparent magnitude () and absorption (, computed from the X-ray best fitting column density cm-2; Bohlin et al. 1978) of object C, we estimate an absolute magnitude and a luminosity in the range , depending on the adopted bolometric correction. If this originates from the companion star, the inferred luminosity is consistent with a main sequence star or a evolved OB supergiant (e.g. Bowers & Deeming 1984), making NGC 1313 X-2 a high-mass X-ray binary. In luminous Galactic X-ray binaries, the reprocessed optical emission from the disk may be significant. Assuming that 20–30% of the X-ray flux produced in the innermost part of the accretion disk intercepts the outer regions, for realistic values of the albedo (; e.g. de Jong, van Paradijs & Augusteijn 1996) few percents of the X-ray luminosity ( erg s-1) can be absorbed and re-emitted in the optical band. Characteristic emission lines of X-ray-ionized H, He or N, typically seen in luminous Galactic X-ray binaries should then be detectable in the optical spectrum. Also X-ray heating of the companion star itself may contribute to the optical emission. If the optical luminosity comes in part from X-ray re-irradiation, the mass of the companion would be lower. Taking as an upper limit for the mass of the companion, the mass ratio of the binary is . Writing the binary separation as (Paczyński, 1971), the orbital period of the system is yr. According to King et al. (2001), the system should not be a persistent X-ray source.
Although difficult to reconcile with the properties of the environment surrounding NGC 1313 X-2 (see below), we can not rule out also that the optical emission detected in the Chandra error box originates from a stellar cluster (see e.g. the case of a ULX in NGC 4565; Wu et al. 2002), in which case NGC 1313 X-2 may be a low-mass X-ray binary in the cluster.
The mass accretion rate required to produce the observed luminosity may in principle be provided by Roche-lobe overflow from an evolved companion or by a wind from a supergiant. In the first case, evolutionary swelling of the companion keeps pace with the increase in Roche lobe size and the system remains self-sustained: accretion is likely to proceed through a disk. In the second case, assuming 10% accretion efficiency and that the BH can capture of the mass outflow, the wind must be very powerful (). A lower efficiency would require too high a gas supply, so a disk is needed even in a wind-fed system. In this case, however, the disk is probably much smaller than in a Roche-lobe overflow system and the optical emission dominated by the supergiant. On the other hand, in a Roche-lobe overflow system, an extended, possibly re-irradiated accretion disk should contribute heavily in the UV and bands, producing strong emission lines. Thus, the two modes of mass supply are likely to be distinguishable by optical spectroscopy.
We now turn to discuss how our optical observations can be used to constrain the environment of NGC 1313 X-2. Figures 4 and 5 reveal that NGC 1313 X-2 is likely to be associated with an optical emission nebula, recognizable also in a Hα image taken by Pakull & Mirioni (2002). From the velocity (80 km s-1) and flux of Hβ, they derive an impressive mechanical energy of erg for the expanding ionized gas, and suggest that the nebula is inflated by a relativistic jet from NGC 1313 X-2. Our measured ratio of [SII]/Hα () is consistent with that expected from a shock-ionized supernova remnant, a stellar wind-shocked nebula or diffuse ionized gas (Matonick & Fesen, 1997). However, the inferred diameter and energy of the nebula are too large to be consistent with a single supernova event, unless it was produced by a hypernova similar to SN 1998bw (see e.g. Iwamoto et al. 1998). In fact, it could be the result of several explosion events (multiple supernova remnant) or be originated by the intense wind of hot stars, possibly the parent stellar association of NGC 1313 X-2. As discussed in the previous section, the nebula appears to have some internal structure: a comparatively brighter, fairly symmetric component west of the position of NGC 1313 X-2 and a weaker, slightly elongated one extending in the east direction. The brighter part of the nebula has [SII]/Hα=0.58, the weaker one has [SII]/Hα=0.44 and intense [OIII] emission. Different possibilities may explain the irregular appearance of the nebula. As suggested by Pakull & Mirioni (2002), the varying line intensity may be caused by reprocessed emission from the X-ray ionized interstellar medium where the physical conditions (in particular the density) vary on a scale pc. However, the nebular emission may also arise from two physically distict components: a wind-shocked nebula produced by a possible parent stellar association of NGC 1313 X-2 and a multiple supernova remnant. This hypothesis seems to be confirmed also by the marginal detection of (possibly extended) UV emission in an image of the XMM Optical Monitor (see Figure 6), in coincidence with the brighter component. Clearly, the weaker component may still be a jet-inflated nebula, as suggested by Pakull & Mirioni (2002). Finally, we note that, although NGC 1313 X-2 is somewhat hotter and much more luminous, the [OIII] signature in the eastern portion of the nebula is reminiscent of predictions for the radiation-limited nebulae around supersoft sources (Di Stefano, Paerels & Rappaport 1995; Chiang & Rappaport 1996).
It is interesting to note that object A, the possible association of which with NGC 1313 X-2 was discussed by Stocke et al. (1995), lies very close both to the Chandra error box and the point where the intensity of the nebular emission lines suddenly changes. The continuum spectrum of this object, obtained after subtracting off the emission line spectrum of the nebula in the adjacent regions, was compared to template stellar spectra (Pickles, 1998) and turns out to be in fair quantitative agreement with that of a G-M supergiant, but not with that of late-type dwarfs. This result is independent of reddening. The absolute magnitude of object A is , and the luminosity (assuming a bolometric correction appropriate for a K star). Object A may be a very massive () G-M supergiant of radius or a cluster in NGC 1313. The first interpretation would support the conclusion that the region in which NGC 1313 X-2 is located is an active star forming region, in which the initial mass function is top-heavy. On the other hand, the second possibility appears more likely because massive stars are extremely rare. However, the red color would indicate a rather evolved cluster that would be projected by chance on the active star forming environment in which NGC 1313 X-2 appears to be embedded.
A crucial question is how a binary system containing an intermediate mass BH may have formed (see e.g. van der Marel 2003). The BH progenitor must have been rather massive. This is consistent with the fact that NGC 1313 is likely to have lower than solar metallicity (; Zaritsky, Kennicutt & Huchra 1994) and hence mass loss was less intense. Such a massive BH may have formed through direct collapse without producing a supernova. In this way, if the system was born as a binary, it may have survived after the collapse of the primary. Although less likely, it is also possible that the companion might have been captured from a nearby stellar association. In this case, it is not possible to exclude that the BH may have formed from an early episode of star formation (population III).
It is worth noting that, although the large BH mass does not require that the emission is beamed, we cannot rule out that a moderate jet activity, producing radio emission (and possibly inflating the emission nebula), is present in NGC 1313 X-2 (see e.g. the case of an ULX in NGC 5408; Kaaret et al. 2003). However, presently available radio images of the field of NGC 1313 X-2 (Sydney University Molonglo Sky Survey at 843 MHz and Australia Telescope Array at GHz; Stocke et al. 1995) are not sufficiently deep to allow detection.
Optical spectroscopy of object C, narrow band imaging of the nebula, deep radio observations and an analysis of the short timescale X-ray variability are essential to better assess the physical properties of NGC 1313 X-2 and its environment. In particular, even a moderate resolution spectrum of object C will make it possible to detect any characteristic absorption and/or emission line, and then determine its properties and redshift. These observations will allow us to strengthen the identification of NGC 1313 X-2 with an intermediate mass BH and foster our understanding of ULXs.
References
- Bohlin et al. (1978) Bohlin, R.C., Savage, B.D., & Drake, J.F 1978, ApJ, 224, 132
- Bowers & Deeming (1984) Bowers, R.L., & Deeming, T. 1984, Astrophysics: Volume 1 – Stars (Jones and Bartlett Publishers, Inc.)
- Brusa et al. (2002) Brusa, M., Comastri, A., Daddi, E., Cimatti, A., Mignoli, M., & Pozzetti, L. 2002, ApJ, 581, L89
- Cagnoni et al. (2002) Cagnoni, I., et al. 2002, ApJ, 579, 148
- Cagnoni et al. (2003) Cagnoni, I., et al. 2003, ApJ, 582, 654
- Calzetti et al. (2000) Calzetti, D., et al. 2000, ApJ, 533, 682
- Chiang & Rappaport (1996) Chiang, E., & Rappaport, S. 1996, ApJ, 469, 255
- Colbert et al. (1995) Colbert, E.J.M., Petre, R., Schlegel, E.M., & Ryder, S.D. 1995, ApJ, 446, 177
- Colbert & Mushotzky (1999) Colbert, E.J.M. & Mushotzky, R.F. 1999, ApJ, 519, 89
- Colbert & Ptak (2002) Colbert, E.J.M., & Ptak, A.F. 2002, ApJS, 143, 25
- de Jong, van Paradijs & Augusteijn (1996) de Jong, J.A., van Paradijs, J., & Augusteijn, T. 1996, A&A, 314, 484
- Di Stefano, Paerels & Rappaport (1995) Di Stefano, R., Paerels, F., & Rappaport, S. 1995, ApJ, 450, 705
- Fabbiano & Trinchieri (1987) Fabbiano, G., & Trinchieri, G. 1987, ApJ, 315, 46
- Fabbiano (1989) Fabbiano, G. 1989, ARA&A, 27, 87
- Fabbiano et al. (2003) Fabbiano, G., et al. 2003, ApJ, 584, L5
- Fabbiano & White (2003) Fabbiano, G., & White, N.E. 2003, in Compact Stellar X-ray Sources, eds., W. Lewin & M. van der Klis, Cambridge University Press (astro-ph/0307077)
- Foschini et al. (2002a) Foschini, L., et al. 2002a, A&A, 392, 817
- Foschini et al. (2002b) Foschini, L., et al. 2002b, A&A, 396, 787
- Frank, King & Raine (1980) Frank, J., King, A.R., & Raine, D.J. 2002, Accretion Power in Astrophysics (Cambridge University Press)
- Gioia et al. (1990) Gioia, I.M., et al. 1990, ApJS, 72, 567
- Goad et al. (2002) Goad, M.R., Roberts, T.P., Knigge, C., & Lira, P. 2002, MNRAS, 335, L67
- Hambly, Irwin & MacGillivray (2001) Hambly, N.C., Irwin, M.J., & MacGillivray, H.T. 2001, MNRAS, 326, 1295
- Iwamoto et al. (1998) Iwamoto, K. et al. 1998, Nature, 395, 672
- Kaaret et al. (2001) Kaaret, P. et al. 2001, MNRAS, 321, L29
- Kaaret et al. (2003) Kaaret, P., Corbel, S., Prestwich, A.H., & Zezas, A. 2003, Science, 299, 365
- Kaplan, Kulkarni & van Kerkwijk (2003) Kaplan, D.L., Kulkarni, S.R., & van Kerkwijk, M.H. 2003, ApJ, 588, L33
- King et al. (2001) King, A.R., Davies, M.B., Ward, M.J., Fabbiano, G., & Elvis, M. 2001, ApJ, 552, L109
- Makishima et al. (2000) Makishima, K., et al. 2000, ApJ, 535, 632
- Masetti (1997) Masetti, N. 1997, PhD Thesis, unpublished (http://www.bo.iasf.cnr.it/m̃asetti/phdth.html)
- Matonick & Fesen (1997) Matonick, D.M., & Fesen, R.A. 1997, ApJS, 112, 49
- Miller et al. (1998) Miller, S., Schlegel, E.M., Petre, R., & Colbert, E. 1998, AJ, 116, 1657
- Miller et al. (2003) Miller, J.M., Fabbiano, G., Miller, M.C., & Fabian, A.C. 2003, ApJ, 585, L37
- Paczyński (1971) Paczyński, B. 1971, ARA&A, 9, 183
- Pakull & Mirioni (2002) Pakull, M.W., & Mirioni, L. 2002, in Proc. ESA Symp., New Visions of the X-ray Universe in the XMM-Newton and Chandra Era, eds. F. Jansen et al. (ESA SP-488) (astro-ph/0202488)
- Petre et al. (1994) Petre, R., et al. 1994, PASJ, 46, L115
- Pickles (1998) Pickles, A.J. 1998, PASP, 110, 863
- Roberts et al. (2001) Roberts, T.P., et al. 2001, MNRAS, 325, L7
- Ryder et al. (1993) Ryder, S. et al. 1993, ApJ, 416, 167
- Schlegel et al. (2000) Schlegel, E.M., Petre, R., Colbert, E.J.M., & Miller, S. 2000, AJ, 120, 2373
- Shimura & Takahara (1995) Shimura, T., & Takahara, F. 1995, ApJ, 445, 780
- Stocke et al. (1995) Stocke, J.T., et al. 1995, AJ, 109, 1199
- Tully (1988) Tully, R.B. 1988, Nearby Galaxies Catalog (Cambridge: Cambridge University Press)
- van der Marel (2003) van der Marel, R.P. 2003, Carnegie Observatories Astrophysics Series, Vol. 1: Coevolution of Black Holes and Galaxies, ed. L. C. Ho (Cambridge: Cambridge Univ. Press), astro-ph/0302101
- Wu et al. (2002) Wu, H., Xue, S.J., Xia, X.Y., Deng, Z.G., & Mao, S. 2002, ApJ, 576, 738
- Zampieri, Turolla & Szuszkiewicz (2001) Zampieri, L., Turolla, R., & Szuszkiewicz, E. 2001, MNRAS, 325, 1266
- Zaritsky, Kennicutt & Huchra (1994) Zaritsky, D., Kennicutt, R.C., & Huchra, J.P. 1994, ApJ, 420, 87
| Observatory/Instr. | Objecta | RA[J2000] | DEC[J2000] | R magnitude (Bessel-Cousins) | Ref. |
|---|---|---|---|---|---|
| ROSAT/HRI | NGC 1313 X-2 | 03 18 22.000.50 | -66 36 02.33.0 | – | Schlegel et al. (2000) |
| XMM/EPIC-MOS | NGC 1313 X-2 | 03 18 22.340.33 | -66 36 03.72.0 | – | Miller et al. (2003) |
| Chandra/ACIS-S | NGC 1313 X-2 | 03 18 22.180.12 | -66 36 03.30.7 | – | this work |
| ESO/3.6m | A | 03 18 21.970.05 | -66 36 06.50.3 | 19.80.2 | this work |
| ESO/3.6m | B | 03 18 21.560.05 | -66 36 00.90.3 | 20.70.2 | this work |
| ESO/3.6m | C | 03 18 22.340.05 | -66 36 03.70.3 | 21.60.2 | this work |
| ESO/3.6m | D | 03 18 20.960.05 | -66 36 03.70.3 | 17.80.2 | this work |
| Observatory/Instr. | Obs. Id. | Model | Parameters | (dof) | |||
|---|---|---|---|---|---|---|---|
| ( cm-2) | ( erg cm-2 s-1) | ( erg cm-2 s-1) | |||||
| ROSAT/PSPC | rp600045n00 | Power-law | 0.83 (20) | 1.4 | 2.6 | ||
| Blackbody | 1.01 (20) | 0.34 | 0.38 | ||||
| ROSAT/PSPC | rp600504n00 | Power-law | 1.43 (22) | 1.5 | 1.8 | ||
| Blackbody | 1.32 (22) | 0.37 | 0.44 | ||||
| ASCA/GIS+SIS | 60028000 | Power-law | 0.99 (171) | 1.3 | 3.2 | ||
| MCD | 0.89 (171) | 2.1 | 2.6 | ||||
| ASCA/GIS+SIS | 93010000 | Power-law | 1.28 (139) | 0.50 | 2.2 | ||
| MCD | 1.31 (139) | 0.86 | 1.0 | ||||
| XMM/EPIC-MOS+PN | 0106860101 | Power-law | 1.20 (249) | 2.1 | |||
| MCD | 2.29 (249) | 0.86 | |||||
| CompTTc | 1.11 (248) | 1.2 | |||||
| MCD+Power-law | 1.09 (247) | 2.4 | |||||
| MCD+Power-lawd | 1.07 (247) | 2.0 | |||||