2CESR, 9 av. du Colonnel Roche, 31028 Toulouse Cedex 4, France
X-ray He-like ions diagnostics : New Computations for Photoionized Plasmas: I. preliminary considerations
Using the new version of the photoionization code Titan designed for plane-parallel photoionized thick hot media, which is unprecedented from the point of view of line transfer, we have undertaken a systematic study of the influence of different parameters on the He-like and H-like emission of a medium photoionized by an X-ray source. We explain why in modelling the emitting medium it is important to solve in a self-consistent way the thermal and ionization equilibria and to take into account the interconnection between the different ions. We insist on the influence of the column density on the He-like ion emission, via stratification of ion species, temperature gradient, resonance trapping and continuum absorption, and we show that misleading conclusions can be deduced if it is neglected. In particular a given column density of an He-like ion can lead to a large range of total column densities and ionization parameters. We show also that there is a non-model-dependent relation between an ion column density and its corresponding temperature, and that the ion column density cannot exceed a maximum value for a given ionization parameter. We give the equivalent widths of the sum of the He-like triplets and the triplet intensity ratios and , for the most important He-like ions, for a range of density, column density, and ionization parameter, in the case of constant density media. We show in particular that the line intensities from a given ion can be accounted for, either by small values of both the column density and of the ionization parameter, or by large values of both quantities, and it is necessary to take into account several ions to disentangle these possibilities. We show also that a “pure recombination spectrum” almost never exists in a photoionized medium: either it is thin, and resonance lines are formed by radiative excitation, or it is thick, and free-bound absorption destroys the resonance photons as they undergo resonant diffusion. Consequently, the ratio is much smaller than the pure recombination ratio for a small value of the total column density, and it exceeds the recombination ratio for large values of the total column density and of the ionization parameter.
Key Words.:
plasma : X-ray diagnostics – galaxies : X-rays – galaxies : active1 Introduction
With the great sensitivity and resolution of the new generation of X-ray missions XMM-Newton and Chandra, detailed spectra of several types of objects have been obtained in the soft X-ray range, showing tens of emission lines which can be used as diagnostics of the physical state of the emitting regions. For instance it is now possible to separate the He-like ions lines of the complex in many objects. These lines are used to determine the electronic temperature and the density of the observed region.
Gabriel & Jordan (1969, 1972, 1973) showed that, in collisional plasmas, the resonance, intercombination and forbidden lines ratios of He-like ions have very interesting properties. The ratio, called , of the forbidden line () and the intercombination lines and () :
| (1) |
is sensitive to the electronic density . The ratio of the forbidden plus intercombination lines over the resonant line () :
| (2) |
is sensitive to the electronic temperature.
The and ratios have therefore been extensively used to determine electron densities and temperatures of hot collisional plasmas. Recently, theoretical calculations have extended these ratios to photoionized and hybrid plasmas for extragalactic objects like the warm absorbers which are supposed to give rise to the O VII and O VIII edges in Active Galactic Nuclei (AGNs) (Porquet & Dubau 2000 for hybrid and photoionized plasmas, and Bautista & Kallman 2001 for collisional and photoionized plasmas). In these papers however, “photoionized conditions” mean only that the spectrum is due to recombination, radiative cascades and collisional excitation, but photoionization and photoexcitation are not taken into account. Porquet et al. (2001) have introduced a term of photoexcitation in collisional plasmas, for the study of the spectra of late-type dominated coronae and O-B stars. The radiation field was a diluted photospheric black body of a few 10000K, so it had an influence only on the visible and UV transitions, but not on the resonance line excitation.
If the X-ray emitting plasma is photoionized, the irradiating continuum necessarily excite the resonance and the subordinate permitted lines. The importance of photoexcitation on the population levels and on the line ratios has also started to be taken into account. This was stressed for the first time by Sako et al. (2000) in their analysis of the spectrum of the Seyfert 2 galaxy Mrk 3. Kinkhabwala et al. (2002) showed that it can account for the observed ratios of NVI and OVII lines in the spectrum of the Seyfert 2 galaxy NGC 1068, where the observed ratio is larger and the ratio is smaller than in a pure recombination case.
However, even these last “photoionized” computations are not completely self-consistent, as the temperature is a free parameter and the thermal equilibrium is not solved. Kinkhabwala et al. (2002) assumed a multi-zone model (with a geometry adapted to the case of Seyfert 2 galaxies) where each ion is present in a different layer, and where the temperature is set a priori, as determined by the observed width of the corresponding radiative recombination continuum (RRC). The ion column densities are determined by fitting the X-ray spectrum (Ogle et al. 2003 use the same method to fit the X-ray observations of NGC 1068). The code PHOTO of Kinkhabwala, which is now implemented in the XSPEC package, takes well into account the geometry of the emitting medium, but use different approximations which are not valid for a moderately thick medium, mainly: photoelectric absorption of only the ion under study is taken into account, the medium is optically thin to the emitted photons, the thermal equilibrium is not consistently computed with the ionization equilibrium, and a very approximate line escape probability is used.
Finally, in all computations made with photoionized codes, even the most sophisticated ones like Cloudy (Ferland et al. 1998) or XSTAR (Kallman & Krolik 1995, Kallman & Bautista 2001), the transfer of the lines is not performed, or it is performed with an “escape probability” approximation. The transfer of the continuum also is generally done through an “outward only” approximation. These approximations are not valid for a thick medium, as shown by comparing the results of these approximations with full line transfer performed with our code Titan (see Dumont et al. 2000, Dumont et al. 2003). This precludes the use of these codes for column densities larger than 1023 cm-2. We will see that neglecting the possibility of large column densities can lead to misleading interpretations of the observations.
The medium observed in emission or in absorption in the X-ray range span a large range of physical conditions:
-
•
In Seyfert 1, a few lines and edges broadened by large Doppler motions are observed in emission over an intense continuum: resonance lines of OVII (the different components of the triplet cannot be resolved) and OVIII, the fluorescent FeK line, and photoionization edges of the same ions. All these features are due to “reflection” in the atmosphere of the accretion disc irradiated by the X-ray continuum (see for instance Nayakshin et al. 2000, Ballantyne et al. 2001, Różańska et al. 2002). This reflected spectrum is formed in a few Thomson thicknesses below the surface, i.e. up to a column density of about 1025 cm-2. Much narrower spectral features appear in absorption against the underlying X-ray continuum. They are due to a medium photoionized by the central X-ray continuum and located on its line of sight, called the Warm Absorber (WA). The WA also emits a few lines and continua from H-like and He-like ions, principally OVII and OVIII, which are difficult to detect. They can be observed as P Cygni profiles when the S/N ratio is high, like in NGC 3783 (Kaspi et al. 2002). Though the location and the density of the WA is controversial, it is clearly a relatively dense medium, with a density larger than 107 cm-3, located close to the black hole, at a distance of the order of that of the Broad Line Region, and having a column density of the order of 1021-23 cm-2. There are even suggestions that the warm absorber could be located closer to the black hole, with a larger column density (1024 cm-2, see Murray & Chiang 1995, Green & Mathur 1996), and is denser, since one should preserve the value of the ionization parameter which determines the ionization state. Porquet et al. (2000) argue also that the density should be larger than 109 cm-3 to avoid the emission of too strong forbidden optical coronal lines of FeX and FeXIV which are not observed.
-
•
Splendid X-ray spectra of a few Seyfert 2 galaxies have been obtained recently with Chandra and XMM-Newton (Ogle et al. 2003, Sako et al. 2000, Kinkhabwala et al. 2002). They are most probably produced by the reflecting medium invoked in the Unified Scheme of Seyfert 1/Seyfert 2 (Antonucci & Miller 1985). This medium is identified with the external part of the WA, but it is seen in emission, as the intense central continuum in Seyfert 2 is hidden to our view by an obscuring torus, according to the Unified Scheme. This medium is also photoionized by the central continuum, but it is located further away than the WA, as the lines are relatively narrow (between the broad and the narrow line widths). Consequently the density should be smaller, probably not larger than 107 cm-3.
-
•
There are other types of “photoionized” objects where high resolution X-ray spectra showing the He-like and H-like lines have been observed with XMM-Newton and Chandra, allowing a study of the physical conditions in the emission region: X-ray binaries (Kallman et al. 2003, Jimenez-Garate et al. 2002, Schulz & Brandt, 2002) and cataclysmic variables (Mukai et al. 2003). The emissive medium is either an accretion column or simply the accretion disc atmosphere. The density is large, of the order of 1011 cm-3, and the column density can reach 1023 cm-2, though the geometry is clearly quite complex.
We have therefore decided to build a grid of models encompassing all those photoionized cases where X-ray lines are observed. We give here some preliminary results. Our model atom is still not very elaborate (see below), so the precision in the line fluxes and line ratios is only of the order of 50, but they can be used at least to get a hint of the physical parameters corresponding to the emission regions, and of the trends of the spectrum when these parameters vary. We insist, in particular, on the influence of the column density on the He-like ion emission, as our calculations are reliable using our line transfer method for large column densities, which were not properly taken into account previously, when they were greater than 1022 cm-2.
2 The computational method
2.1 The photoionization-transfer code
In this work we use our code Titan specially designed for an optically thick warm or hot medium. Titan is a photoionization stationary code first described in Dumont et al. (2000). The atomic data have recently been improved (Coupé 2002). It was used by Różańska et al. (2003) to fit the spectrum of the Warm Absorber of Ton S180 with a slab of constant pressure. In the present paper, we use another version of Titan implemented very recently (Dumont et al. 2003) where the line and the continuum transfer is solved with the Accelerated Lambda Iteration (ALI) method (see for instance the review of Hubeny 2001). This powerful method ensures that even the most optically thick lines are accurately computed. This is a big advantage with respect to the other photoionization codes, where the transfer of the lines (and in some cases also the transfer of the continuum) is replaced by an integral method called the “escape probability approximation”. Dumont et al. (2003) have indeed shown that this approximation leads to inaccuracies of the computed line fluxes which can reach one order of magnitude, in the case of an optically thick medium, in particular for intense lines. In our computation, all line fluxes are computed with an accuracy better than .
A plane parallel slab of gas is irradiated by an incident spectrum, whose frequency-integrated flux is equal to . We call “ionization parameter” erg cm s-1, where is the hydrogen number density. Some authors prefer to use an ionization parameter integrated in the X-ray range or from 1 Rydberg to infinity.
The gas composition includes the 10 most abundant elements (H, He, C, N, O, Ne, Mg, Si, S, Fe) and all their ion species, i.e. 102 ions. H-like, He-like, Li-like, O IV and O V include a multi-level description up to for H-like and Li-like ions, for He-like ions and for O IV and O V, where is the principal quantum number, which ensures a correct computation of line losses in the zones where He-like ions are present. Interlocking between excited levels is included. Other ions are treated more roughly.
Titan includes all relevant physical processes from each level: photoionization and radiative and dielectronic recombination, ionization by high energy photons, fluorescence and Auger processes, charge exchanges, collisional ionization and 3-body recombination, radiative and collisional excitation/deexcitation. All induced processes are also included. The populations of each level are computed solving the set of ionization equations coupled with the set of statistical equations describing the excitation equilibrium, taking into account radiative and collisional ionizations from all levels and recombinations onto all levels, radiative and collisional excitations and deexcitations for all transitions.
Titan solves the ionization equilibrium of all the ion species of each element, the thermal equilibrium, the statistical equilibrium of all the levels of each ion, and the transfer of the lines and of the continuum. It gives as output the ionization and temperature structures, and the reflected and outward spectra. In particular the energy balance is achieved both locally (which leads to the value of the equilibrium temperature as a function of the position) with a precision better than 0.01, and globally (Titan checks that the integrated flux entering the slab is equal to that leaving the slab from both sides with a precision better than ). It was shown in Dumont et al. (2003) that such a global equilibrium cannot be achieved with an escape probability approximation with a precision better than about if the Thomson thickness of the slab is of the order of unity, and this has a strong impact on the line spectrum.
2.2 The He-like atom model
The He-like atom has been extensively described in the literature (Gabriel & Jordan 1969; Blumenthal et al. 1972, Mewe & Schrijver 1978, Pradhan et al. 1981, Pradhan & Shull 1981; Pradhan 1982, 1985, Porquet & Dubau 2000, Bautista & Kallman 2001). Our present model for He-like ions is made up of all terms for , and 4 super-levels gathering the singlet and triplet levels for n=3 and 4. Recombinations on the upper levels are taken into account. Satellite lines are not included. We are aware that these 11 levels plus a continuum are not sufficient to get a very accurate description of the atom. However we have checked that in the case of a completely thin medium we get the correct ratios and within an accuracy of , for a pure recombination spectrum as well as for pure collisional cases. In the future we intend to implement a larger number of levels and to add doubly excited states.
The wavelengths of the lines are taken from the compilation of the National Institute of Standards and Technology. We use the transition probabilities computed or collected by Porquet & Dubau (2000). The TOPbase data provides the photoionization cross sections (Cunto et al. 1993). The radiative recombination rate coefficients are obtained by means of the Milne relation, removing the resonances by interpolation between points on opposite sides of the resonances, while total radiative recombination rate coefficients are from Verner & Ferland (1996). The dielectronic rate coefficients are from Pequignot et al., (private communication 1986). We adopt the collisional data of Zhang & Sampson (1987), with the data for from Porquet (private communication). We use electron impact ionizations rates from Arnaud & Raymond (1992) and private communication from Arnaud. Three-body recombination rates are obtained by means of detailed balance.
3 Results: the thermal and ionization structure
We have run a series of models with a density varying from 107 cm-3 to 1012 cm-3, a range of column densities from 1018 cm-2 to 3 1025 cm-2, and a range of ionization parameters from 10 to 3000. We assume cosmic abundances with respect to hydrogen (Allen 1973): He: 0.085; C: 3.3 10-4; N: 9.1 10-5; O: 6.6 10-4; Ne: 8.3 10-5; Mg: 2.5 10-5; Si: 3.3 10-5; S: 1.6 10-4; Fe: 3.2 10-5.
The incident spectrum is a power law, , extending from 0.1 eV to 100 keV (we will call it the “standard continuum”). It is not a very good representation of the continuum in AGN, so we have also made a few runs with a more realistic continuum: it is a power law extending from 13.6 eV to 100 keV (we call it the “AGN continuum”).
Actually these models do not take into account all possible situations.
-
•
The element abundances have an obvious influence on the emitted spectrum, since the intensities of optically thin lines is proportional to the abundance and those of optically thick lines (, where is the optical thickness at the line center, and is the damping factor) are proportional to the square root of the abundance.
-
•
The spectral distribution of the incident continuum also has an influence on the temperature and on the ionization state. For instance, at large densities ( cm-3), free-free heating becomes important, owing to the extension of our continuum in the infrared range. More important, a steeper or flatter continuum in the soft X-ray range would induce a different stratification in ionization. It is interesting thus to rely on the X-ray ionization parameter, because the ionization potentials of the species of interest for us are in the range 400 eV to 3 keV. If we define as given by the integration of the flux above 1 keV, one finds that with our standard continuum. For the AGN continuum, one gets for the same value of the flux at 1 keV. Since in the following we want to compare the results obtained with the standard continuum to those obtained with the AGN continuum, we will call this ionization parameter “equivalent ”, such as , for the AGN continuum.
-
•
We have chosen to deal with a constant density inside the slab, while a medium with a constant pressure would lead to a different ionization and thermal structure (in particular smaller column densities of highly ionized species, see Dumont et al. 2002).
-
•
Finally we do not take into account the possible existence of microturbulence, considering only thermal broadening. If the emitting medium is dilute and continuous, one should indeed consider the possibility of a large velocity gradient, like in a wind. The intrinsic width of the lines would then be larger, and their optical thicknesses would be smaller. It would have an influence on relatively thin models, where radiative excitation of the lines is still important (cf. below), because there is more available continuum radiation. It would also have an influence on the escape of resonance lines in the case of thick models. Of course, if the medium is clumpy and made of clouds with large velocities with respect to each other, or with a velocity gradient, this “macroturbulence” has to be taken into account in the spectrum, but does not intervene in the line transfer (like in the Broad Line Region of AGN).
The influence of all these parameters will be studied in a subsequent paper.
To understand the results on the intensity ratios, it is first necessary to study the ionization and thermal state of the emitting medium.
One should realize that a photoionized medium is not uniform when it is optically thick for the absorption of the soft X-ray continuum. The temperature decreases and the medium becomes less ionized towards the non-illuminated side, as the incident continuum is more absorbed. A thick slab is thus divided into a “hot skin” below the surface, where the temperature is almost constant and the elements are highly ionized, an “intermediate” zone where the temperature decreases by about one order of magnitude and the elements are less ionized, and a “cold” zone, where the elements are in low ionization states. If the column density of the slab is not large enough, it will be made only of the hot skin, or possibly of the hot skin and a fraction of the intermediate zone. The thickness of the hot skin and the temperature at the surface increase with the value of the ionization parameter. The decrease of the temperature through the slab is large for large values of the ionization parameter. It is therefore not possible to define a unique temperature, even for a given ion species. Moreover, if lines are formed by recombination, the abundance of the upper ion giving rise to the lines can vary strongly in the region where the ion corresponding to the transition is present.
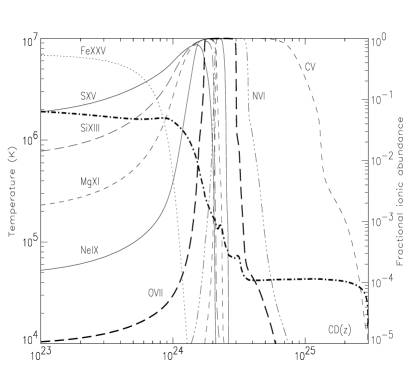
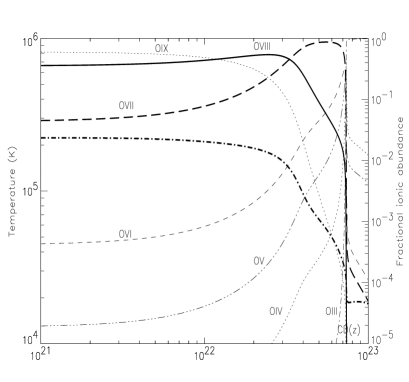
To illustrate these effects which are important for the following discussion, Figs. 1 and 2 display the temperature and the fractional ion abundances versus the column density computed from the surface to the local point, , for two models: Model 1 has a column density of 3 1025 cm-2, a density of 1012 cm-3, an ionization parameter of , and is appropriate for the irradiated atmosphere of an accretion disc in an AGN; Model 2 has a column density of 1023 cm-2, a density of 107 cm-3, an ionization parameter of , it is appropriate for the Warm Absorber. The figures at the top show the fractional abundances of the oxygen ions, the central figures show the fractional abundances of the He-like ions, and the bottom ones show the fractional abundances of the H-like ions.
Let us examine first Fig. 1 corresponding to Model 1. The column density of the hot skin is equal to 1024 cm-2 and its temperature is 2 K. All the “light” elements (C, N, O) are completely ionized, and heavier elements are in the form of H-like (Si, S) or He-like species (Fe). The column density of the intermediate zone is equal to 2 1024 cm-2, and the temperature decreases down to 4 K. Oxygen is in the form of OVIII and OVII, and in particular in the region where OVII dominates, the temperature varies from a few K to a few K. It is worth noticing that the column density of the OVII region is very large in this model (about 1021 cm-2), but the region giving rise to recombination lines (therefore to the OVII triplet) is much smaller, as OVII and OVIII do not coincide in position. The OVII spectrum is therefore emitted by the intermediate zone where the temperature varies strongly. The rest of the slab is cold and contributes only to the UV emission.
Fig. 2 corresponding to Model 2 shows that, owing to the relatively low value of the ionization parameter, the hot skin is restricted to a column density of about 1022 cm-2, and its temperature is relatively low (3.5 K). The intermediate zone is not complete and the temperature decreases from 3.5 K at the surface to K at the back. OVIII ions dominate in a fraction of this zone, but OVII is abundant only near the back where the temperature is lower. Again the OVII spectrum is formed in this inhomogeneous zone. There is no cold zone at all.
From these examples one can understand that the emission of a thick medium is not easily described by a homogeneous model. For the formation of the He-like triplet, the column density which matters is that of the H-like ions, while it is the temperature of the He-like zone which determines the collisional excitations of the transitions, important for the ratio. One also sees that there will be a “saturation” of the line fluxes due to the fact that the size of the emission regions is limited according to the value of the ionization parameter. One can guess thus that the same conditions for a given ion (same column density, same temperature) could be obtained with different ionization parameters and column densities.
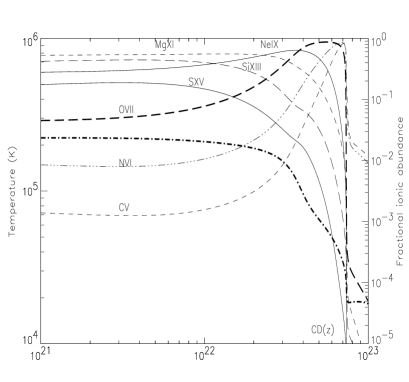
The spectral distribution of the incident continuum must also be taken into account. To illustrate its influence, Fig. 3 displays the same curves as Figs. 1 and 2, for a column density 1023 cm-2, a density 107 cm-3, but for the AGN continuum with an equivalent ionization parameter . They can be compared to Model 2. Note also that the temperature is lower in the case of the AGN continuum than in the case of the standard continuum. This will be translated into differences in the line intensities as we will see below.
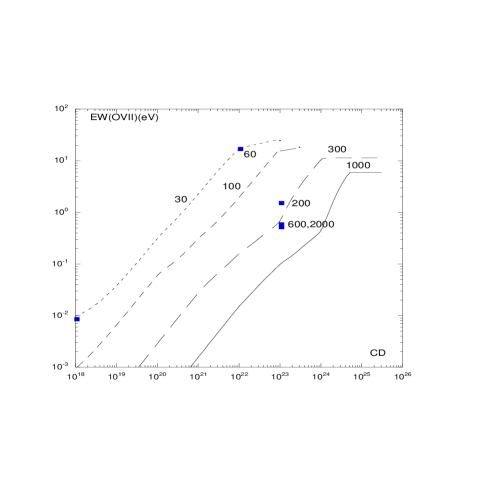
To complete the information, Fig. 4 displays the ion column densities of a few He-like and H-like species, , for slabs of different total column densities and for different values of the ionization parameter. They are independent of the density in the range 107 to 1012 cm-3 because collisional processes are negligible for ionization and recombination. The long dashed line marks the ion column density of 1017 cm-2. Several important conclusions can be drawn from these curves.
All ion column densities saturate at large values of 111This is actually not obvious in the figure for light elements and small ionization parameters. Indeed when is small and the column density is large, the intermediate zone is dominated by weakly ionized species (CII, OII, etc…) and our code Titan does not converge correctly, owing to the oversimplified description of these ions. This is why the column densities of CV, CVI and OVII, do not display the saturation for and 30, though , and cannot exceed those shown on the figure.. As explained above, it is due to the fact that the column density of the hot and intermediate zones, and consequently also the column density of the ion species, are determined and limited by the value of . For the column density of the intermediate zone is small and for instance saturates at a few cm-2. This result is important, as it can give an insight on the ionization parameter. If one finds from the observation of emission lines that is larger than 1020 cm-2, it means that is larger than 300.
Another striking result is the rapid increase of and for large values of and of : they can reach values as large as 1021 cm-2, contrary to heavier He-like species. This behaviour can be understood when considering Figs. 1, 2, and 3. For a given , the region where a given ion species dominates is located at a specific position inside the slab. When the column density is small, the ion is not dominant, and is approximately proportional to . When increases, it reaches the position where the ion becomes dominant, so increases more rapidly. stops increasing when becomes larger and the element becomes less ionized.
We see also that it is possible to get the same value of for a large range of values of the total column density and of the ionization parameter. For instance cm-2 can be obtained with cm-2 and , or with cm-2 and .
One can ask whether these results depend or not on the ionizing spectrum. Fig. 4 shows a model computed with the AGN continuum and an equivalent ionization parameter (the diamond on the figure). We see that the result does not differ strongly from that obtained with the standard continuum, but of course a more extensive study is required to be obtain a firm conclusion. If these curves are indeed almost independent of the ionizing spectrum, they would help to determine the ionization parameter in the Warm Absorber, where the column densities of the ion species are measured through a curve-of-growth analysis.
For each ion, the temperature can be measured directly through the shape of the corresponding radiative recombination continuum (RRC), which is expected to vary with the frequency as (cf. Kinkhabwala et al. 2002). Note again that there is some ambiguity here for an inhomogeneous medium. First the measurement concerns the H-like zone, while the relevant temperature is that of the He-like zone. Second, in the case of very thick models (the accretion disc atmosphere for instance) the shape of the RRC is no longer a pure exponential, owing to photon reabsorption.
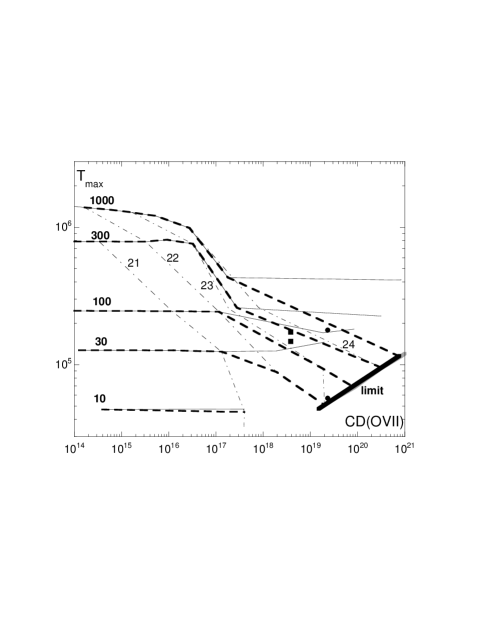
It is interesting to compare these observations with the temperature of the He-like and of the H-like zones. As an example, Fig. 5 displays the maximum temperatures of the regions where OVII and OVIII are dominant, versus the OVII column density , for models of various column densities, including a few with a non-standard incident continuum. The solid lines correspond to constant values of (thin line for OVIII, thick dashed line for OVII), and the thin dot-dashed lines to constant values of . The results are again almost independent of the density in the range 107 to 1012 cm-3 because the energy losses are dominated by recombination lines and continua for which collisional processes are negligible. Note that the two points in the middle of the figure correspond to the AGN continuum, for cm-2 and = 200. They are located close to the values found with the standard continuum for the same parameters, owing to the strong connection between the ionization and the thermal equilibrium. Thus the (OVII) diagram is almost model-independent.
Several conclusions can be drawn from this figure. For high values of , (OVII) and (OVIII) differ by a large factor. For a given total column density, (OVII) decreases regularly with increasing ion column density, and for a given ion column density, it decreases with . (OVIII) and (OVII) are of the order of 106K only for high values of and smaller than 1018 cm-2. (OVII) is smaller than 105K for small values of , and consequently for small values of the ion column density, ( cm-2). This behaviour can be understood with the help of Figs. 1 and 2.
4 Results: the spectrum
4.1 Total line intensities
It is important to know which models may lead to detectable line emissions. In this aim we have computed the equivalent widths, EWs, of the sum of the triplet He-lines with respect to the incident continuum. It is a good measure of the EWs when the continuum is seen directly because the contribution of the slab itself is negligible except for very thick slabs222These EWs correspond to a non-radial view of the objects.. It is obviously an underestimation in the case of Seyfert 2 with a hidden source of continuum. For instance these EWs should be multiplied by a factor 100 if the hidden continuum is reflected by a medium with a Thomson thickness of 0.01 like in NGC 1068. A line can be detected when its EW is larger than 0.1 eV.
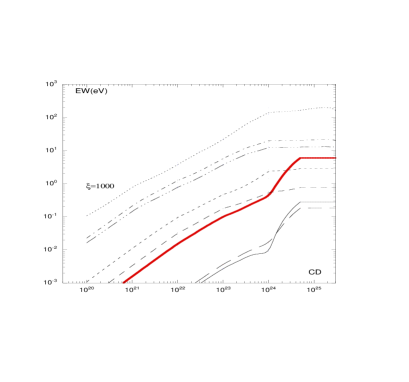
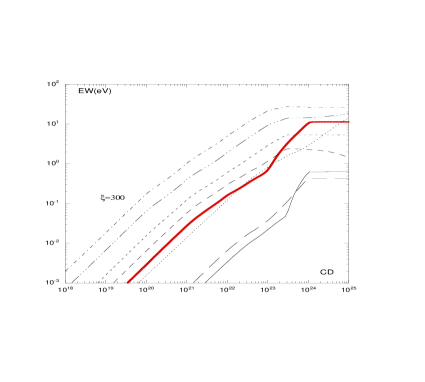
Figs. 6 and 7 display these EWs for all the He-like species and for several values of the ionization parameter as a function of the column density of the slab, for the standard continuum. Again they are almost independent of the density (because we consider the sum of the triplet terms and not the different components). As expected, the light species with the lowest ionization potential (CV, NVI, OVII) are the most intense for the smallest , and on the contrary FeXXV is the most intense line for the largest and it disappears for .
All EWs saturate at large column densities. This is easy to understand. These lines are due to recombination, and they saturate because the number of recombinations does not increase above a given column density, if the H-like ions are completely recombined.
For clarity, only one result for the AGN continuum is shown on Fig. 7, but it is enough to see that the EWs of this model are quite different from those of the standard continuum. So these curves cannot be considered as universal ones, contrary to (OVII) diagram.
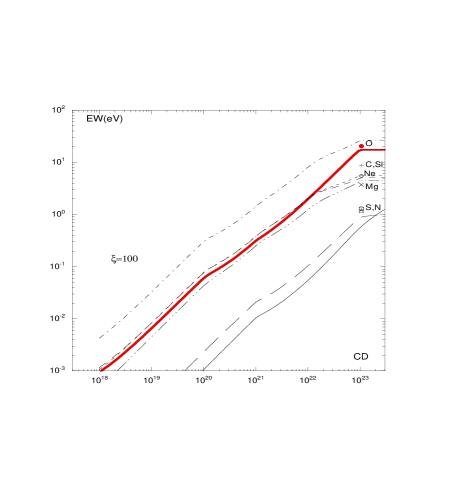
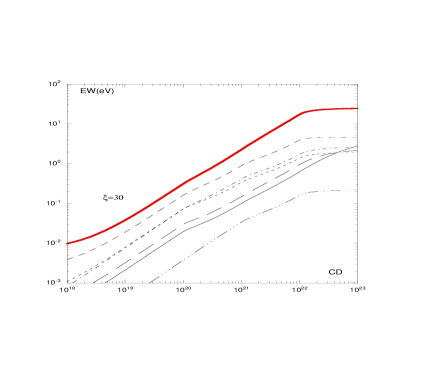
Fig. 8 recapitulates the EWs of the OVII triplet versus the column density for all models including a few with the AGN continuum. The saturation effect is visible for all ionization parameters, and we see that the EW of the OVII triplet cannot exceed 25 eV for the standard continuum (this also seems to be the case for the AGN continuum, but we need more models to confirm this). This is an important result, as it indicates that a larger observed OVII would imply a different kind of model (for instance, non-stationary), or a partial extinction of the continuum. Note that the same EW can be obtained with a small and a small , or with a large and a large . It is thus obvious that from the measure of the CV-NVI-OVII triplets only, it is not possible to determine the values of the column density and of the ionization parameter, even if the temperature of the emitting region can be measured. A detailed study of the whole spectrum, including lines of heavier elements, is clearly necessary to get the physical parameters of the emissive medium.
4.2 The G and R ratios
Fig. 9 displays the ratio for CV, OVII, SiXIII, and FeXXV versus the column density , for different values of the ionization parameter, and for the standard continuum. One model corresponding to the AGN continuum is also shown, for , and we see that it fits relatively well the curves obtained for the standard continuum.
This figure shows the strong dependency of the G-ratio on the column density, for a given ionization parameter. This is because the resonance line decreases with (and therefore increases), due to the decrease of the incident radiative excitation. For a very large column density, the value of reaches a constant value due to the limit of the ion column density (see Fig.4).
Note also that at large values of the column density, another process occurs, namely photon destruction, which is more important for resonance lines than for forbidden lines due to resonant scattering. This destruction is mainly due to photoionization of ions of lower ionization energy by the line photons. Correct values of the ratio cannot be computed without taking into account these interactions with other ions. It is not properly taken into account by escape probability approximations (cf. Dumont et al. 2003).
The figure also shows that the dependency of on the ionization parameter. This behaviour is easy to explain. If we consider light elements, we know (Fig. 4) that for a given column density, (CV) and (OVII) decrease with increasing until they reach saturation, because the emission line region is pushed towards the back of the slab. Consequently radiative excitations of the resonance line increase, and the ratio decreases. On the contrary, (FeXXV) increases with , inducing the decrease of .
An important point is worth noticing. The ratio is almost never equal to the recombination value ( for OVII for instance). At high column densities, we have seen that is larger than the recombination value, owing to the influence of the destruction mechanism on resonance lines. At small column densities, is much smaller than the recombination value (owing to the influence of radiative excitations on the line, as explained above). tends to a constant value at small values of , because the intensities of , and are proportional to the rate of photoionization, while is proportional to the rate of radiative excitation, both being proportional to the incident flux, when it is not absorbed. We see that this value is not reached at cm-2 for low values of , because the optical thickness at the line center is still higher than unity, so the rate of radiative excitations is smaller than at the surface.
Actually, an object like NGC 1068 where the (OVII) ratio is of the order of 7 (cf. Kinkhabwala et al. 2002) can be explained as well with and cm-2, as with and cm-2. The consideration of other spectral features due to other ions is required to disantangle these possibilities.
Fig. 10 displays the ratios for OVII and SiXIII as a function of the ionization parameter, for two values of the column density, and for a density cm-3. As expected, the ratios are almost independent of the column density and of the ionization parameter, as they are not affected by radiative excitations. Fig. 11 also displays the ratios of OVII and FeXXV as a function of the density, for two values of the column density and of the ionization parameter, for the standard continuum. It confirms the well-known result that decreases with an increasing density, as a consequence of collisional excitations of the transition. Note that the effect does not appear in the FeXXV diagram, as the critical density for this ion is larger than our limit cm-3.
Finally, all this discussion is illustrated in Figs. 12 and 13 which show the spectra of the OVII and SiXIII triplets for several values of the column density and of the ionization parameter. The lines are given for a spectral resolution of . The figures show the influence of an increasing column density at a given ionization parameter (left panels), and the influence of an increasing ionization parameter at a given column density (right panels).
4.3 The whole spectrum
As mentioned in the introduction, several types of objects are now observed with a great spectral resolution from 200 eV to 1 keV by Chandra and XMM-Newton. For instance, a pure reflected spectrum is observed in Seyfert 2 galaxies. It is thus interesting to give the reflected spectrum in this energy range as an illustration, for a few values of the column density and of the ionization parameter. A grid of such spectra will be used in a future paper in a study of NGC 1068 and Mrk 3.
These spectra are displayed in Fig. 14, convolved with a gaussian profile having a FWHM equal to 1500 km/sec. Note that the fluxes are given in , which is equivalent to in photon number per unit of . These spectra can thus be directly compared with the published spectra (see Kimkhabala et al. 2002 for instance).
The three figures at the top display the spectra of models computed with the AGN continuum, for a given large value of the column density ( cm-2), and for large values of the ionization parameter. They show for instance that the relative intensities of the lines from different ions vary with the ionization parameter, as well as the relative intensities of the triplet lines from a given He-like ion. The OVIII L line is the most intense.
The two figures at the bottom display the spectra for models computed with the standard continuum, for low values of the column density and of the ionization parameter (respectively cm-2 and , cm-2 and ). The spectra are dominated by the OVII triplet, whose relative intensities are the same for both cases, while the relative intensities of the other features vary (in particular note the strong CV RRC and the very weak OVIII L line in the bottom spectrum).
If there are several regions with different values of and of contributing to the spectrum, it is thus necessary to sum the complete spectra emitted by each region, to fit the whole observed spectrum. It is in particular clear that the different ions cannot be considered independently, as each emission region provides lines from several ions.
5 Conclusion
Using our new version of the photoionization code Titan which is unique in treating the full line transfer, we have computed the line intensities emitted by an X-ray photoionized plasma. In particular, it was shown in Dumont et al. (2003) that much smaller values of the X-ray line intensities are obtained for resonant lines than with the other photoionization codes where the line transfer is replaced by the escape probability approximation. We focused on the He-like emission, for a range of ionization parameters and column densities. The results of this study are:
-
•
The column density of a given ion species increases with the total column density of the medium until it reaches a limiting value depending on the ionization parameter.
-
•
In the range of ionization parameters considered here ( varying from 5 to 1000), the column density of light He-like ions (CV-NVI-OVII) decreases with increasing ionization parameter for a given value of the column density, while the opposite is the case for FeXXV.
-
•
It is difficult to define a unique temperature for the line emitting region. Indeed the temperature varies accross the region emitting He-like lines, and it differs from that of the H-like region, for ion column densities larger than a few cm-2.
-
•
For a given ionization parameter, the maximum temperature of the OVII emitting region decreases with the OVII column density when it is larger than a few cm-2, and the relation seems to be model-independent. So this is a rough way to determine the ionization parameter in the Warm Absorber of AGN, if (OVII) and (OVII) are known.
-
•
The equivalent widths (computed assuming that the continuum is seen directly, when this is not the case they have to be divided by the Thomson thickness of the reflecting medium) of the sum of the He-like triplet increase with column density until they reach a limiting value depending on the ionization parameter. We find for instance that the highest value reached by EW(OVII triplet) is 25eV. A larger observed OVII would imply different models (for instance, non-stationary), or a partial extinction of the continuum.
-
•
The ratios of the He-triplets are almost never equal to the pure recombination value. For low values of the column density, the ratio is smaller, owing to radiative excitation of the resonance line, and for high values of the column density it is larger, owing to photon destruction during the process of resonant scattering.
-
•
The same EWs and the same ratios can be obtained with a small ionization parameter and a small column density, or with a large ionization parameter and a large column density. For instance the observed (OVII) ratio in NGC 1068 can be explained with and cm-2, or with and cm-2.
To summarize, our study has shown that in modelling X-ray spectra one cannot dispense with a treatment including all ion species, a full transfer of the continuum and, in the case of a relatively thick medium, also of the lines. This is true even if there are several regions with different physical parameters contributing to the spectrum (as for instance in the case of an extended diluted medium with a variation of the dilution factor of the incident flux). In particular the different ions cannot be considered independently, as each emission region provides lines from several other ions.
The present paper presents only the qualitative behaviour of the spectra, as the errors due to the use of the simplified atomic model for He-like ions can reach 50 (which, incidentally, is smaller than the errors obtained when using the escape probability approximation for a column density of cm-2 or larger, cf. Dumont et al. 2003, and in preparation). Moreover, we have not discussed in detail the influence of the spectral distribution of the ionizing continuum, which is important, nor that of turbulent velocity, and the was restricted to the study of a constant-density medium. Forthcoming papers will be devoted to building a grid of X-ray spectra taking into account these various possibilities, using a more sophisticated He-like model-atom (restricted here to 11 levels plus a continuum), and to apply the results to a few well observed X-ray emitting sources.


Acknowledgements.
We deeply aknowledge Franck Delahaye for providing us some collisional data for the OVII ion and Marie-Christine Artru for many enlightning discussions on atomic data.References
- (1) Allen, C.W., 1973, “Astrophysical quantities”, University of London, The Athlone Press
- Antonucci & Miller (1985) Antonucci, R. R. J. & Miller, J. S. 1985, ApJ, 297, 621
- (3) Arnaud, M., & Raymond, J., 1992, ApJ, 398,394
- Ballantyne, Ross, & Fabian (2001) Ballantyne, D. R., Ross, R. R., & Fabian, A. C. 2001, MNRAS, 327, 10
- (5) Bautista, M.A., & Kallman, T.R., 2000, ApJ, 544, 581
- Blumenthal, Drake, & Tucker (1972) Blumenthal, G. R., Drake, G. W. F., & Tucker, W. H. 1972, ApJ, 172, 205
- (7) Coupé, S., PhD Thesis, Dec. 2002, University of Lyon (France)
- (8) Cunto W., Mendoza C., Ochsenbein F. & Zeippen C.J. 1993, A&A, 275, L5
- (9) Dumont, A.-M., Abrassart, A., Collin, S. 2000, A&A, 357, 823
- Dumont, Czerny, Collin, & Zycki (2002) Dumont, A.-M., Czerny, B., Collin, S., & Zycki, P. T. 2002, A&A, 387, 63
- (11) Dumont, A.-M., Collin, S., Paletou, F., Coupé, S., Godet, O., Pelat, D., 2003, A&A, 407, 13
- (12) Ferland, G.J., Korista, T., Verner, D.A., Ferguson, J.W., Kingdom, J.B., Verner, E.M. 1998, PASP, 110, 761
- (13) Gabriel, A.H., Jordan, C. 1969, MNRAS, 145, 241
- (14) Gabriel, A.H., Jordan C. 1972, in “Case studies in atomic collision physics”, vol. 2, McDaniel E.W. & McDowell M.R.C. eds, p. 209
- (15) Gabriel A.H., Jordan, C. 1973, ApJ, 186, 327
- (16) Green, P.J., Mathur, S., 1996, ApJ, 462, 637
- Hubeny (2001) Hubeny, I. 2001, ASP Conf. Ser. 247: Spectroscopic Challenges of Photoionized Plasmas, 197
- Jimenez-Garate et al. (2002) Jimenez-Garate, M. A., Hailey, C. J., Herder, J. W. d., Zane, S., & Ramsay, G. 2002, ApJ, 578, 391
- (19) Kallman T.R., Krolik, J.H., 1995, XSTAR, a Spectral Analysis Tool, Users Guide
- (20) Kallman T.R., Bautista, M.A., 2001, ApJS, 134, 139
- Kallman, Angelini, Boroson, & Cottam (2003) Kallman, T. R., Angelini, L., Boroson, B., & Cottam, J. 2003, ApJ, 583, 861
- Kaspi et al. (2002) Kaspi, S., et al. 2002, ApJ, 574, 643
- Kinkhabwala et al. (2002) Kinkhabwala, A., et al. 2002, ApJ, 575, 732
- Mewe & Schrijver (1978) Mewe, R., & Schrijver, J. 1978, A&A, 65, 99
- Mukai et al. (2003) Mukai, K., Kinkhabwala, A., Peterson, J. R., Kahn, S. M., & Paerels, F. 2003, ApJ, 586, L77
- (26) Murray, N., Chiang, J. 1995, ApJ, 454, L105
- Nayakshin, Kazanas, & Kallman (2000) Nayakshin, S., Kazanas, D., & Kallman, T. R. 2000, ApJ, 537, 833
- Ogle et al. (2003) Ogle, P. M., Brookings, T., Canizares, C. R., Lee, J. C., & Marshall, H. L. 2003, A&A, 402, 849
- (29) Porquet, D., & Dubau J. 2000, A&AS, 143, 495
- Porquet et al. (2001) Porquet, D., Mewe, R., Dubau, J., Raassen, A. J. J., & Kaastra, J. S. 2001, A&A, 376, 1113
- Pradhan & Shull (1981) Pradhan, A. K., & Shull, J. M. 1981, ApJ, 249, 821
- Pradhan, Norcross, & Hummer (1981) Pradhan, A. K., Norcross, D. W., & Hummer, D. G. 1981, ApJ, 246, 1031
- Pradhan (1982) Pradhan, A. K. 1982, ApJ, 263, 477
- Pradhan (1985) Pradhan, A. K. 1985, ApJ, 288, 824
- Różańska, Dumont, Czerny, & Collin (2002) Różańska, A., Dumont, A.-M., Czerny, B., & Collin, S. 2002, MNRAS, 332, 799
- (36) Różańska, A., et al. 2003, submitted to MNRAS
- Sako, Kahn, Paerels, & Liedahl (2000) Sako, M., Kahn, S. M., Paerels, F., & Liedahl, D. A. 2000, ApJ, 543, L115
- Schulz & Brandt (2002) Schulz, N. S., & Brandt, W. N. 2002, ApJ, 572, 971
- Verner & Ferland (1996) Verner, D. A., & Ferland, G. J. 1996, ApJS, 103, 467
- Zhang & Sampson (1987) Zhang, H. & Sampson, D. H. 1987, ApJS, 63, 487