THE DARK MATTER DISTRIBUTION IN THE CENTRAL REGIONS OF GALAXY CLUSTERS
Cosmological N-body simulations predict that dark matter halos should have a universal shape characterized by a steep, cuspy inner profile. Here we report on a spectroscopic study of six clusters each containing a dominant brightest cluster galaxy (BCG) with nearby gravitational arcs. Three clusters have both radial and tangential gravitational arcs, whereas the other three display only tangential arcs. We analyze stellar velocity dispersion data for the BCGs in conjunction with the arc redshifts and lens models to constrain the dark and baryonic mass profiles jointly. For those clusters with radial gravitational arcs we were able to measure precisely the inner slope of the dark matter halo and compare it with that predicted from CDM simulations.
1 Introduction
The Cold Dark Matter (CDM) paradigm for structure formation is extremely successful in explaining observations of the universe on large scales (e.g. Percival et al. 2001; Spergel et al. 2003; Croft et al. 2002; Bahcall et al. 2003). A vital tool within the CDM model is that of N-body simulations which are able to infer the properties of DM halos down to kpc scales and which have predicted a “universal” shape for DM density profiles (at mass scales ranging from dwarf galaxies to clusters of galaxies) that goes like at small radii (e.g. Navarro, Frenk & White 1997; Moore et al. 1998; Power et al. 2003; Fukushige et al. 2003). Nearly all numerical work points to a value of between 1 and 1.5.
Observational verification of the DM density profile at various mass scales is very important in confirming the CDM model. At the galaxy cluster scale, we have developed a technique to measure the DM density profile by combining constraints from gravitational lensing and the stellar velocity dispersion profile of a centrally located BCG. This allows us to disentangle luminous and dark components of the mass distribution in the inner regions of galaxy clusters.
2 Sample Selection & Data Analysis
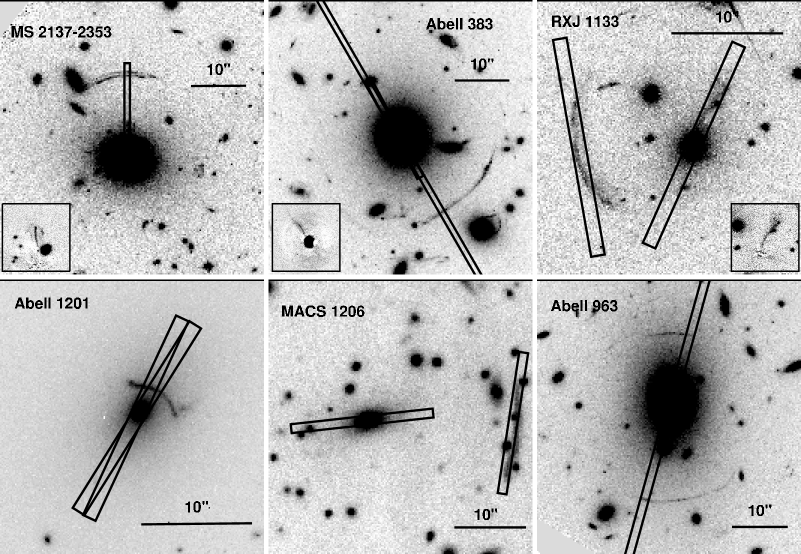
We have undertaken a search of the Hubble Space Telescope (HST) Wide Field and Planetary Camera 2 (WFPC2) archive to look specifically for radial gravitational arcs in galaxy clusters. From this catalog of clusters, we picked several candidates to follow up spectroscopically, all of which met the following criteria: 1) the cluster had a dominant, relatively isolated central galaxy; 2) there was at least one nearby large tangential gravitational arc, although clusters with radial arcs were preferred; 3) and there were no indications of substantial substructure or a significantly elongated cluster potential. We collected Keck spectroscopic data for 6 galaxy clusters, three with radial and tangential arcs and three with only tangential arcs. For each system an extended stellar velocity dispersion profile of the BCG was measured and, if necessary, gravitational arc redshifts were found as well. Figure 1 shows an image of each cluster.
We have presented the analysis involved in this work in Sand et al. (2002, 2003); and only briefly describe the methodology here. We adopted a simple, spherically symmetric two-component mass model comprising the BCG and cluster DM halo. For the BCG component we used a Jaffe (1983) mass density profile (which, in projection, describes well the surface brightness profile of the BCGs) and for the cluster DM halo we used a generalized-NFW profile which allows the inner slope, , to be a free parameter. Given this mass model we have effectively three free parameters: the stellar M/L of the BCG, the amplitude of the DM density profile, , and the crucial inner DM density logarithmic slope, . For a given set of free parameters, {M/L,,}, the expected position of the gravitational arcs and stellar velocity dispersion of the BCG can be calculated. By comparing the expectations from a given mass model with the observed arc positions and BCG velocity dispersion (along with their uncertainties) a likelihood can be calculated. In this way, it is easy to marginalize with respect to various parameters to find confidence limits on individual variables, in particular . Figure 2 gives the probability distribution function of the DM inner density slope, , for each of the clusters in our sample. The left hand panel shows the radial arc cluster constraints, along with the joint distribution across all three systems (; 68% CL). Note not only that the mean DM density profile is shallower than NFW, but that there is significant scatter in values across the sample, 0.3. The right hand panel shows the results for the tangential arc sample (0.57; 99% CL), which allows us to place not only an upper limit on the value of , but serves as a useful control sample for the radial arcs systems. Note that the radial arc sample is not biased towards lower values of as would be expected if they were a biased subset (see Sand et al. 2003).


3 Discussion & Conclusions
Figure 3 illustrates why we are able to place such strong constraints on the shape of the DM profile. In the left panel is plotted the velocity dispersion profile measured for MS2137-23, along with the best-fitting velocity dispersion (solid line; =0.57) that agrees with both the lensing and dynamics in the system. Plotted as a dashed line is a velocity dispersion profile whose underlying mass distribution (=1.30) agrees very well with the lensing data, but does not fit the measured velocity dispersion. This case illustrates why mass models with too steep an inner profile cannot match both the velocity dispersion profile and the positions of the gravitational arcs. In the right panel of Figure 3 is plotted the best-fitting density profile of MS2137-23. The velocity dispersion measurement of the BCG allows us to probe the mass distribution where luminous matter is important, while the arcs probe the portion of the mass distribution where dark matter dominates. The two measurements complement each other.
The observed value of is expected to lie between 1 and 1.5 on the basis of CDM only simulations, including those with the latest refinements and consideration for numerical convergence (i.e. Power et al. 2003; Fukushige et al. 2003). We have found a range of acceptable values of (see Figure 2), and although individual systems can be consistent with NFW (e.g. RXJ 1133), the average slope is inconsistent with the cuspy profiles expected from CDM simulations. Is it possible to account for the discrepancy between these observations and numerical predictions? Conventional CDM simulations only include collisionless DM particles. It is not clear how the inclusion of baryonic matter would affect the DM distribution, especially in regions where it dominates the total matter density. One possible situation, adiabatic contraction (e.g. Blumenthal et al. 1986), would steepen the DM distribution through gravitational processes and exacerbate the current problem. Baryons could also play an important dynamical role by driving energy and angular momentum out of the cluster core, thus softening an originally cuspy profile (e.g. El-Zant et al. 2001,2003). It is also possible that the DM particle is self-interacting. This would naturally cause the DM density profile to be shallower than that predicted from standard CDM (Spergel & Steinhardt 2000).


We are in the process of collecting a larger sample of galaxy clusters with radial arcs in order to further constrain our determination of the mean value of and its intrinsic scatter. A clear measurement of both of these parameters will aid in future comparisons to simulations, especially those that include both baryons and DM.
Acknowledgments
We are grateful to the MACS collaboration for access to MACS 1206. We acknowledge financial support for proposal number HST-AR-09527 provided by NASA through a grant from STScI, which is operated by AURA, under NASA contract NAS5-26555.
References
References
- [1] Bahcall, N. A. et al. 2003, ApJ, 585, 182
- [2] Croft, R. A. C. et al. 2002, ApJ, 581, 20
- [3] El-Zant, A., Shlosman, I., Hoffman, Y. 2001, ApJ, 560, 636
- [4] El-Zant, A., Hoffman, Y., Primack, J., Combes, F. & Shlosman, I., 2003, ApJ, submitted, astro-ph/0309412
- [5] Fukushige, T., Kawai, A., Makino, J. 2003, ApJ submitted, astro-ph/0306203
- [6] Jaffe, W. 1983, MNRAS, 202, 995
- [7] Kneib, J.-P., et al., 2003 ApJ, accepted, astro-ph/0307299
- [8] Moore, B., Governato, F., Quinn, T., Stadel, J. & Lake, G. 1998, ApJ, 499, L5 (Moore)
- [9] Navarro, J., Frenk, C. S., & White S. D. M 1997, ApJ, 490, 493 (NFW97)
- [10] Percival, W. J. et al. 2001, MNRAS, 327, 1297
- [11] Power, C., Navarro, J. F., Jenkins, A., Frenk, C. S., White, S. D. M., Springel, V., Stadel, J., & Quinn, T. 2003, MNRAS, 338, L14
- [12] Sand, D. J., Treu, T., & Ellis, R. S. 2002, ApJ, 574, L129
- [13] Sand, D. J., Treu, T., Smith, G. P. & Ellis, R. S. 2003, ApJ, submitted, astro-ph/0309465 Spergel, D. N. & Steinhardt, P. J. 2000, PhRvL, 84, 3760
- [14] Spergel, D. N. et al. 2003, ApJ, in press, astro-ph/0302209