The Far Ultraviolet Spectrum of the Io Plasma Torus
Abstract
The spectrum of the Io plasma torus in the range 905–1187 Å was recorded at 0.26 Å resolution by the Far Ultraviolet Spectroscopic Explorer (FUSE) on 2001 January 14. Five orbits of data were obtained with the west ansa of the torus centered and tracked in the apertures of the FUSE spectrographs for a total observation time of 9740 seconds. This region of the spectrum is dominated by transitions of S II, S III and S IV, whose multiplet structure is nearly completely resolved. We confirm our earlier detection of emission from resonance multiplets of Cl III and Cl II and derive an abundance of Cl+2 of 2.1% relative to S2+, leading to an overall chlorine ion abundance in the torus of slightly less than 1%. A number of features near 990 Å remain unidentified, and C III 977 is detected in two independent channels at the 3- level. The inferred relative ion abundance of C2+ relative to S2+ is . We also present spectra at 0.085 Å resolution taken on 2001 October 19 and 21 with the aperture. In these spectra the observed lines are resolved and their widths correspond to ion temperatures of 60–70 eV for all three sulfur ions.
1 INTRODUCTION
In a previous Letter (Feldman et al., 2001a, hereinafter Paper I) we reported on early spectroscopic observations of the Io plasma torus with the Far Ultraviolet Spectroscopic Explorer (FUSE). Those observations were made in January 2000 before FUSE acquired the capability to track moving solar system targets yet yielded new information about the content of the torus and in particular allowed the determination of the relative abundance of chlorine ions from the first detection of the ultraviolet resonance transitions of both Cl II and Cl III. The source of chlorine on Io is currently of interest following the detection of NaCl in Io’s atmosphere (Lellouch et al., 2003) and recent detailed modelling of volcanic chemistry (Moses et al., 2002). As part of the FUSE team solar system project, the torus was observed again, this time with full tracking capability, on 2001 January 14, during a Jovian campaign timed to coincide with the near closest approach of Cassini to Jupiter. The spectra obtained were a significant improvement over the earlier data. A clear enhancement of signal-to-noise ratio by a factor of four enabled confirmation of the identification of the weak Cl II emission reported earlier, the detection of many weak S II and S III emissions including several from very highly excited states, and the spectrum between 905 and 990 Å that was not obtained from the earlier data due to thermal misalignment of the SiC channels. Additional, higher resolution spectra of the strongest emissions were obtained during two series of limb scans of Jupiter in October 2001.
In this paper we present a more detailed analysis of the spectrum and in particular examine the torus abundances that can be inferred from the presence or absence of emissions of ions of C, N, Si and P, all of which have strong transitions in the FUSE spectral range. A number of weak spectral features remain unidentified and there are a few cases where the spectral assignment of the observed lines are uncertain. The higher resolution spectra show line widths that are greater than the instrumental widths which allows us to directly determine the ion temperature in the warm region of the torus where the ultraviolet emissions are produced. A comparison with the earlier data shows a significant change in relative ionization stages of sulfur in the year between observations. Temporal variations on scales of days to months have been reported from extended Cassini UVIS observations made around the time of Jupiter fly-by (Steffl et al., 2003). The abundance of chlorine ions relative to those of sulfur also appears to have changed.
2 OBSERVATIONS
Observations of the west ansa of the torus were made on 2001 January 14, beginning at 05:56:40 UT. A total exposure of 9740 seconds was obtained by accumulating spectra over 5 contiguous orbits. The center of the aperture (LWRS) was placed at the position of the ansa at the beginning of each exposure and both the motion of Jupiter on the sky and the wobble of the torus were tracked during each individual exposure. Tracking was verified from the constancy of the count rates in the principal ion emissions over each 2000 s exposure derived from the time-tagged data files. There is no spatial information about the distribution of the emission within the aperture.
At the time of the observation, Jupiter’s heliocentric distance was 5.05 AU and its geocentric distance was 4.40 AU. Details of the FUSE instrumentation have been given by Moos et al. (2000) and Sahnow et al. (2000). Basically, FUSE consists of four separate telescope/spectrograph assemblies, two employing lithium fluoride coatings (LiF) and two using silicon carbide (SiC). Each of four separate detectors (denoted 1a, 1b, 2a, and 2b) records two spectra, one each from a LiF and a SiC channel spanning a given wavelength interval, giving a total of eight separate spectra. Due to the extended but finite size of the torus emitting region within the aperture, the effective spectral resolution is 0.26 Å. The data presented here were reprocessed with the FUSE pipeline, calfuse version 2.2.1, all five orbits of data were co-added together, and the extracted fluxes were converted to average brightness (in rayleighs) in the aperture. The wavelengths were reduced to laboratory values by first taking out a heliocentric velocity correction applied by the pipeline and then removing the doppler shifts due to the Earth’s velocity relative to Jupiter and the plasma torus co-rotation of 75 km s-1. The agreement with laboratory wavelengths in all cases is better than 0.05 Å, and testifies to the accuracy of the wavelength calibration achieved in this version of the pipeline.
Drift scans of the eastern limb of Jupiter were made on 2001 October 19 and 21 using the FUSE MDRS () aperture. A single scan was made over each of five consecutive 3000 s orbits on both days. Each scan began with the slit, with the long dimension aligned nearly north-south, placed on a chord centered on the Jovian equator near the eastern limb. The spacecraft then executed a slew so that the apparent motion of the slit on the sky was towards the east, perpendicular to the long dimension of the slit, at a rate of 0.23 arc-seconds per minute. At the end of each scan the slit was completely off the disk of the planet. For these observations, Jupiter’s heliocentric distance was 5.14 AU and its geocentric distance was 4.86 and 4.83 AU, respectively, on the two dates.
The goal of these observations was to record the spectrum of the disk, primarily resonance scattering by atomic hydrogen and electron impact of H2. This approach was chosen to minimize the possibility of contamination by the much stronger polar aurorae and to take advantage of possible limb brightening of the H I emissions. In this respect, the foreground torus emissions were contaminants as they had been in the lower resolution (3 Å) observations of Jovian airglow by the Hopkins Ultraviolet Telescope (Feldman et al., 1993). At the higher resolution of FUSE they are easy to separate from the disk emissions.
Due to thermal misalignments between channels only the the LiF1 channel appears to show the expected level of disk emission. This is the channel that is coupled to the Fine Error Sensor used for guiding and tracking. The SiC1 channel also shows disk emission but at considerably lower signal/noise as the effective area of this channel is a factor of 4 lower than that for LiF1. The LiF2 and SiC2 channels both appear to have been off the disk for the entire observation, showing only torus emissions. For the LiF1 channel the time tagged data clearly show the disk emissions decreasing with time while the torus emissions increase as more and more of the background emission becomes visible in the aperture. It is also possible to follow the brightness variation of the torus emissions over successive orbits as the centrifugal equator of the torus wobbles through Jupiter’s equatorial plane at the limb. Because the emissions are about a factor of two weaker than at the ansae of the torus and because of the lower throughput of the MDRS aperture the torus spectra presented below are derived by co-adding all of the five orbits on each day for a total integration time of 31,333 seconds.
3 SPECTRA
3.1 LWRS Spectra
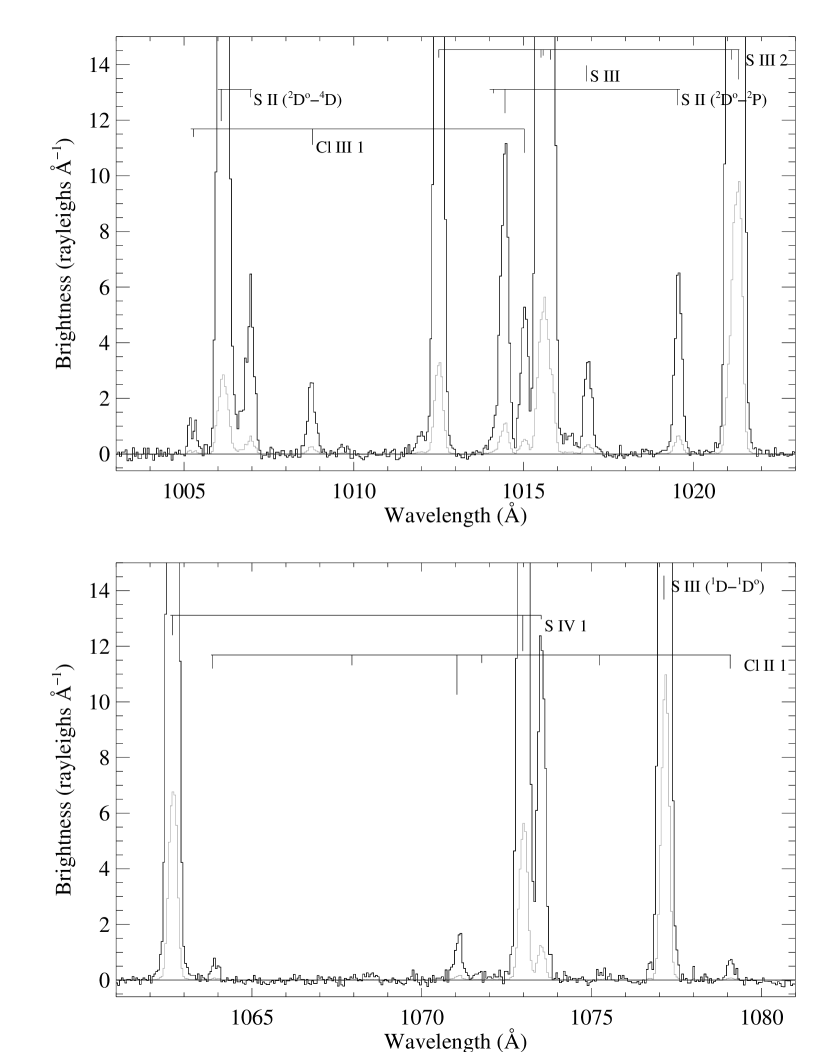
An overview spectrum from 995 to 1105 Å obtained from the January 2000 observations was given in Paper I. The spectra from January 2001 are essentially similar except for the factor of four increase in signal-to-noise ratio. This is particularly important for confirming the Cl II and Cl III multiplets which are shown in Figure The Far Ultraviolet Spectrum of the Io Plasma Torus. The chlorine emissions, both of which are principal resonance transitions, occur close to the wavelengths of resonance transitions of S III and S IV. The components of the Cl III triplet appear to be in the ratio 1:2:3 expected for the optically thin branching ratios even though the brightness of the 1015 Å line is somewhat uncertain due to blending with the strong S III lines nearby. Similarly, five of the six lines of the Cl II multiplet are clearly identified, again with the expected branching ratios. A list of all of the identified sulfur and chlorine ion emissions is given in Tables 1 and 2. Note that in two instances the atomic configurations are either not given or are uncertain.
The tables also give the identifications and brightnesses of a number of lines not identified in the January 2000 spectra (Paper I), particularly of S II. This is not only due to the enhanced S/N but also to the absence of thermal misalignment between the LiF and SiC channels that occurred in the earlier observation. A segment of the SiC1b spectrum, which extends to the FUSE short wavelength limit at 905 Å and includes the second resonance multiplet of S II, is shown in Figure The Far Ultraviolet Spectrum of the Io Plasma Torus. Figure The Far Ultraviolet Spectrum of the Io Plasma Torus shows a region of the spectrum from the LiF2a channel containing highly excited multiplets of S III and S IV that are extremely useful as temperature diagnostics (see Section 4.2).
3.1.1 Unidentified Features
The high sensitivity and spectral resolution of this data set make possible the search for and identification of many other ionic species that have resonance transitions in the FUSE spectral range. A first examination of the data indicates that almost all of the observed emissions can be identified with known and published transitions of sulfur and chlorine. There are a few lines whose assignment is uncertain such as the S III line at 1016.85 Å seen in the top panel of Figure The Far Ultraviolet Spectrum of the Io Plasma Torus and listed in Table 2. Kelly (1987) gives a wavelength that matches the observed line very well but does not assign the transition. A weaker line seen in the same figure at 1012.0 Å is also listed by Kelly as a S III line at 1011.91 Å, again without an assignment. The other ambiguity is the line at 1088.8 Å identified by Kelly as S IV. However, as we noted in our earlier paper, Kelly assigns this line to the same transition as the 1098.9 and 1099.5 Å lines of S IV given in the NIST Atomic Spectra Database111http://physics.nist.gov/. Of these latter two lines, Kelly lists only the 1099.5 Å line, and does not identify the transition, so his assignment of the 1088.8 Å line is suspect. The NIST Database does list a S IV transition at 1088.214 Å between high-lying and states, the upper one requiring 39 eV of excitation energy. However, the wavelength differs by 0.6 Å from our measured wavelength and a companion line at 1091.18 Å is absent, so this identification is unlikely.
The only truly unidentified features in the spectrum occur near 990 Å. Figure The Far Ultraviolet Spectrum of the Io Plasma Torus shows the spectral region from 970 to 1000 Å from three separate channels including the very short wavelength range of the LiF1a channel. Five distinct lines are seen in the SiC2a spectrum just shortward of the S II line at 996.0 Å, and the other spectra, where the wavelengths overlap, show the same features although at poorer S/N. These lines are at 991.5, 992.9, 993.5, 994.5, and 995.1 Å and have brightnesses in the range of 0.3–0.6 rayleighs. It is tempting to assign the feature at 991.5 Å to N III 991.56 but this is questionable due to the absence of the companion N III line at 989.79 Å which should be of comparable brightness. Kelly lists an unassigned S II transition at 991.73 Å, but the wavelength agreement is not quite as good. No obvious single candidate multiplet for all of the lines has been found in the available spectroscopic databases. Of the other sulfur ions, there is a high-lying transition of S V at 994.46 Å but this is considered unlikely since it requires 56 eV excitation energy and S4+ is present only at about 2% relative to S2+ (Steffl et al., 2003). There is a Si III triplet with lines at 993.5 and 994.8 Å, close to the wavelengths of two observed lines, but the strongest member of the triplet should be at 997.4 Å, which is missing. There should also be a stronger Si III multiplet at 1108–1113 Å.
3.1.2 Other Expected Features
Both singly- and doubly-ionized carbon have strong transitions in the FUSE spectral range and these were searched for in the January 2001 data. The C III line at 977.02 Å appears to be present in both SiC channel spectra (Figure The Far Ultraviolet Spectrum of the Io Plasma Torus) at the 3- level. Combining the two spectra gives a brightness of rayleighs. The C II doublet at 1036.34 and 1037.02 Å is not detected with a 1- upper limit of 0.04 rayleighs. Similar limits apply to the Si III multiplet, the strongest members of which would be at 1108.36, 1109.97, and 1113.23 Å. Phosphorus, which has about the same relative solar abundance as chlorine (Grevesse & Sauval, 1998), also has strong transitions of its low ionization states, P II at 1154 Å, P III at 918 and 1002 Å, and P IV at 951 Å. However, none of these multiplets are detected. The possible identification of an N III feature was mentioned above, but also likely to be present is N II, whose resonance multiplet is at 1085 Å, but which is also not detected.
The resonance transition of S V at 786 Å has recently been reported by Steffl et al. (2003). There are only high-lying transitions of S V in the FUSE spectral range. An intercombination transition that connects to the ground state lies just beyond the long wavelength limit of the LiF1b detector at 1188 Å. While there are also no transitions of either O II or O III connecting to their ground states there are several transitions between excited states of O II that could be observed. One such triplet, with its strongest component at 1083.13 Å, has been identified in FUSE spectra of terrestrial airglow where its source is likely photoionization of neutral atomic oxygen (Feldman et al., 2001b). The upper state of this transition lies 26.3 eV above the ground state and might be expected as we do observe S III 1126 and S IV 1099, which require 21.5 and 23.0 eV, respectively, for excitation (see Figure The Far Ultraviolet Spectrum of the Io Plasma Torus). The O II multiplet, however, like the N II resonance multiplet, falls in the gap between the two segments of each LiF detector and can be observed only with the SiC channels, whose effective areas at these wavelengths are a factor of five or more lower. There are also no collision strengths available for this O II transition.
3.2 MDRS Spectra
A portion of the higher resolution spectra corresponding to the top panel of Figure The Far Ultraviolet Spectrum of the Io Plasma Torus is shown in Figure The Far Ultraviolet Spectrum of the Io Plasma Torus. The lower spectrum is from LiF1a and contains some weak disk emission features in addition to the torus lines. The upper spectrum is from LiF2b and shows only torus lines but is considerably noisier due to the factor of two lower effective area of this channel relative to LiF1a. In order to obtain the best S/N possible, all of the data from both dates of observation have been co-added for each of the channels. While the LiF2b spectra are useful in identifying torus features, only the LiF1a spectra are used for fitting the line profiles.
Of the six lines in the S III multiplet only the lines at 1015.496 and 1015.561 Å are not resolved. The widths of the lines for this multiplet, the S IV multiplet at 1062–1073 Å and the S II line at 1045.76 Å are fit to gaussians and give linewidths of 0.14–0.15 Å. The intrinsic linewidth for emission uniformly filling the MDRS aperture is evaluated from the terrestrial airglow triplet of O I at 1040 Å, and found to be 0.085 Å. The observed widths then correspond to the convolution of a gaussian of K with the instrumental width for all of the three sulfur ions. This translates to an ion temperature of 60–70 eV.
4 DISCUSSION
4.1 Comparison with January 2000 Data
In Paper I the spectrum was fit to an isothermal multi-level emission model using version 3 of the CHIANTI database and software (Dere et al., 1997, 2001) that was updated with recent calculations of sulfur ion collision strengths that are now included in version 4 (Young et al., 2003). Normalizing to S III, the relative ion emissions were fit with an electron temperature, , of 80,000 K (6.9 eV), and relative abundances of S+ : S2+ : S3+ = 0.30 : 1.00 : 0.23. The present spectrum, including the spectral region below 995 Å not observed in the January 2000 data, is again well fit with K, but with different relative abundances, 0.41 : 1.00 : 0.17. Comparing the ratios of the strongest lines in each observation, we find that relative to S2+, S+ has increased by 37% while S3+ has decreased by 26%. Further, comparing the relative ion intensities in the MDRS spectra from October 2001, we find that the relative abundances are about the same as in January 2001, though this does not imply that they were stationary over the ten month interval separating the observations.
Our results may be compared directly with those derived from a series of observations of the torus made by the Cassini ultraviolet spectrometer on 2001 January 6, 12, and 14, recently reported by Steffl et al. (2003). From a composite spectrum from all three days spanning the wavelength interval from 650 to 1750 Å, and using the current version of the CHIANTI database, they find an electron temperature of 4.6 eV and relative abundances of S+ : S2+ : S3+ = 0.30 : 1.00 : 0.15 at 6.3 . They also simulate the suprathermal electron tail (-distribution) by a superposition of three Maxwellians but find little difference in the derived abundances. As noted below in Section 4.2, the lower value of found by Steffl et al. is not surprising and is in fact in good agreement with the result from the reanalysis of the HUT data, also spanning a wider wavelength range than the FUSE spectrum, given in Paper I. The difference in derived relative S+ abundance is likely due to the larger field-of-view of the FUSE aperture as Steffl et al. show its abundance to be steadily increasing inwards of 6.3 .
4.2 Electron Density and Temperature Diagnostics
The far ultraviolet emissions observed by FUSE originate in the “warm torus”, the region outward from 5.8 , where the plasma is characterized by an electron density, , 2000 cm-3, an electron temperature, , 5 eV (1 eV = K), and an ion temperature, , in the range of 50–100 eV (c.f. Bagenal, 1994). These parameters vary significantly with radial distance from Jupiter and also with height above the centrifugal plane as determined from both in situ measurements and remote long-slit spectroscopy, the latter primarily from ground-based observations of S II and S III (e.g., Thomas et al., 2001), which sample all of the torus. The remote observations exploit plasma diagnostics in the form of temperature or electron density sensitive spectral line ratios (Hall et al., 1994) and are independent of inferences based on the total flux in a given emission feature (Taylor et al., 1995). As noted above in Section 4.1, we use the CHIANTI database for the atomic data, primarily transition probabilities and collision strengths, for the evaluation of the requisite line ratios.
There are, however, several caveats in using these diagnostics with the FUSE spectra. The relatively large field-of-view, , translates into a range of radial distance and height above the centrifugal plane of over which these parameters are averaged as there is no spatial resolution within the aperture. This is in addition to the line-of-sight integration that is common to all remote observations. On the other hand, the derived parameters well characterize the regions where the emission is being produced.
Another problem, which has been pointed out before, is that the use of theoretical, thermally averaged effective collision strengths assumes a Maxwellian electron velocity distribution whereas the torus plasma is known to have a suprathermal tail that could contribute significantly to the excitation of the ultraviolet emissions. Sittler & Strobel (1987) found small departures from a Maxwellian distribution at Io’s orbital distance with a suprathermal ( 1 keV) to thermal ( 5 eV) electron density ratio of 0.001. Further support for non-thermal electrons comes from the Galileo plasma science instrument (Frank & Paterson, 2000). They found thermal core temperatures varying from 3 eV at 6 to 8 eV at 7.8 , with departures from the core Maxwellian distribution for energies in excess of 30 eV. In an analysis of Ulysses spacecraft data for the hot torus at 7–9 , Meyer-Vernet et al. (1995) applied the theory of velocity filtration for non-Maxwellian plasmas given by Scudder (1992), to the centrifugal force potential constraining torus plasma. They used a generalized Lorentzian function, known as the “kappa” distribution, to represent a non-thermal distribution function that is quasi-Maxwellian at low energies but has a power-law decrease (with the exponent a function of ) at high energies. This distribution has been used to explain various features of both Voyager data (Moncuquet et al., 2002) and HST observations of Io’s ultraviolet limb glow (Retherford et al., 2003).
Thus, there is significant evidence in both in situ and remote sensing observations for non-Maxwellian plasma distributions in the Io torus in addition to the fact that . With the small indices 2–3.5 inferred by Meyer-Vernet et al. (1995), Moncuquet et al. (2002), and Retherford et al. (2003), the electron temperature increases from its value at the centrifugal equator, for example, 5 eV to 7.5 and 15 eV at 1 plasma scale height above and below the equator for = 3.5 and 2, respectively. With the large aperture of FUSE, the derived effective electron temperature will depart significantly from its equatorial value.
This effect is less important for the longer wavelength ultraviolet emissions, and evidence for this effect may be found in Paper I in the reanalysis of the torus spectra taken by the Hopkins Ultraviolet Telescope (HUT) during the Astro-1 and -2 missions (Moos et al., 1991) using the current set of atomic data. For both of these data sets, the best fit to the emissions in the FUSE spectral range together with S II 1256, S III] 1729, and S IV 1406, gave a value of of 50,000 K, similar to what was found earlier by Hall et al. (1994). Nevertheless, the derivation of an “equivalent” electron temperature is extremely useful for comparison with theoretical models of the electron energy distribution and with in situ measurements from Galileo.
A final caveat rests with the atomic data, the uncertainties not being immediately quantifiable. There are a number of multiplets where the relative intensities within the multiplet as measured differ from the model synthetic spectrum and these lines are neither or dependent. There are also deviations from the predicted multiplet relative intensities, particularly for S II, but also for S III 1077.2 relative to the resonance multiplet. These deviations lie mainly in the details and may serve the purpose of being an “astrophysical laboratory” for fine-tuning the calculations.
The strongest electron temperature dependence occurs for the multiplets of S III and S IV shown in Figure The Far Ultraviolet Spectrum of the Io Plasma Torus. As noted in Section 3.1.2, these multiplets require 21.5 and 23.0 eV, respectively, for excitation, while the resonance multiplets require only 11 eV. Figure The Far Ultraviolet Spectrum of the Io Plasma Torus shows the calculated dependence of three lines of S III and two lines of S IV, together with the observed ratios from the LiF1b (crosses) and LiF2a (diamonds) channels. For all but one of these lines the two channels give nearly identical results. The discrepancy in the S III 1126.8 blend may be the result of a known calibration problem with the LiF1b channel (Sahnow et al., 2000). The data are fit by a ranging from 65,000 to 90,000 K. However, note that lines originating in the same multiplet give different values of , the difference well exceeding the statistical uncertainties in the measured line ratios. This limited set of data also does not provide any evidence that the S IV emissions are produced in a region of higher than those of S III, as Hall et al. (1994) had concluded from the HUT data. A complete reanalysis of the HUT spectra will be presented elsewhere.
There are a limited number of electron density diagnostic intensity ratios available that are relatively insensitive to . Figure The Far Ultraviolet Spectrum of the Io Plasma Torus shows two for S II and S III, calculated with version 4 of CHIANTI for = 50,000 and 80,000 K, together with the observed ratios. All but one are insensitive to . The two S III ratios give widely differing values for , and all give densities in the range of 3000 – 5000 cm-3, higher than the Voyager-based model value of 2000 cm-3, but consistent with in situ Galileo PLS measurements of of cm-3 (Frank et al., 1996; Bagenal et al., 1997). The small slopes of the ratio curves make these calculated ratios extremely sensitive to small uncertainties in the atomic parameters and in fact there are significant differences in some of these curves between versions 3 and 4 of CHIANTI.
4.3 Ion Temperatures
The spectra presented above in Section 3.2 are the first ultraviolet spectra of the Io plasma torus with sufficient spectral resolution to allow the determination of ion temperatures from the measured line shapes. Thomas et al. (2001) have used ground-based high dispersion observations of S II and S III in the red and near infrared to determine as a function of radial distance from Jupiter. Unlike those measurements, the spectra described in Section 3.2 were obtained with the FUSE long-slit at 1 , oriented roughly normal to the planet’s equatorial plane. This results in a factor of two loss in flux over placing the slit at the ansa (Sandel & Broadfoot, 1982; Steffl et al., 2003) but effectively integrates the emission over all radial distances. The derived ion temperature thus refers to the ions in their region of maximum emission, roughly 6.0–6.5 .
We found that the linewidths, which are determined mostly by the distribution of gyrovelocities, corresponded to perpendicular ion temperatures of 60–70 eV for all three sulfur ions. This is in excellent agreement with the values of for S II and S III in the region from 6.0 to 6.5 found by Thomas et al. (2001). However, it is in strong disagreement with the results from the Galileo plasma spectrometer which Crary et al. (1998) interpreted to give = 10–24 eV over this range of radial distance.
In addition to effects of non-Maxwellian plasma distributions along the magnetic field, the processes that add ion mass and energy to the torus plasma, ionization of neutrals that escape Io by electron impact and charge exchange, create a highly non-Maxwellian distribution of gyro-velocity. Fresh ions are accelerated by Jupiter’s co-rotational electric field from essentially Io’s orbital velocity to co-rotation with Jupiter and acquire a gyro-velocity equal to the velocity difference. Because most ions are created at Io’s orbital distance, the gyro-velocity distribution functions for newly created ions is approximately a delta function with only a narrow spread in velocity. Smith & Strobel (1985) demonstrated in a Fokker-Planck calculation of distribution functions for perpendicular (to the magnetic field) velocity that if the residence time of ions in the torus is short compared with the time to collisionally evolve into Maxwellian distributions, the ion distribution functions remain highly non-Maxwellian. For conditions at the time of Voyager-1, they found that S II and O II departed significantly from Maxwellian distributions and that the average energies/temperatures were highest for O II and S II and coldest for O III and S IV with differences approaching a factor of 2. The latter ions had essentially Maxwellian distributions. Smith & Strobel fit Maxwellian distributions to the quasi-thermal cores of their calculated distribution functions and found common core temperatures for sulfur ions under Voyager 1 conditions of 60–74 eV. Only O II yielded a high core temperature of 105 eV.
Our procedure of fitting gaussians to the observed line widths captures the quasi-thermal cores of the sulfur ion distribution functions. The data have insufficient S/N to permit detection of the non-thermal component, which in the Voyager-1 case, according to Smith & Strobel, 5% of S II were in a suprathermal tail with a distinct pickup ion signature. The ion temperatures of 60–70 eV inferred from the FUSE spectra are comparable to the Voyager-1 encounter ion temperatures derived by Bagenal (1994) from Voyager PLS data and with the theory of Smith & Strobel (1985).
4.4 Relative Minor Ion Abundances
As in Paper I, we can estimate the relative abundances of minor ions in the torus by comparing the excitation rates of these ion lines to that of the S III line at 1012.5 Å. Repeating from that paper, the collisional excitation rate is given by:
where is the electron temperature dependent effective collision strength, is the energy of the upper state of the transition, and is Boltzmann’s constant. Values of are taken largely from the CHIANTI 4.0 database (Young et al., 2003) except for the recent calculations for Cl III given by Ramsbottom et al. (2001) which is not in the current version of the database. These include the calculations of Tayal & Gupta (1999) for S III, Blum & Pradhan (1992) for C II, Berrington et al. (1989) for C III and Dufton & Kingston (1989) for Si III. We find that [Cl2+]/[S2+] = , or [Cl2+]/(all sulfur ions) = . These are somewhat lower than the values of 0.031 and 0.020, respectively, given in Paper I. We still lack the atomic data for Cl II to definitively show that Cl2+ is the principal ionization stage of chlorine in the torus. Note that our derived abundance is comparable to the cosmic abundance ratio of [Cl]/[S] = 0.015 given by Grevesse & Sauval (1998). As before, since sulfur can account for no more than half of the total ion density in the torus this leads to the conclusion that chlorine ions are present at the level of 1% or less of the total ion population. There appears to be a statistically significant decrease of 30% in the Cl2+ abundance relative to that of the sulfur ions, between January 2000 and January 2001. It also appears that the abundance of Cl+ relative to Cl2+ increased over this period. This variability may indicate a primarily volcanic source of Cl in Io’s atmosphere (Lellouch et al., 2003; Moses et al., 2002).
From the detection of C III 977 discussed in Section 3.1.2, we find that [C2+]/[S2+] . However, this should be regarded as an upper limit to the abundance of Iogenic carbon in that these ions could have a solar wind origin (Krimigis & Roelof, 1983). From the C II and Si III upper limits, 3 relative column density upper limits are [C+]/[S2+] and [Si2+]/[S2+] . From Grevesse & Sauval the cosmic abundance ratios relative to S are [C]/[S] = 15.5 and [Si]/[S] = 1.66, so assuming that C2+ and Si2+ are also the dominant ion stages, both carbon and silicon are severely depleted in the torus relative to solar abundances. For carbon the depletion is greater than four orders of magnitude and is likely due to the outgassing of volatiles from Io from continuous volcanic activity. For phosphorus an upper limit abundance estimate is not possible due to the lack of published collision strengths.
5 CONCLUSION
The Far Ultraviolet Spectroscopic Explorer has recorded the spectrum of the Io plasma torus in the range 905–1187 Å at spectral resolutions of 0.26 and 0.085 Å, the highest to date. Almost all of the emissions observed arise from ions of sulfur and the details of the spectra can be matched well by isothermal models using the CHIANTI database of atomic parameters and multi-level excitation models. These models also permit constraints to be set on the electron density and temperature in the region of the torus where the ultraviolet emissions are excited. In addition to sulfur, the resonance multiplets of Cl II and Cl III are clearly detected and we derive an overall chlorine ion abundance in the torus of slightly less than 1%, a decrease relative to that derived from observations made a year earlier (Feldman et al., 2001a). C III 977 is detected and a number of features near 990 Å remain unidentified. The source of the carbon ions is uncertain and may be the result of charge transfer of solar wind ions in the Jovian magnetosphere. There is no evidence for ions of nitrogen, silicon, or phosphorus, all which which have strong lines in the FUSE spectral range. From spectra obtained at 0.085 Å resolution we are able to measure the linewidths of the strongest far ultraviolet emissions. These are found to be consistent with an ion temperature of 60–70 eV for each of the observed sulfur ions.
References
- Bagenal (1994) Bagenal, F. 1994, J. Geophys. Res., 99, 11043
- Bagenal et al. (1997) Bagenal, F., Crary, F. J., Stewart, A. I. F., Schneider, N. M., Gurnett, D. A., Kurth, W. S., Frank, L. A., & Paterson, W. R. 1997, Geophys. Res. Lett., 24, 2119
- Berrington et al. (1989) Berrington, K. A., Burke, V. M., Burke, P. G., & Scialla, S. 1989, Journal of Physics B Atomic Molecular Physics, 22, 665
- Blum & Pradhan (1992) Blum, R. D., & Pradhan, A. K. 1992, ApJS, 80, 425
- Crary et al. (1998) Crary, F. J., Bagenal, F., Frank, L. A., & Paterson, W. R. 1998, J. Geophys. Res., 103, 29359
- Dere et al. (1997) Dere, K. P., Landi, E., Mason, H. E., Monsignori Fossi, B. C., & Young, P. R. 1997, A&AS, 125, 149
- Dere et al. (2001) Dere, K. P., Landi, E., Young, P. R., & Del Zanna, G. 2001, ApJS, 134, 331
- Dufton & Kingston (1989) Dufton, P. L., & Kingston, A. E. 1989, MNRAS, 241, 209
- Feldman et al. (2001a) Feldman, P. D., Ake, T. B., Berman, A. F., Moos, H. W., Sahnow, D. J., Strobel, D. F., Weaver, H. A., & Young, P. R. 2001a, ApJ, 554, L123
- Feldman et al. (1993) Feldman, P. D., McGrath, M. A., Moos, H. W., Durrance, S. T., Strobel, D. F., & Davidsen, A. F. 1993, ApJ, 406, 279
- Feldman et al. (2001b) Feldman, P. D., Sahnow, D. J., Kruk, J. W., Murphy, E. M., & Moos, H. W. 2001b, J. Geophys. Res., 106, 8119
- Frank & Paterson (2000) Frank, L. A., & Paterson, W. R. 2000, J. Geophys. Res., 105, 16017
- Frank et al. (1996) Frank, L. A., Paterson, W. R., Ackerson, K. L., Vasyliunas, V. M., Coroniti, F. V., & Bolton, S. J. 1996, Science, 274, 394
- Grevesse & Sauval (1998) Grevesse, N., & Sauval, A. J. 1998, Space Science Reviews, 85, 161
- Hall et al. (1994) Hall, D. T., Bednar, C. J., Durrance, S. T., Feldman, P. D., McGrath, M. A., Moos, H. W., & Strobel, D. F. 1994, ApJ, 420, L45
- Kelly (1987) Kelly, R. L. 1987, Atomic and ionic spectrum lines below 2000 Angstroms. Hydrogen through Krypton (New York: American Institute of Physics (AIP), American Chemical Society and the National Bureau of Standards)
- Krimigis & Roelof (1983) Krimigis, S. M., & Roelof, E. C. 1983, in Physics of the Jovian Magnetosphere, ed. A. J. Dessler (Cambridge U. Press), 106
- Lellouch et al. (2003) Lellouch, E., Paubert, G., Moses, J. I., Schneider, N. M., & Strobel, D. F. 2003, Nature, 421, 45
- Meyer-Vernet et al. (1995) Meyer-Vernet, N., Moncuquet, M., & Hoang, S. 1995, Icarus, 116, 202
- Moncuquet et al. (2002) Moncuquet, M., Bagenal, F., & Meyer-Vernet, N. 2002, J. Geophys. Res., 107 (A9), 1260, DOI 10.1029/2001JA900124, SMP 24-1
- Moos et al. (2000) Moos, H. W., et al. 2000, ApJ, 538, L1
- Moos et al. (1991) Moos, H. W., et al. 1991, ApJ, 382, L105
- Moses et al. (2002) Moses, J. I., Zolotov, M. Y., & Fegley, B. 2002, Icarus, 156, 107
- Ramsbottom et al. (2001) Ramsbottom, C. A., Bell, K. L., & Keenan, F. P. 2001, Atomic Data and Nuclear Data Tables, 77, 57
- Retherford et al. (2003) Retherford, K. D., Moos, H. W., & Strobel, D. F. 2003, J. Geophys. Res., 108 (A8), 1333, DOI 10.1029/2002JA009710, SIA 7-1
- Sahnow et al. (2000) Sahnow, D. J., et al. 2000, ApJ, 538, L7
- Sandel & Broadfoot (1982) Sandel, B. R., & Broadfoot, A. L. 1982, J. Geophys. Res., 87, 212
- Scudder (1992) Scudder, J. D. 1992, ApJ, 398, 299
- Sittler & Strobel (1987) Sittler, E. C., & Strobel, D. F. 1987, J. Geophys. Res., 92, 5741
- Smith & Strobel (1985) Smith, R. A., & Strobel, D. F. 1985, J. Geophys. Res., 90, 9469
- Steffl et al. (2003) Steffl, A. J., Bagenal, F., & Stewart, A. I. F. 2003b, Icarus, in press
- Steffl et al. (2003) Steffl, A. J., Stewart, A. I. F., & Bagenal, F. 2003a, Icarus, in press
- Tayal & Gupta (1999) Tayal, S. S., & Gupta, G. P. 1999, ApJ, 526, 544
- Taylor et al. (1995) Taylor, M. H., Schneider, N. M., Bagenal, F., Sandel, B. R., Shemansky, D. E., Matheson, P. L., & Hall, D. T. 1995, J. Geophys. Res., 100, 19541
- Thomas et al. (2001) Thomas, N., Lichtenberg, G., & Scotto, M. 2001, J. Geophys. Res., 106, 26277
- Young et al. (2003) Young, P. R., Del Zanna, G., Landi, E., Dere, K. P., Mason, H. E., & Landini, M. 2003, ApJS, 144, 135
| Ion | WavelengthaaLaboratory wavelength. | Configuration | Designation | Configuration | Designation | BrightnessbbAverage brightness in aperture. |
|---|---|---|---|---|---|---|
| (Å) | () | () | () | () | (rayleighs) | |
| S II | 906.508 | 4S3/2 | 4F5/2 | |||
| S II | 906.876 | 4S3/2 | 4P5/2 | ccStandard deviation in observed counts. | ||
| S II | 910.485 | 4S3/2 | 4P3/2 | |||
| S II | 912.736 | 4S3/2 | 4P1/2 | |||
| S II | 915.388 | 2P3/2 | 2D5/2 | |||
| S II | 918.813 | 2P1/2 | 2D3/2 | |||
| S II | 919.208 | 2P3/2 | 2D3/2 | |||
| S II | 937.420 | 2D3/2 | 2D3/2 | |||
| S II | 937.688 | 2D5/2 | 2D5/2 | |||
| S II | 996.007 | 2D5/2 | 2F7/2 | |||
| S II | 1000.486 | 2D3/2 | 2F5/2 | |||
| S II | 1006.091 | 2D5/2 | 4D7/2 | |||
| S II | 1006.258 | 2D3/2 | 4D5/2 | |||
| S II | 1006.580 | 2D5/2 | 4D5/2 | |||
| S II | 1006.889 | 2D5/2 | 4D3/2 | |||
| S II | 1006.954 | 2D3/2 | 4D1/2 | |||
| S II | 1014.437 | 2D5/2 | 2P3/2 | |||
| S II | 1019.528 | 2D3/2 | 2P1/2 | |||
| S II | 1042.950 | 2D5/2 | 4F9/2 | |||
| S II | 1045.763 | 2D5/2 | 4F7/2 | |||
| S II | 1047.554 | 2D3/2 | 4F5/2 | |||
| S II | 1047.903 | 2D5/2 | 4F5/2 | |||
| S II | 1049.053 | 2D3/2 | 4F3/2 | |||
| S II | 1096.596 | 2D3/2 | 2P1/2 | |||
| S II | 1102.362 | 2D5/2 | 2P3/2 | |||
| S II | 1124.395 | 2P1/2 | 2P3/2 | |||
| S II | 1124.986 | 2P3/2 | 2P3/2 | |||
| S II | 1131.059 | 2P1/2 | 2P1/2 | |||
| S II | 1131.657 | 2P3/2 | 2P1/2 | |||
| S II | 1166.291 | 2P3/2 | 4F5/2 | |||
| S II | 1167.512 | 2P1/2 | 4F3/2 | |||
| S II | 1168.150 | 2P3/2 | 4F3/2 | |||
| S II | 1172.882 | 2P3/2 | 4P3/2 |
| Ion | WavelengthaaLaboratory wavelength. | Configuration | Designation | Configuration | Designation | BrightnessbbAverage brightness in aperture. |
|---|---|---|---|---|---|---|
| (Å) | () | () | () | () | (rayleighs) | |
| S III | 1012.492 | 3P0 | 3P1 | ccStandard deviation in observed counts. | ||
| S III | 1015.496 | 3P1 | 3P0 | |||
| S III | 1015.561 | 3P1 | 3P1 | |||
| S III | 1015.775 | 3P1 | 3P2 | |||
| S III | 1016.85 | configuration not identified in Kelly (1987) | ||||
| S III | 1021.105 | 3P2 | 3P1 | |||
| S III | 1021.321 | 3P2 | 3P2 | |||
| S III | 1077.171 | 1D2 | 1D2 | |||
| S III | 1121.755 | 3D2 | 3P2 | |||
| S III | 1122.418 | 3D3 | 3P2 | |||
| S III | 1126.536 | 3D1 | 3P1 | |||
| S III | 1126.886 | 3D2 | 3P1 | |||
| S III | 1128.500 | 3D1 | 3P0 | |||
| S IV | 1062.664 | 2P1/2 | 2D3/2 | |||
| S IV | 1072.974 | 2P3/2 | 2D5/2 | |||
| S IV | 1073.518 | 2P3/2 | 2D3/2 | |||
| S IV | 1088.83 | identified by Kelly (1987), configuration uncertain | ||||
| S IV | 1098.929 | 2D5/2 | 2D5/2 | |||
| S IV | 1099.480 | 2D3/2 | 2D3/2 | |||
| Cl II | 1063.831 | 3P2 | 3P1 | |||
| Cl II | 1071.036 | 3P2 | 3P2 | |||
| Cl II | 1079.080 | 3P1 | 3P2 | |||
| Cl III | 1005.28 | 4S3/2 | 4P1/2 | |||
| Cl III | 1008.78 | 4S3/2 | 4P3/2 | |||
| Cl III | 1015.02 | 4S3/2 | 4P5/2 | |||
FIGURE CAPTIONS
FUSE spectrum of the west ansa of the Io torus obtained on 2001 January 14 showing the regions containing the Cl III (top) and Cl II (bottom) multiplets. The total exposure time was 9740 s. The gray curve is the data scaled by a factor of 10.
Same as Figure The Far Ultraviolet Spectrum of the Io Plasma Torus for the spectral region from 905 to 940 Å showing the S II second resonance triplet.
Same as Figure The Far Ultraviolet Spectrum of the Io Plasma Torus for the spectral region from 1085 to 1135 Å showing the highly excited S III and S IV multiplets.
Same as Figure The Far Ultraviolet Spectrum of the Io Plasma Torus for the spectral region from 970 to 1000 Å showing spectra from three independent channels. Unidentified features that appear in at least two channels are denoted by “?”.
FUSE spectrum from the MDRS aperture obtained on 2001 October 19 and 21. The same spectral region as the top panel of Figure The Far Ultraviolet Spectrum of the Io Plasma Torus is shown from two separate channels. The LiF2b channel has about one-half the effective area as the LiF1a channel. The total integration time was 31,333 s. The LiF1a spectrum also includes several H2 emissions from the Jovian disk.
Calculated line ratios as a function of for S III 1128.5, 1126.8, and 1122.4 (a, b, and c, respectively) relative to 1012.5 and S IV 1099.5 and 1098.9 (d and e, respectively), relative to 1062.7. A plasma with spatially homogeneous, constant electron temperature defined by a single Maxwellian distribution and = 2000 cm-3 was assumed. The CHIANTI v.4 software was used. The observed ratios are indicated by crosses (LiF1b) and diamonds (LiF2a). The error bars are 1- in the observed counts.
Calculated line ratios as a function of for S II and S III lines indicated in the figure for two values of , 50,000 K (solid line) and 80,000 K (dashed line). The CHIANTI v.4 software was used. The observed ratios are from the LiF1a channel. The error bars are 1- in the observed counts.