The Nuclear Gas Dynamics and Star Formation of NGC 7469111The near infrared data presented herein were obtained at the W.M. Keck Observatory, which is operated as a scientific partnership among the California Institute of Technology, the University of California and the National Aeronautics and Space Administration. The Observatory was made possible by the generous financial support of the W.M. Keck Foundation. The radio data are based on observations carried out with the IRAM Plateau de Bure Interferometer. IRAM is supported by INSU/CNRS (France), MPG (Germany) and IGN (Spain).
Abstract
We report interferometric radio CO 2-1 and HCN 1-0 observations at resolutions of 0.7″ and 2.0″ respectively, and 0.085″ resolution adaptive optics K-band spectroscopy, including H2 1-0 S(1) line emission and CO 2-0 stellar absorption, of the inner few arcseconds of NGC 7469. The CO 2-1 map shows a ring of molecular clouds (which in general lie outside the compact knots seen in K-band images) and a bright extended nucleus, with a bar or pair of spiral arms between them. The dynamical structure of both the radio CO 2-1 and the K-band H2 1-0 S(1) lines at their different resolutions can be reproduced using a single axisymmetric mass model comprising 3 components: a broad disk, a ring 4–5″ across, and an extended nucleus which we interpret as an inner nuclear ring about 0.5″ across. The velocity residuals between the model and the data have a standard deviation of 25 km s-1, and no non-circular motions faster than this are seen, although this may be because in some cases a secondary bar is not expected to cause gas inflow. From the dynamical mass and estimates of the stellar mass we find that the CO-to-H2 conversion is 0.4–0.8 times that for the Milky Way, following the trend to small factors that has been previously reported for intense star forming environments. The central H2 1-0 S(1) morphology has a strong peak at the nucleus, but this does not trace the mass distribution; the rotation curves indicate that there is no strong nuclear mass concentration. The origins of the 1-0 S(1) emission are instead likely to lie in X-ray and UV irradiation of gas by the AGN rather than via processes associated with star formation. Using the 2.3 m stellar CO 2-0 bandhead absorption and the slope of the continuum we have directly resolved the nuclear star cluster to be 0.15–0.20″ across, and find that it is asymmetric. This cluster has an age of less than about 60 Myr and contributes 20–30% of the nuclear K-band light, and about 10% of the nuclear bolometric luminosity. Within a radius of 4″ gas contributes more than half the total mass; but in the nucleus, within a radius of 0.1″, it is likely that most of the mass is due instead to stars.
1 Introduction
The SBa Seyfert 1 galaxy NGC 7469 is a luminous infrared source with L⊙, assuming a distance of 66 Mpc (taking H km s-1 Mpc-1 and km s-1, Meixner et al. 1990). Much of the interest in the galaxy has been focussed on the circumnuclear ring structure on scales of 1.5–2.5″, which has been observed at radio (Wilson et al., 1991; Condon et al., 1991; Colina et al., 2001), optical (Mauder et al., 1994), mid infrared (Miles et al., 1994; Soifer et al., 2003), and near infrared (Genzel et al., 1995; Lai et al., 1999; Scoville et al., 2000) wavelengths. These data suggest that recent star formation in this ring contributes more than half of the entire bolometric luminosity of the galaxy. Additionally, as much as one third of the K-band continuum within 1″ of the nucleus may also originate in stellar processes rather than the AGN itself (Mazzarella et al., 1994; Genzel et al., 1995). NGC 7469 is therefore a key object for studying the relation between circumnuclear star formation and an AGN, and how gas is brought in to the nucleus to fuel these processes.
This crucial question is still the subject of much debate. It has been known for some time that bars can form in the disks of galaxies, and that the shocks in the diffuse gas associated with these can drive the gas from the disk on scales of 10 kpc down to the nucleus on scales of 1 kpc. However, it is only more recently that the issue of whether or not bars within bars might be able to drive the gas even further to the centre has been studied in more detail, both observationally (e.g. Martini and Pogge, 1999; Regan and Mulchaey, 1999; Laine et al., 2002) and theoretically (e.g. Maciejewski et al., 2002; Shlosman and Heller, 2002). One classic example is the Seyfert 2 NGC 1068 which has a circumnuclear ring at 15″ (1 kpc), inside of which is a bar and near the nucleus another gaseous ring at 1″ (70 pc) (Helfer, 1997; Tacconi et al., 1997; Schinnerer et al., 2000; Baker, 2000). We wish to investigate whether dynamical processes may be operating in NGC 7469 which help to drive gas from the circumnuclear ring further towards the centre.
To do so we have brought together the unique combination of high resolution radio CO data and near infrared adaptive optics H2 1-0 S(1) data, giving us a tool with which we can probe the distribution and dynamical structure of the molecular gas across nearly 2 orders of magnitude in spatial scale. Our data are presented in Section 2. In Section 3 we consider the properties of the molecular gas with respect to both the radio CO 2-1 and near infrared 1-0 S(1) emission. We present a single mass model which is able to reproduce the kinematics of both sets of data, and discuss the issue of non-circular motions associated with bars and spiral arms. Finally in this section, we turn to the excitation process of the 1-0 S(1) emission, and the CO-to-H2 conversion ratio. Section 4 discusses the nuclear star formation. Finally, our conclusions are summarised in Section 5.
2 Observations and Data Reduction
2.1 Radio Data
We have mapped the 12CO J=21 and HCN J=10 lines in NGC 7469 with the IRAM millimeter interferometer on the Plateau de Bure, France (Guilloteau et al., 1992). The CO 2-1 and HCN 1-0 data were obtained in January 1997. The array consisted of 5 15-m antennas positioned in 2 configurations providing 20 baselines ranging from 32–400 m. We observed NGC 7469 for 9 hrs in each configuration for a total of 18 hrs of integration time. The antennas were equipped with dual frequency SIS receivers enabling us to observe the CO and HCN lines simultaneously. SSB system temperatures above the atmosphere were 120 K at the 86 GHz frequency of the HCN 1-0 line and 350 K at the 228 GHz frequency of the CO 2-1 line. 3C345.3 was observed for bandpass calibration as well as every half hour for phase and amplitude calibration. Absolute fluxes were established by assigning flux of 3.5 Jy and 6.0 Jy to 3C454.3 at 228 GHz and 86 GHz respectively. Fluxes of strong sources are determined through careful monitoring with both the interferometer and the IRAM 30-meter telescope on Pico Veleta, Spain. Based on the monitoring measurements, we assume that the accuracy of the flux scale is better than 20%. The phase noise on the longest baselines was 20∘–30∘, even at the higher frequency. Spectral resolution of 2.5 MHz, corresponding to 6.5 km s-1 for the HCN 1-0 line and 3.3 km s-1 for the CO 2-1 line, was provided by 6 autocorrelator spectrometers covering the total receiver bandwidth of 500 MHz (1300 km s-1 for HCN and 650 km s-1 for CO 2-1).
In an earlier set of runs between October and December 1994, the 12CO J=10 line was mapped using 4 antennae in 4 configurations providing 24 baselines in the range 24–288 m. The data were calibrated and reduced in the same way, yielding a final resolution of 2.5″. Because the CO 2-1 data supercede these data, we use the older data only in Section 3.5 to estimate the CO-to-H2 conversion factor. The map itself has been presented previously by Tacconi & Genzel (1996).
All the data were first calibrated using the IRAM CLIC software. We then made uniformly weighted channel maps for the CO 2-1 and HCN data. We CLEANed all the maps using software available as part of the GILDAS package. To increase the sensitivity maps were made with a velocity resolution of 20 km s-1 in all three lines. The CLEANed maps were reconvolved with 0.7″and 2″ FWHM Gaussian beams for the CO 2-1 and HCN 1-0 lines respectively. The rms noise after CLEANing is 1 mJy beam-1 in the HCN 1-0 maps, and 4 mJy beam-1 in the higher resolution CO 2-1 maps.
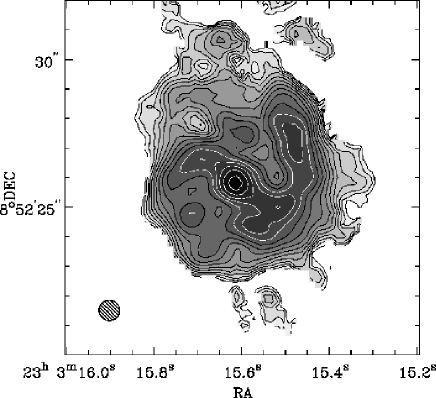
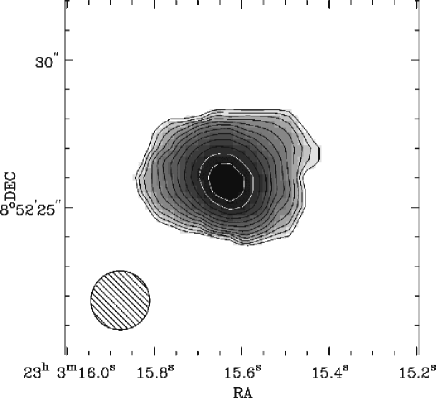
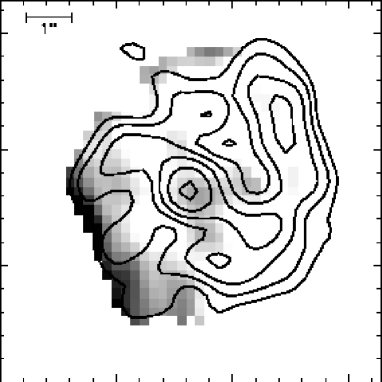
The CO is centered kinematically at km s-1, consistent with that found by Meixner et al. (1990) in their CO observations. The integrated CO 2-1 and HCN 1-0 line maps are shown in Fig. 1, while sample spectra from the central 3″ of the CO 2-1 channel maps are shown in Fig. 2. From this figure it can be seen that, even at sub-arcsecond resolution, we have achieved a signal-to-noise ratio of at least 20 throughout the central regions of NGC 7469.
2.2 Near Infrared Data
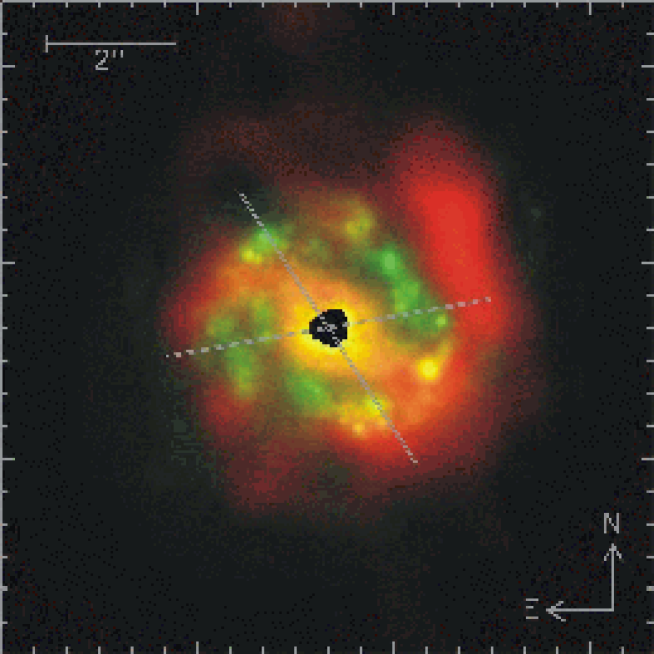
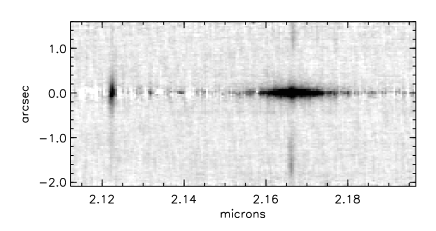
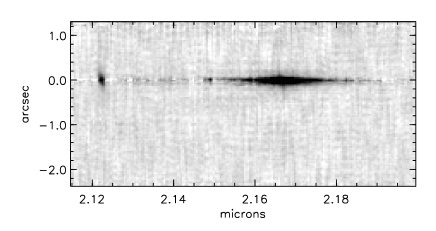
The data were obtained on the nights of 11–12 Nov 2002 using NIRSPEC behind the adaptive optics system on the Keck II telescope. Spectra were obtained in low resolution mode in the K-band, providing a nominal resolution of R=2000 with a slit 37 mas wide and 3.93″ long. The wavelength coverage is sufficient to include all the K-band in a single setting. Two position angles were used: 33∘ (to bisect two of the bright star forming knots in the K-band image of Scoville et al. 2000) and 100∘. The latter was chosen to include the supernova remnant (Colina et al., 2001), although this proved unsuccessful due to uncertainties in the positioning and the narrowness of the slit. The positions and widths of the slits are shown in Fig. 3 on top of a composite of the Hubble Space Telescope (HST) J-band image (green) and CO image (red). Individual exposures of 5 min were used, and the object was moved to a new pixel row after each exposure. In total integration times 85 min and 100 min were achieved at the two position angles respectively. Since the slit was not long enough to permit nodding, a few sky frames were taken. Standard calibrations were performed, including atmospheric standard stars (using the type B9 V star HD 218624), arcs, flatfields, and dark frames. The data were reduced using PC-IRAF 2.11.3 using standard techniques, with the single exception that all the frames were resampled at half the pixel scale before applying any rotation or curvature correction. The final step was to rebin the data once all the exposures were combined, providing a spectral scale of µm and a spatial scale of 34.8 mas. The resulting spectral resolution, as measured from the arc lamp lines, was 104 km s-1 FWHM. Continuum subtracted images of the spectral region covering the 1-0 S(1) and Br lines are shown in Fig. 5.
The reference for the adaptive optics system was NGC 7469 itself. The correction provided – and hence spatial resolution achieved – by the AO was similar on both nights due to the excellent atmospheric conditions. It was measured on the second night by taking a spectrum of a star, after using neutral density filters to reduce its count rate on the wavefront sensor to that measured on NGC 7469 itself. Additionally, the AO parameters (frame rate and gains) were set to those used on the object. The spectrum was reduced in exactly the same way. As expected, the resolution improves at longer wavelengths, but is measured to be 85 mas near the 1-0 S(1) and Br lines, and 80 mas near the CO absorption at 2.3µm. An alternative method to estimate the spatial resolution directly from the AGN itself is described in the text.
Flux calibration using the atmospheric standard star yielded K-band magnitudes of 13.97 and 14.01 within a 0.5″ length of the 37 mas slit, for position angles 33∘ and 100∘ respectively. Extrapolating the profile symmetrically over a circular aperture with diameter 0.5″ gives ; similarly in a 1″ aperture we find . However, we note that there is a considerable uncertainty associated with the calibration due to the difficulty of positioning both the standard star (with a diffraction limited FWHM of about 45 mas) and NGC 7469 (which had poorer correction) on a slit which is only 37 mas wide.
3 Molecular Gas
3.1 Distribution and Properties of the CO Emission
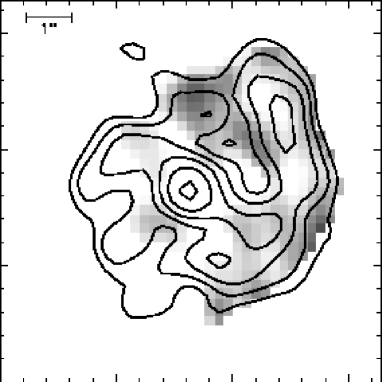
The main features in the 0.7″ resolution CO 2-1 map in Fig. 1 are a very bright marginally resolved central source, a partial ring or spiral arms at a radius of 1.5–2.5″ (500–800 pc), and a bright bar-like structure leading from the arms to the central source. The regions of CO emission are in general not coincident with the knots of K-band continuum emission, which trace the active star forming areas. This is easily seen in Fig. 3, which overlays the stellar light in green on the CO emission in red. We have used the HST J-band image for the stellar light because the contrast of the star forming knots is stronger than in the K-band, although in both bands the knots occur in the same places. For this figure, and in the analysis presented here, we have assumed that the nuclear near infrared and CO peaks are aligned. There is some suggestion that the dynamical centre and the CO peak may be offset by 0.1″ (which may be expected if, as we show in Section 3.3, the nuclear CO is distributed in a ring) and so it is possible that the CO and near infrared peaks are also slightly misaligned. However, because the offset is well within the resolution limits of the CO data and we have no other way to perform accurate astrometry for the spectroscopic data, we have ignored this small discrepancy. The figure shows that along the major axis (roughly north west) the star forming knots lie inside the ring of CO emission, while along the minor axis they overlap. The radio continuum images show a greater similarity to the CO map, with bright star forming regions at the ends of the bar (R2 and R3 in Colina et al. 2001), and tracing the same spiral/ring pattern as the CO 2-1 out to ″.
To compute the total line fluxes in the maps and the intensity-weighted mean velocity fields, we used uniformly weighted maps and ran the MOMENTS routine in the GIPSY package (van der Hulst et al., 1992). We did not include in the sum any emission below a limit of 2.5, and only included those features which were present in at least 2 adjacent line channels. The total CO 1-0 flux we observed was 300 Jy km s-1, consistent with that observed interferometrically by Meixner et al. (1990), and only sightly less than the 400 Jy km s-1 single dish flux of Papadopoulos & Seaquist (1998). We observe a total flux of 470 Jy km s-1 in the high resolution CO 2-1 map. Papadopoulos & Seaquist (1998) measure a flux of 800 Jy km s-1 with both the NRAO 12-m and the James Clerk Maxwell telescopes, indicating that we are missing 30–50% of the single dish flux after accounting for calibration uncertainties in all of the measurements. This missing flux likely comes from extended faint emission which is evident in the CO 1-0 map (see Tacconi & Genzel, 1996).
The detection of HCN in the nuclear region of the galaxy indicates the presence of dense gas, with molecular hydrogen volume densities of order cm-3. However, using the HCN/CO ratio to make quantitative statements is not possible since the abundance ratio is unknown: it typically lies in the range in quiescent clouds to in star forming cores (Blake et al., 1987), while Sternberg et al. (1994) have argued that in the nuclear regions of NGC 1068 it is more like .
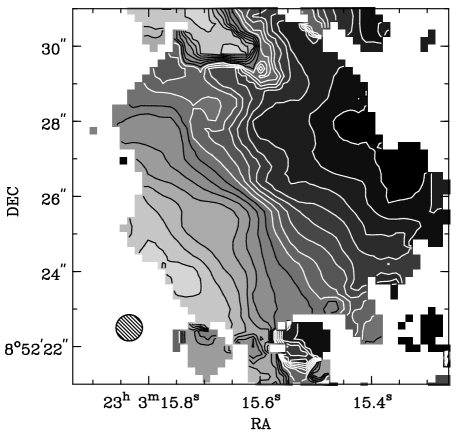
We have quantified the motions in the central few arcseconds of NGC 7469 by two different methods. First we solved for the velocity field using the ROTCUR task (Begeman, 1989) in the GIPSY data reduction package. This program divides the galaxy into a series of concentric tilted rings each having some circular velocity, and makes least squares fits to the kinematic parameters of the galaxy (van der Kruit & Allen, 1978). Although the program does not account for beam smearing effects, this is only a concern in the inner arcsecond where the rotation curve is steeply rising. In regions outside this, beam smearing effects are not as serious. We have fit for the rotation velocity and inclination angle by holding the kinematic position angle (PA=), the systemic velocity ( km s-1), and the position of the center of rotation constant as a function of radius. We have not extended the fit beyond a radius of about 3″. The velocity field found by this task is shown in Fig. 4.
In such fits the inclination angle is an uncertain parameter because it is degenerate with the actual rotation velocity. We are unable to constrain it using the ROTCUR task, and instead we consider the distribution of the CO emission knots around the nucleus. If these form a pair of spiral arms, the pitch angle should have no abrupt changes through the length of the arms (e.g. Combes et al., 1995). Fig. 1 clearly shows that in NGC 7469, if the features were continuous spiral arms, there would indeed be an abrupt change in their pitch angle. The alternative is to interpret the structure as a ring at a constant radius of about 2.5″ with a short pair of loosely wound spiral arms or a bar leading to them from the nucleus. With such a configuration, the inclination must lie in the range 45–50∘, consistent with the 45∘ inclination of the outer stellar disk (e.g. DeRobertis & Pogge, 1986; Marquez & Moles, 1994). We therefore adopt an inclination of 45∘ in this paper.
We estimate the uncertainty in the position angle from the beam size and the scale over which the fitting was performed, yielding . Inspection of the channel maps for the innermost CO data and also for the HCN data, reveals that there is no evidence for a different kinematic major axis between the ring and the nucleus: within the uncertainties all the data are consistent with a single major axis. Soifer et al. (2003) were able to resolve the nucleus of NGC 7469 at 12.5 m using adaptive optics on the Keck telescope, and measured a position angle of 135∘ for the emission on scales of 0.1″. This is consistent with the 128∘ we find, and supports our conclusion that the ring on scales of 3″ and the nucleus on scales of 0.7″ are oriented in the same plane.
The bar or spiral arm structure at a position angle of 56∘ is unique to the molecular gas and is evident neither in near infrared K-band images (Genzel et al., 1995; Lai et al., 1999; Scoville et al., 2000), nor in sub-arcsecond resolution 8 GHz radio continuum maps (Condon et al., 1991; Colina et al., 2001). If it were a bar, this would represent a very unusual configuration since stellar bars usually are seen together with, and more prominently than, molecular bars (e.g. Regan and Mulchaey, 1999; Sheth et al., 2002). It is, however, possible that the bar is an illusion, arising because the spatial scales are small – not much more than a few times the spatial resolution – which might lead to blending among different clumps of CO emission. This would be particularly noticeable along the minor axis, due to the 45∘ inclination, which lies close to the axis where the bar is seen. Such a possibility appears to be supported by the fact that our data for NGC 7469 exhibit none of the kinematic characteristics expected for a barred potential. The velocity field in Fig. 4 shows no evidence for the -shaped contours that arise in such cases (see van der Kruit & Allen, 1978, and references therein); on the contrary it is remarkably uniform. Additionally, there is no evidence for a tilted- pattern in the position-velocity (p-v) diagram taken along the bar axis (right panel in Fig. 8). These are characteristic of bar driven dynamics, and arise from the high velocities associated with the and orbits parallel and perpendicular to the bar. Because the orientation of the bar is less than 20∘ from the minor axis, the high speed motions in the orbits will be correspondingly close to the plane of the sky, and so may not be readily apparent in a p-v diagram; on the other hand, the orbits should be more easily detectable. However, the same blending as above, which might result in the illusion of a bar could also conspire to make non-circular motions extremely difficult to detect. Furthermore, the relatively bright disk component and the large turbulent velocity (see Section 3.3) of 60 km s-1 FWHM would tend to swamp and hide the effects of non-circular motions. An alternative might be that the structure is a pair of loosely wound spiral arms, which would be associated with smaller non-circular motions (Teuben, 2002) that might not be detectable in our data. Without a more complete dynamical analysis we can neither rule out nor confirm whether this apparent structure might be a bar or pair of spiral arms. We therefore defer a discussion of non-circular motions associated with spiral arms or a bar until later, and assume initially in our dynamical analysis in Section 3.3 that the kinematic structure can be modelled axisymmetrically.
3.2 Distribution and Properties of the 1-0 S(1) Emission
As has been seen in Fig. 5, strong narrow 1-0 S(1) emission was observed across the nucleus of NGC 7469 at both position angles. We have measured the flux and velocity at each point along the slit by fitting a Gaussian line profile to the 30 pixels (1800 km s-1) around the line in each row of the spectrum. Initially, the velocity dispersion was left as a free parameter. However, in every row of both position angles the derived value was consistent with a constant 210 km s-1 FWHM. We therefore fixed the dispersion at this value. Correcting for the instrumental resolution yields an intrinsic dispersion of 185 km s-1 FWHM.
The relative flux and velocity are shown in Fig. 9. The velocity zero point was taken as the velocity measured in the row where the continuum was a maximum, and was 4965 and 4950 km s-1 for the 2 position angles. The uncertainty in each velocity measurement was determined by constructing a 30 pixel segment, which had the same noise as the original residual spectrum (after subtracting the Gaussian), and to which the fitted Gaussian was added. A new Gaussian profile was then fitted to the segment, producing slightly different parameters. The procedure was repeated 100 times, providing an estimate of the uncertainties, which are shown as the error bars in the figure.
The total flux in a 0.5″ length of the slit is W m-2 and W m-2 for PAs 33∘ and 100∘ respectively. The H2 emission is easily resolved with FWHM of 0.45″ and 0.33″ at PAs 33∘ and 100∘ respectively. These sizes are several times larger than the spatial resolution, and so the difference can not be due to changes in the resolution on the two nights (see Section 4.2). We conclude that, from our line of sight, the H2 emitting region is asymmetrical, although with data from only two slit position angles, we cannot fully constrain its size and shape. An H2 1-0 S(1) image of NGC 7469 using the adaptive optics system on the Canada-France-Hawaii Telescope was presented by Lai et al. (1999). However, the difficulties of continuum subtraction, differing resolutions, and the bright nucleus, mean that no morphological information is available in the inner 0.5″.
3.3 A Single Kinematic Model for CO and H2
Following the method outlined in Tacconi et al. (1994), we have constructed kinematic models which can explain the various features observed in the kinematic major and minor axis p-v maps, and which also estimate the rotation velocities inside a radius of 5″. As a starting point, these models use the position angle and inclination derived previously and assume that all the gas lies in a thin disk in the plane of the galaxy. We then work towards an axisymmetric mass surface density model which matches the observed velocities in the p-v maps as closely as possible. Because the process converges to the final solution iteratively, the initial radial distribution is not critical. Ideally, to reduce the number of iterations one would consider the full mass distribution: of the stars (young and old populations) and the gas. However, this requires that the gas mass (i.e. the CO-to-H2 conversion factor) is known a priori – and we derive it afterwards in Section 3.5. As a starting point, if one assumes that the conversion factor is similar to that for the Galaxy, one finds that the gas mass dominates the total mass within a radius of a few arcsec. As we show in Section 3.5, in the central regions the molecular gas does indeed account for more than half of the total mass. In particular, if one considers only the region where there are recently formed stars, the annulus 1.3–2.3″, we find that the mass of molecular gas is approximately 4 times that of the young stars. We therefore use an initial radial mass distribution for our model based on the observed CO distribution.
The model allows us to define the mass surface density as a function of radius using any number of Gaussian distributions, each characterised by a relative scaling, a FWHM, and a radial offset. The mass of the whole system is then scaled to that needed to match the observed velocities for the given inclination. In the last two steps, the distribution is convolved spatially and spectrally. The spatial kernal is identical to the beam (0.7″ for the CO, 0.085″ for the H2). The spectral kernal represents the turbulent velocity, that is random motions on scales smaller than the beam. If this is small, the kernal can instead be used to represent the effect of the instrumental spectral resolution. We compare the model p-v distributions with the data, and adjust the radial mass distribution appropriately, iterating until there is sufficient agreement between model and data. This is a qualitative assessment, rather than a formal measurement of chi-squared. The reason is that in this situation — where the model is necessarily much simpler than the data — a chi-square value is often strongly affected by inhomogeneities in the data (which the model is not expected to duplicate) and a minimisation routine can easily converge to a model that a person would clearly see is wrong. We have therefore iterated on the model until it matches the main features in the data as well as possible. Using this method we have derived a single mass model which matches the kinematics from both the CO radio data and the near infrared H2 spectroscopic data at their different resolutions.
We have found that 3 components are needed to adequately match the data, scaled to a total dynamical mass of M⊙ within a radius of 5″. These are summarised in Table 2, and also in Fig. 6 which shows the mass surface density profile, the enclosed mass, and the resultant velocity in the plane of the galaxy as functions of radius. The broad disk component is represented by a Gaussian centered on the nucleus at ″ with a FWHM of 4.8″; the ring is defined by a Gaussian at ″ that has a FWHM of 0.8″, and with a peak intensity approximately twice that of the disk component; the nucleus itself is represented by a Gaussian at ″, a FWHM of 0.6″, and a peak approximately 4 times the disk component. Additionally, a turbulent velocity of 60 km s-1 FWHM for the CO, and 185 km s-1 FWHM for the 1-0 S(1), was needed to match the observed line widths. That the linewidth is much higher for the 1-0 S(1) may be because the near infrared H2 emission traces a hotter and more turbulent component of the molecular gas. The p-v diagrams for the major and minor axis of the CO emission are shown in Fig. 8. The equivalent diagrams for the H2 emission are in Fig. 9. In the latter figure, the model is drawn as a single line rather than contours because otherwise the large line width makes it difficult to compare to the data. The velocity dispersion is dominated by the turbulent component and hence is nearly constant across the central regions, as measured in the data.
The nuclear component of the model can be interpreted in 2 ways: either there is an approximately uniform mass distribution within a radius of about 0.3″ that then falls off like a Gaussian; or there is an inner ring peaking at a radius of about 0.2″ – with the caveat that if the innermost H2 lies in a ring, its rotation curve yields a measure of the total mass inside that radius but provides no information about its distribution there. Although the dynamical model cannot distinguish between these two options, we show in Section 4 that most of the mass inside this radius is due to stars rather than gas – and hence that the gas itself does lie in a ring. Additionally, the interpretation as a ring is more readily understood with respect to what is known about other similar galaxies. For example, CO observations of NGC 1068 (Helfer, 1997; Tacconi et al., 1997; Schinnerer et al., 2000), which is much closer at a distance of only 14.4 Mpc, indicate that this galaxy has a circumnuclear ring or spiral arms at 1 kpc, a nuclear ring at 70–100 pc, and a prominent bar (stellar and gas) between them. Our dynamical model of NGC 7469 suggests there is a circumnuclear ring at 750 pc and a nuclear ring at 65 pc, perhaps with short spiral arms or a bar between them.
In NGC 1068, Helfer (1997) finds non-circular motions associated with the bar and the spiral arms. Along the arms, the typical streaming motions show an ordered structure but are less than 30 km s-1; in the region of the bar the kinematics are dominated by non-circular motions. For our CO data on NGC 7469, a map of the velocity residuals, after subtracting the model from the data, is shown in Fig. 10. The standard deviation is 25 km s-1, and the strongest residuals are seen around the edges of the map where the flux is weakest and hence the uncertainties greater. There is no obvious residual structure along the bar axis, which is perhaps surprising given that, for example, Rozas et al. (2000) see a residual gradient from km s-1 to km s-1 along the bar in the ionised gas of NGC 3359. It would appear therefore that we can rule out the presence of a strong bar, which can result in residuals of at least this magnitude. On the other hand, spiral arms, which give rise to residuals of only 10–50 km s-1, may be present (Teuben, 2002). We assume that the bar or spiral pattern implied by the morphology is a real feature, but that the associated non-circular motions are too weak for us to detect and that there is little gas inflow in the region. Indeed, according to the conventional understanding, spiral arms or a bar are expected to exist if the rings are interpreted as occuring at specific resonances associated with spiral density wave theory. Under the assumption that the deviations from axisymmetrical orbits are small, we can use standard theory to estimate the pattern speed of the bar/spiral.
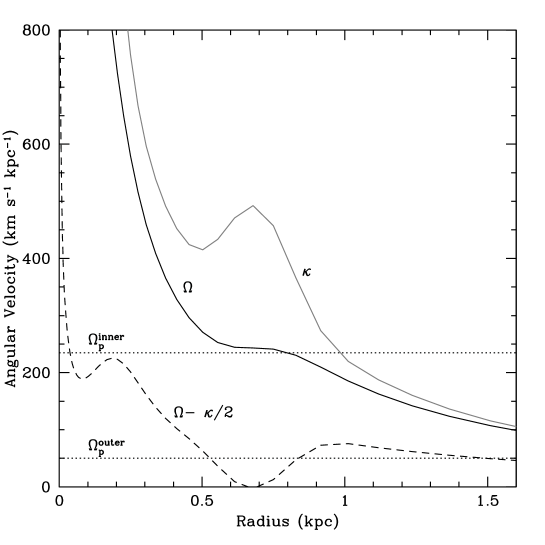
The epicyclic approximation (e.g. Binney and Tremaine, 1987) asserts that stellar orbits can be represented by the superposition of a prograde circular orbit with angular velocity and a retrograde elliptical orbit with frequency where . In an inertial frame the motion of these orbits forms unclosed rosettes. If a nuclear ring forms, it will do so in the vicinity of the inner Lindlad Resonances (ILRs) which occur where, in the frame rotating with the spiral pattern or bar with angular velocity , the orbits close up on themselves. Thus ILRs occur where . Co-rotation (CR) occurs where the pattern speed is the same as the orbital speed, . Recently, Regan and Teuben (2003) have shown that more fundamental than the ILRs to the existence of a nuclear ring is in fact the presence of orbits (perpendicular to the bar). A ring will form if the phase space filled by orbits is sufficiently high that the gas on these orbits interrupts the flow along orbits (parallel to the bar) where the two families of orbits intersect. The location of the nuclear ring moves inwards over time, as a result of inflow of gas from further out along the bar; and hence the location of the ring cannot necessarily be used to constrain the rotation curve of the galaxy. However, we have shown above that in the circumnuclear region of NGC 7469 the non-circular motions are weak and that there is little gas inflow. For a weak bar, the innermost and outermost extent of the orbits along the bar’s major axis are well represented by the location of the ILRs. On the other hand, Regan and Teuben argue that for strong bars the concept of ILRs is not really applicable since the and orbits form closed loops in the bar’s reference frame along their entire extent. How their theory relating the nuclear ring to orbits rather than ILRs should be applied to the case of multiple bars is not clear. Maciejewski and Sparke (2000) showed that a secondary (inner) bar results from a decoupling of the inner orbits: the and outer orbits behave as expected for the primary bar, while the inner orbits now form the backbone of the inner bar. That is, they are equivalent to its orbits. But it is not immediately obvious which orbits could then act as the equivalent of the inner bar’s orbits, thus allowing a secondary nuclear ring to form. Naively one would conclude that because there is no equivalent of orbits for the inner bar, then there can be no nuclear ring associated with it. However, this must happen since there are many observations of nested rings and bars. It is certainly clear that our understanding of bars, rings, and gas inflow is still developing. Nevertheless, under the assumption that the non-exisymmetric perturbations are relatively small and that the concept of ILRs retains some meaning, it is helpful to consider the rotation curve of NGC 7469 in the context of the epicyclic approximation.
Fig. 7 shows derived from our model, together with and . We emphasize that we are not trying to use the rotation curve to make predictions about the presence of nuclear rings, or vice-versa; instead we are using the rotation curve together with the observations of nuclear rings to try and make quantitative statements about the pattern speed of the spiral/bar structure. From the figure we estimate that the pattern speed at radii of 0.5–2″ is about 230–240 km s-1 kpc-1. Wilson et al. (1991) have argued that the circumnuclear ring at 2–3″ arises at the ILR of the large scale bar. If this is the case, then the ILR of the outer pattern occurs in the vicinity of the CR of the inner pattern, and we expect that the pattern speed of the primary bar is likely to be less than 80 km s-1 kpc-1. In the standard model of Maciejewski and Sparke (2000), such a spatial coincidence is required in order to reduce the number of chaotic zones around the resonances, and may in fact be natural in such dynamical systems (e.g. Tagger et al., 1987). However, Maciejewski (2002) argues that such resonant coupling hinders gas flow to the nucleus because there are no straight shocks along the inner bar. This could explain why we see no obvious streaming motions within the central few arcsec of NGC 7469.
A pattern speed of 200–250 km s-1 kpc-1 for the spiral/bar structure in the inner 800 pc may provide a natural explanation for why the star forming knots seen in the near infrared images are located at smaller radii than the ring of CO emission. If the K-band image of Scoville et al. (2000) is deprojected (using position angle 128∘ and inclincation 45∘), the knots of star formation lie between radii 1.3–2.3″. We suggest that they lie downstream of the spiral/bar pattern seen in the gas. Along the pattern, the gas density is locally increased and hence star formation is triggered. If we assume that we are seeing the star clusters at an age of 10 Myr (when they appear brightest in the K-band due to the appearance of late type supergiant stars), the spiral/bar pattern which triggered the star formation will have moved with respect to the stars in their orbits. Taking the angular velocities for the orbits and pattern from Fig. 7, we estimate that the distance amounts to 0.4–0.5 kpc (about 1/5 of a full circle) at a radius of 0.4 kpc (1.3″), but less than about 0.15 kpc at a radius of 0.7 kpc (2.3″) since this is close to co-rotation. Given also that the ages of the star clusters may differ from only a few Myr to more than 10 Myr, one might expect that the star forming knots are distributed a large part of the way around the central regions of the galaxy, extending away from the spiral/bar pattern but lying within the same radial range (i.e. inside the ring of CO emission). This is what the K-band images indicate.
Lastly, we briefly consider the black hole in the nucleus of NGC 7469. It’s mass has been estimated to be 3– M⊙ by using the timescale of the delay between UV and broad Balmer line variations together with the FWHM of the broad lines (Collier et al., 1998). Given that our mass model already has M⊙ within a radius of only 0.05″, the rotation curve is insensitive to the effects of such a low mass black hole at our spatial resolution and signal to noise; we can only distinguish models that have black hole masses exceeding M⊙.
3.4 Excitation of the 1-0 S(1) Emission
It is remarkable that the radial profile of the 1-0 S(1) emission is very different from that of the mass distribution in the model. In Section 3.3 we showed that the velocity curves of the CO and 1-0 S(1) lines indicate that the mass distribution in the nucleus is extended. If the 1-0 S(1) emission were to trace this distribution, the expected flux profile would be much broader and flatter than that observed (red curves in right panel of Fig. 9). We can rule out the possibility that the flux profile traces the underlying mass distribution by considering a model in which this is the case. In such a model, in order to match the velocities at radii beyond 0.5″, the mass of the nuclear ring has to be reduced by one third to M⊙, and the mass lost from it replaced by a nuclear core component of M⊙. The central part of the resulting rotation curve is much steeper than that actually observed (blue curves in Fig. 9). Additionally, there would be a measurable increase in the velocity dispersion from 185 to a maximum of nearly 210 km s-1 FWHM over the central 0.3″. With our preferred mass model, the dispersion increases by no more than a few km s-1 over the central 0.1″, consistent with the lack of any variation seen in the data. This result – that in NGC 7469 the 2 tracers of molecular hydrogen CO and 1-0 S(1) have different distributions – is in contrast to what is seen in NGC 1068. In that galaxy both the CO (Schinnerer et al., 2000; Baker, 2000) and the 1-0 S(1) (Rotaciuc et al., 1991; Blietz et al., 1994; Davies et al., 1998) trace the same distribution: a circumnuclear ring on scales of 70–100 pc.
We suggest that at least some, and perhaps most, of the H2 is excited by X-ray and UV irradiation from the AGN. By comparison to NGC 1068, one would be surprised if this were not the case: in that galaxy, which has a similar bolometric luminosity, the AGN is able to cause strong 1-0 S(1) emission even in the circumnuclear ring at a distance of 1 kpc (Davies et al., 1998). If the 1-0 S(1) were excited in this way in NGC 7469, then since the intensity of the X-ray and UV radiation would fall as , or even faster if dust attenuation is important, one would also expect a rapid decrease in the 1-0 S(1) intensity, as observed. Furthermore, the H2 morphology would depend largely on the details of the dust distribution and clumpiness, and would not necessarily reflect the distribution of the cold gas. One could test this conclusion further (Davies et al. in prep.) by obtaining a deep spectrum of the H2 lines to look for suppression of the 2-1 S(3) line, which Krabbe et al. (2000) claim to have seen in NGC 1275 and which may be a characteristic of X-ray irradiated gas (Black and van Dishoeck, 1987; Maloney et al, 1996).
3.5 CO-to-H2 Conversion Factor in the Circumnuclear Region
The stellar mass within a radius of ″ of the nucleus has been estimated by Genzel et al. (1995). In this Section, we estimate the dynamical and hence gas mass in the same region in order to determine the CO-to-H2 conversion factor for the inner 1.6 kpc of NGC 7469. We begin with the assumption that
| (1) |
where Mold is the mass in the old stellar population and Mburst is the stellar mass formed in a recent starburst.
To derive the mass of old stars, Genzel et al. 1995 measured the J-band flux density between the nucleus and the ring, and scaled this to the full aperture. Using a conversion factor between near infrared flux density and old stellar mass, they estimated that M⊙ is in the form of old stars. To determine the mass of recently formed stars, they used starburst models to calculate the parameters of the starburst ring. Their two favoured models imply young stellar masses of about M⊙. Hence, the total stellar mass in this region is M⊙.
In Section 3.3 we found that for an inclination of 45∘, the dynamical mass within 5″ is M⊙; within a radius of 2.5″ it is M⊙. The difference between this estimate and that in Genzel et al. (1995) is due to their assumption of an isotropic velocity field for the late type stars causing the 2.3 µm CO absorption. If instead the stars move primarily in a low inclination disk plane (a logical conclusion for a young starburst in which the red supergiants dominate the 2 µm emission), the observed velocities and velocity dispersions become smaller than the intrinsic ones and the discrepancy vanishes.
The mass estimates above lead us to conclude that the total gas mass in the same region is M⊙, more than the total mass of stars and several times more than the mass of recently formed stars in the ring. It is therefore apparent that there is still sufficient gas to continue forming stars for a considerable time. To get to the molecular gas mass, we assume that the masses of HI and HII are negligible contributions to the gas mass at radii interior to 2.5″, and correct for the mass due to helium (40%). We find a H2 mass of M⊙ within this region.
We can now use this mass to derive a CO-to-H2 conversion factor and compare it to the Galactic conversion factor between N(H2) and CO integrated intensity of H2 cm-2 (K km s-1)-1 (Strong et al., 1988). In terms of the mass of H2, the relationship can be written as
| (2) |
where is the distance to the source. Our previous observation of NGC 7469 in the CO 1-0 line (with a spatial resolution of 2.5″) with the IRAM interferometer yielded a total flux of 300 Jy km s-1, roughly half that seen in the single dish spectrum of Heckman et al. (1989). A crude correction for the possibly missing flux can be made by assuming that the remaining flux is distributed in a smooth source ″ across, the size of structure which would have just been resolved out by the IRAM interferometer. The “surface brightness” of such a structure would be 0.8 Jy km s-1 arcsec-2. Within a radius of 2.5″ the CO 1-0 flux is 100 Jy km s-1. Including the correction for the possibly missing flux raises this to a maximum of 116 Jy km s-1. Solving for in the mass equation yields . The uncertainty of this value is not trivial to estimate. Accounting for the stellar masses and missing CO flux puts it at about 30%. Uncertainty in the inclination is also important: a 5∘ change will alter the dynamical mass by 17% and hence the gas mass by 29%. Combining these we estimate a total uncertainty of about 40% on the conversion factor we have calculated, so that it could lie in the range –0.8.
There is mounting evidence that the CO-to-H2 conversion factor in intense star forming environments is less than that for the Milky Way. Solomon P. et al. (1997) and Downes & Solomon (1998) found that for ultraluminous galaxies the difference was about a factor five. They argued that in such cases, it is the warm diffuse phase of the CO that dominates the emission, rather than the denser clouds from which the conversion factor is measured in the Milky Way. This effect was also observed for NGC 7469 by Papadopoulos & Allen (2000). While we do not find a discrepancy as large as theirs, within the uncertainties our result tends in the same direction.
4 The Nuclear Star Cluster
4.1 As Measured by the CO Absorption
The nuclear K-band light from NGC 7469 is a combination of thermal emission from hot dust associated with the AGN and stellar light, which can be traced through the CO 2-0 bandhead absorption longward of 2.29µm in the spectra of late type stars. Although the hot dust emission can dramatically reduce the equivalent width of the stellar absorption features, it does not change their “flux” (absolute absorption). Hence, under the assumption that the stellar types dominating the CO features are invariant throughout the nuclear cluster, the spatial extent of the CO flux directly traces the spatial extent of the stellar cluster.
To determine the extent of the CO absorption, we have measured the flux in the wavelength range 2.293-2.302 µm. The continuum level has been determined from an extrapolation of a linear fit to the 2.086–2.293 µm range (excluding the region around the Br line). The (relative) CO flux at both position angles is shown as the solid line in the upper panel of Fig. 11, and has been directly resolved in both cases.
The equivalent widths of the CO bandhead are similar at both position angles, with Å in a 0.5″ length of the slit. By comparison to similar values for late type stars, one can in principle estimate the fraction of stellar light in the nucleus. However is very dependent on stellar type, and hence on the age of any star forming episode. To have a measurable CO absorption, a star cluster must be at least 10 Myr old. At this age late type supergiants dominate; but as the age increases giant stars dominate more. To quantify this effect, we have measured the equivalent width of the CO bandhead in the same wavelength range for several different stellar templates (from Wallace and Hinkle, 1997) and find – Å depending on stellar type, as shown in Table 3: Å for late type dwarfs, – Å for giants, – Å for supergiants. These values suggest that stars could contribute anything in the range 5–40% of the observed continuum at 2.3 µm. Lower fractions would apply if supergiants dominate the K-band continuum, and higher fractions for giants; dwarf stars are unlikely to dominate the spectrum due to their intrinsic faintness.
4.2 As Measured by the Continuum Slope
An alternative and completely independent method to estimate the size and brightness of the stellar cluster is to use the slope of the continuum. We have adopted an iterative procedure to decompose the continuum into stellar and thermal (hot dust) parts in each spatial row of the spectrum. Initially, we assume that all the flux in the spatial row where the continuum is a maximum is due to hot dust. We can then make an initial estimate of its temperature by calculating the spectral shape of the hot dust component and comparing it to that observed. The second step needs in addition a stellar template of a late type star. We use the K1.5 Ib HR 8465 from Wallace and Hinkle (1997), although the exact type does not matter as the slopes of all cool stars are similar. We scale these two components to match as well as possible the observed continuum spectral shape in each other row of the spectrum. The stellar cluster is traced through the scaling applied to the stellar template, and yields a smooth profile except for the few rows near the centre. One can interpolate over these to estimate what the stellar contribution in this region should be. Subtracting this from the continuum of the central row used in the initial step leaves something that is closer to the original assumption that (the remaining spectrum in) this row is pure hot dust, and allows one to make a new estimate of the hot dust temperature. The procedure is repeated until the fit converges. Because this process uses the whole slope of the continuum, it provides a high signal-to-noise measurement of the spatial profiles of the hot dust core and stellar cluster. On the other hand, it is rather sensitive to errors in the slope of either the object spectrum or the standard star used to calibrate out atmospheric features.
Since extinction acts to modify the spectral slope, we need to ask whether the results are affected by ignoring it. For the stellar light, one can examine the spectral shape at an offset of 0.2″ from the continuum peak – where stellar light dominates the emission but also where there is still enough flux for a reliable measurement. We find here that the measured continuum slope matches the stellar template slope well, indicating that there is probably very little reddening of the observed emission. For the hot dust emission, there is a degeneracy between the temperature of the dust and the extinction towards it. Without extinction, we derive a characteristic temperature of K. The spectral shape of this blackbody can be reproduced almost exactly by reddening a blackbody with a higher characteristic temperature. Thus, if sublimation limits the maximum temperature of dust grains to K, we can constrain the maximum foreground exinction screen to have mag. Thus, while reddening can change the derived temperature of the hot dust component, it does not affect the relative scaling between this and the stellar light.
The results of the fitting procedure are shown in the lower panels of Fig. 11. The hot dust core (dotted line) has a narrower profile than the observed continuum (solid line), and provides a measure of the spatial resolution achieved. At PA 33∘ (first night), its FWHM is 118 mas, compared with 146 mas for the full continuum; at PA 100∘ (second night), its FWHM was 80 mas (cf. 104 mas for the full continuum), similar to that measured on the PSF calibrator. The difference may be due to a better AO correction on the second night.
The profile of the stellar cluster has been plotted (suitably scaled) in the upper panels of the figure. At both position angles, there is excellent agreement between this profile and that measured from the CO bandhead; the measured FWHMs are 223 mas at PA 33∘, and 115 mas at PA 100∘. This difference is much greater than that in the core noted above, and cannot be due solely to the AO performance: at both position angles the stellar cluster is clearly resolved. Applying a quadrature correction for the finite resolution, one derives an intrinsic FWHM of 0.189″ at PA 33∘, equivalent to 60 pc at the distance of NGC 7469. Similarly, at PA 100∘ the size is 26 pc. These values are similar to the derived 45 pc size of the stellar cluster around NGC 1068 (Thatte et al., 1997). However, unlike that cluster the one in NGC 7469 appears to be distinctly non-axisymmetric. With measurements at only 2 position angles one cannot fully determine the morphology, although based on the current observations the cluster does lie fully within the region enclosed by the nuclear ring.
From the scaling of the stellar light component, we find that in a 0.5″ length of the slit, it contributes % of the continuum at 2.3m (at both position angles). This is consistent with the upper end of the range derived from the CO flux in Section 4.1, as well as the work of Mazzarella et al. (1994) based on PAH emission. These authors found that 25% of the total 3.28 m PAH emission occurs within a radius of 1″ from the nucleus, and they concluded that at least 1/3 of the nuclear K-band light in this region originates in star formation. A stellar light fraction close to 40% would tend to suggest that, based on the equivalent widths measured in Section 4.1, it is late G and early K type giants which dominate the stellar light. However, this is an implausible average stellar type. Population synthesis indicates that once the supergiant phase is past, an average type K4–5 III is more likely. It is possible, therefore, that the “continuum slope” method above has overestimated the stellar contribution, and that a fraction closer to 20% is more realistic.
An alternative approach to estimate the stellar content of the nuclear cluster is to use the stellar mass and K-band magnitude as constraints on evolutionary synthesis models. The mass model we derived in Section 3.3 indicates that within a radius of 0.10″ (chosen to match the FWHM of the nuclear star cluster) the total mass is only M⊙. The mass of stars in the cluster cannot exceed this. The magnitude along the slit within ″ was found in Section 2.2 to be mag; within ″ it is only 0.1 mag fainter. Extrapolating to a 0.2″ circular aperture increases the brightness to (0.8 mag fainter than for a 0.5″ aperture). The stellar light is effectively all included within such an aperture. If we assume a Salpeter IMF, solar metallicity, and continuous star formation, the evolutionary synthesis model Starburst 99 (Leitherer et al., 1999) allows us to use the magnitude and mass limit above to constrain the fraction of stellar light and the age of the star cluster. In order to avoid exceeding the mass, the K-band stellar light fraction must be less than 50%. if it lies in a range 20–30% the age of the star formation is constrained to be 10–60 Myr (older ages are only possible if the stellar light fraction is lower). This yields masses between M⊙ for younger ages and M⊙ for older star formation. There is no set of parameters which yield a significantly lower mass. Given the uncertainties involved, the estimates of the stellar light fraction, the stellar types, the star formation age, and the mass of the cluster fit together in a remarkably consistent way. We conclude that at least half, and probably most, of the mass within 0.1″ of the nucleus of NGC 7469 is due to stars rather than gas.
Using the same star formation models, one finds that the bolometric luminosity for the nuclear cluster is 1–2 L⊙. Genzel et al. (1995) estimated the nuclear bolometric luminosity to be L⊙. Hence, star formation accounts for 10% of the nuclear luminosity at radii small than 0.1″.
5 Conclusions
We have presented 0.7″ radio CO 2-1 observations and 0.085″ adaptive optics K-band spectroscopy of the central region of NGC 7469. Using these data we have investigated the distribution and kinematics of the cold and warm molecular gas across nearly 2 orders of magnitude in spatial scale. Additionally, we have studied the nuclear stellar cluster.
The kinematics of the CO 2-1 and 1-0 S(1) lines can be reproduced by an axisymmetric mass model consisting of a broad disk component, a circumnuclear ring at 2.3″, and a nuclear ring at 0.2″. The CO 2-1 morphology also suggests that there may be a bar or pair of spiral arms between the two rings, although there is no kinematical signature in the data. This may be because NGC 7469 represents the case where straight shocks cannot form along an inner bar, and hence there is no gas inflow. Nevertheless, the increase in gas density in the bar/spiral may have triggered star formation and this is now seen as the knots of emission – which lie inside the radius of the molecular ring.
Comparison of the dynamical and stellar masses indicates that molecular gas makes up more than half of the total mass within a radius of 1 kpc, and that the remaining gas mass is at least several times that of recently formed stars in the ring. The CO-to-H2 conversion factor is 0.4–0.8 times the Galactic conversion factor. Similar values have been seen a number of times in intense star forming environments.
The profile of the 1-0 S(1) emission does not trace the gas distribution, and much of the flux is likely to arise instead from X-ray and UV irradiation of gas by the AGN.
By mapping the stellar CO absorption and considering the slope of the continuum, we have directly resolved the nuclear stellar cluster in NGC 7469. It is extended over 30–60 pc and contributes 20–30% of the nuclear K-band continuum, and about 10% of the nuclear bolometric luminosity. The stellar mass counts for at least half, and probably more, of the total mass within 30 pc (0.1″) of the nucleus.
References
- Baker (2000) Baker A.J., 2000, PhD thesis, California Institute of Technology
- Begeman (1989) Begeman K., 1989, A&A, 223, 47
- Binney and Tremaine (1987) Binney J., Tremaine S., 1987, in Galactic Dynamics, Princeton University Press, Princeton
- Black and van Dishoeck (1987) Black J., van Dishoeck E., 1987, ApJ, 322, 412
- Blake et al. (1987) Blake G., Sutton E., Masson C., Phillips T., 1987, ApJ, 315, 621
- Blietz et al. (1994) Blietz M., Cameron M., Drapatz S., Genzel R., Krabbe A., van der Werf P., Sternberg A., Ward M., 1994 ApJ, 421, 92
- Colina et al. (2001) Colina L, Alberdi A., Torrelles J., Panagia N., Wilson A., 2001, ApJ, 553, L19
- Collier et al. (1998) Collier S., et al., 1998, ApJ, 500, 162
- Combes et al. (1995) Combes F., Boissé P., Mazure A., Blanchard A., 1995, in Galaxies and Cosmology, Springer (Berlin Heidelberg)
- Condon et al. (1991) Condon J., Huang Z.-P., Yin Q., Thuan T., 1991, ApJ, 378, 65
- Cox (2000) Cox A., 2000, editor, Allens’ Astrophysical Quantities, Springer (New York)
- Davies et al. (1998) Davies R., Sugai H., Ward M., 1998, MNRAS, 300, 388
- DeRobertis & Pogge (1986) DeRobertis M., Pogge R., 1986, AJ, 91, 1026
- Downes & Solomon (1998) Downes D., Solomon P., 1998, ApJ, 507, 615
- Draine et al. (1983) Draine B., Roberge W., Dalgarno A., 1983, ApJ, 264, 485
- Genzel et al. (1995) Genzel R., Weitzel L., Tacconi-Garman L.E., Blietz M., Cameron M., Krabbe A., Lutz D., Sternberg A., 1995, ApJ, 444, 129
- Guilloteau et al. (1992) Guilloteau S., et al., 1992, A&A, 262, 624
- Heckman et al. (1989) Heckman T., Blitz L., Wilson A., Armus L., Miley G., 1989, ApJ, 342, 735
- Helfer (1997) Helfer T., 1997, Ap&SS, 248, 51
- Krabbe et al. (2000) Krabbe A., Sams B., Genzel R., Thatte N., Prada F., 2000, A&A, 354, 439
- Lai et al. (1999) Lai O, Rouan D., Alloin D., 1999, in Astronomy with Adaptive Optics, eds Bonaccini D., pub ESO, p.555
- Laine et al. (2002) Laine S., Shlosman I., Knapen J., Peletier R., 2002, ApJ, 567, 97
- Leitherer et al. (1999) Leitherer C., et al., 1999, ApJS, 123, 3
- Maciejewski and Sparke (2000) Maciejewski W., Sparke L., 2000, MNRAS, 313, 745
- Maciejewski (2002) Maciejewski W., 2002, in Disks of Galaxies: Kinematics, Dynamics and Perturbations, ed. Athanassoula E., Bosma A., Mujica R., ASP Conf. Ser. 275
- Maciejewski et al. (2002) Maciejewski W., Teuben P., Sparke L., Stone J., 2002 MNRAS, 329, 502
- Maloney et al (1996) Maloney P., Hollenbach D., Tielens A., 1996, ApJ, 466, 561
- Martini and Pogge (1999) Martini P, Pogge R., 1999, AJ, 118, 2646
- Marquez & Moles (1994) Marquez I., Moles M., 1994, AJ, 108, 90
- Mauder et al. (1994) Mauder W., Wiegelt G., Appenzeller I., Wagner S., 1994, A&A, 285, 44
- Mazzarella et al. (1994) Mazzarella J., Voit G., Soifer B., Matthews K., Graham J., Armus L., Shupe D., 1994, AJ, 107, 1274
- Meixner et al. (1990) Meixner M., Puchalski R., Blitz L., Wright M., Heckman T., 1990, ApJ, 354, 158
- Miles et al. (1994) Miles J., Houck J., Hayward T., 1994, ApJ, 425, L37
- Papadopoulos & Seaquist (1998) Papadopoulos P., Seaquist E., 1998, ApJ, 492, 521
- Papadopoulos & Allen (2000) Papadopoulos P., Allen M., 2000, ApJ, 537, 631
- Regan et al. (1999) Regan M., Sheth K., Vogel S., 1999, ApJ, 526, 97
- Regan and Mulchaey (1999) Regan M., Mulchaey J., 1999, AJ, 117, 2676
- Regan and Teuben (2003) Regan M., Teuben P., 2003, ApJ, 582, 723
- Rotaciuc et al. (1991) Rotaciuc V., Krabbe A., Cameron M., Drapatz S., Genzel R., Sternberg A., Storey J., 1991, ApJ, 370, L23
- Rozas et al. (2000) Rozas M., Zurita A., Beckman J., Pérez D., 2000, A&AS, 142, 259
- Schinnerer et al. (2000) Schinnerer E., Eckart A., Tacconi L.J., Genzel R., Downes, D., 2000, ApJ, 533, 850
- Scoville et al. (2000) Scoville N., et al., 2000, AJ, 119, 991
- Sheth et al. (2002) Sheth K., Vogel S., Regan M., Teuben P., Harris A., Thornley M., 2002, AJ, 124, 2581
- Shlosman and Heller (2002) Shlosman I., Heller C., 2002, ApJ, 565, 921
- Soifer et al. (2003) Soifer B., Bock J., Marsh K., Neugebauer G., Matthews K., Egami E., Armus L., 2003, AJ, 126, 143
- Solomon P. et al. (1997) Solomon P., Downes D., Radford S., Barrett J., 1997, ApJ, 478, 144
- Sternberg & Dalgarno (1989) Sternberg A., Dalgarno A., 1989, ApJ, 338, 197
- Sternberg et al. (1994) Sternberg A., Genzel R., Tacconi L.J., 1994, ApJ, 436, L131
- Strong et al. (1988) Strong A., Bloemen J., Dame T., Grenier I., Hermsen W., 1988, A&A, 201, 1
- Sugai et al. (2000) Sugai H., Davies R., Ishii M., Ward M., 2000, MNRAS, 317, 447
- Tacconi et al. (1994) Tacconi L.J., Genzel R., Blietz M., Cameron M., Harris A., Madden S., 1994, ApJ, 426, L77
- Tacconi & Genzel (1996) Tacconi L.J., Genzel R., 1996, in Science with Large Millimeter Arrays, ed P. Shaver, Springer (Berlin), p.125
- Tacconi et al. (1997) Tacconi L.J., Gallimore J., Genzel R., Schinnerer E., 1997, Ap&SS, 248, 59
- Tagger et al. (1987) Tagger M., Sygnet J., Athanassoula E., Pellat R., 1987, ApJ, 318, L43
- Teuben (2002) Teuben T., 2002, in Disks of Galaxies: Kinematics, Dynamics and Perturbations, ed. Athanssoula E., Bosma A., Mujica R., ASP Conf. Ser. 275
- Thatte et al. (1997) Thatte N., Quirrenbach A., Genzel R., Maiolino R., Tecza M., 1997 ApJ, 490, 238
- van der Hulst et al. (1992) van der Hulst J., Terlouw J., Begeman K., Zwitzer W., Roelfsema P., 1992, in Astronomical Data Analysis Software and Systems I, eds. D. Worall, C. Biemesderfer, J. Barnes, ASP Conference Series No. 25, p. 131.
- van der Kruit & Allen (1978) van der Kruit P., Allen R., 1978, ARA&A, 16, 103
- Wallace and Hinkle (1997) Wallace L., Hinkle K., 1997, ApJS, 111, 445
- Wilson et al. (1991) Wilson A., Helfer T., Haniff C., Ward M., 1991, ApJ, 381, 79
| Component | Value |
|---|---|
| CO 1-0 flux (2.0″ resolution) | 300 Jy km s-1 |
| CO 2-1 flux (0.7″ resolution) | 470 Jy km s-1 |
| Inclination | 45∘ |
| Position Angle | 128∘ |
| Systemic Velocity | 4925 km s-1 |
| Dynamical Mass (within ″) | M⊙ |
| Component | Radial Offset | FWHM | Peak | Mass |
|---|---|---|---|---|
| ″ | ″ | Scaling | M⊙ | |
| disk | 0.0 | 4.8 | 1.5 | 3.97 |
| ring | 2.3 | 0.8 | 3.3 | 4.15 |
| nucleus | 0.2 | 0.6 | 9.3 | 0.88 |
Note. — All components are Gaussians, and trace the mass surface density distributions. In the model this is the same as the light surface density.
| starr | stellar | Mass | |||
|---|---|---|---|---|---|
| type | () | (Å) | |||
| HD 213758 | M1 I | 16 | 32.5 | ||
| HR 8726 | K5 Ib | 13 | 23.3 | ||
| HR 8465 | K1.5 Ib | 13 | 21.0 | ||
| HR 4517 | M1 III | 1.2 | 17.9 | ||
| HR 6705 | K5 III | 1.2 | 17.3 | ||
| HR 7806 | K2.5 III | 1.2 | 13.2 | ||
| HR 8694 | K0 III | 1.1 | 8.3 | ||
| HR 6703 | G8.5 III | 1.1 | 5.3 | ||
| HR 8085 | K5 V | 0.7 | 5.9 | ||
| HR 1084 | K2 V | 0.7 | 4.0 |