Further multiwavelength observations of the SSA22 Ly emitting ‘blob’
Abstract
We present new follow-up observations of the sub-mm luminous Ly-emitting object in the SSA22 galaxy overdensity, referred to as ‘Blob 1’ by Steidel et al. (2000). In particular we discuss high resolution Hubble Space Telescope optical imaging, Owens Valley Radio Observatory spectral imaging, Keck spectroscopy, VLA 20 cm radio continuum imaging, and Chandra X-ray observations. We also present a more complete analysis of the existing James Clerk Maxwell Telescope sub-mm data. We detect several optical continuum components which may be associated with the core of the submillimeter emitting region. A radio source at the position of one of the HST components (22:17:25.94, +00:12:38.9) identifies it as the likely counterpart to the submillimeter source. We also tentatively detect the CO(4–3) molecular line, centered on the radio position. We use the CO(4–3) intensity to estimate a limit on the gas mass for the system. The optical morphology of sources within the Ly cloud appears to be filamentary, while the optical source identified with the radio source has a dense knot which may be an AGN or compact starburst. We obtain a Keck-LRIS spectrum of this object, despite its faintness (). The spectrum reveals weak Ly emission, but no other obvious features, suggesting that the source is not an energetic AGN (or that it is extremely obscured). We use non-detections in deep Chandra X-ray images to constrain the nature of the ‘Blob’. Although conclusive evidence regarding the nature of the object remains hard to obtain at this redshift, the evidence presented here is at least consistent with a dust-obscured AGN surrounded by a starburst situated at the heart of this giant Ly cloud.
Subject headings:
cosmology: observations – galaxies: evolution – galaxies: formation – galaxies: starburst1. Introduction
Deep surveys of the submillimeter (sub-mm) sky using the Submillimeter Common-User Bolometer Array (SCUBA) on the James Clerk Maxwell Telescope have uncovered a population of distant dust-rich galaxies (see Blain et al. 2002 and references therein). Based on the radio/sub-mm indices, optical colors, and the spectroscopic identifications for submillimeter galaxies, the majority of these systems are thought to lie at redshifts of –4 (e.g. Smail et al. 2002, Chapman et al. 2003a, 2004).
Identifying the counterparts of sub-mm sources at other wavelengths has proven difficult, due to the large beamsize of sub-mm instruments, and the inherent faintness of the sources at all shorter wavelengths. The radio regime has emerged as an efficient means to pin-point the sub-mm sources (through the FIR/radio relation, e.g. Helou et al. 1985; Condon 1992), however when radio emission cannot be detected, the only recourse is to use millimeter interferometry to attempt to localize the source.
The first well-studied sub-mm system SMM J02399–0136 (hereafter SMM J02399) at was shown to contain both an AGN (Ivison et al. 1998) and a massive reservoir of molecular gas thought to be fueling a starburst (Frayer et al. 1998). This scenario is increasingly becoming the conventional paradigm for the sub-mm population. This is perhaps unsurprising, given that both AGN and starbursts are thought to be triggered by galaxy interactions (e.g. Sanders et al. 1988, Archibald et al. 2002). With the proliferation of spectroscopic redshifts for sub-mm sources, many showing AGN features (Chapman et al. 2003a, 2004), detecting molecular CO gas has become almost routine (Frayer et al. 1998, 1999; Neri et al. 2003; Greve et al. 2004).
Sub-mm sources identified in the optical are typically suggestive of mergers in progress, based mainly on ground-based images of disturbed, multiple component structures (e.g., Smail et al. 2002, Ivison et al. 2002). However, imaging at HST resolution exists for very few sub-mm sources, making the detailed morphological study of sub-mm galaxies difficult. HST imaged examples of 12 robustly identified SCUBA galaxies reveal the ground-based structure to be often a complex of many smaller fragments (Chapman et al. 2003b). The fragmented, merger morphology of SCUBA galaxies observed by HST in the SA13 deep field (Sato et al. 2002), and of the SCUBA luminous Lyman-break galaxy, Westphal-MMD11 (Chapman et al. 2002) seem representative of the sub-mm population.
One of the intrinsically brightest sub-mm sources yet discovered is the SSA22-‘Blob 1’ (Chapman et al. 2001), lying in the overdense core of a possible proto-cluster of galaxies at (Steidel et al. 2000). The nature of this source remains enigmatic, despite the existing multi-wavelength detections and deep ground-based imagery and spectroscopy. The extent to which this object is representative of high- sub-mm detections is, as yet, quite unclear. It was targeted with SCUBA only after the extended Ly emission was already known. However, highly clustered environments may be typical of many blank field sub-mm galaxies (Blain et al. 2004). In addition, extended gaseous haloes have been detected around several other sub-mm galaxies: SMM J02399 (Ivison et al. 1998), 4C41.17 (Ivison et al. 2000b), SMMJ 17142, in the field of radio galaxy 53W002 (Smail et al. 2003a) and SMM J16034 (Smail et al. 2003b). Whether representative or unique, the combination of extended Ly emission and the presence of large amounts of dust (which is effective at destroying Ly) is surprising and merits further study. Some ideas for what may be going on include: a superwind from an extreme starburst (Taniguchi, Shioya & Kakazu 2001; Ohyama et al. 2003); cooling radiation in a forming galaxy halo (Fardal et al. 2001); or some contribution from the Sunyaev-Zel’dovich effect increment. Chance superposition or the effects of gravitational lensing can also complicate the interpretation.
In this paper we present new Hubble Space Telescope optical imaging, Keck-LRIS spectroscopy, as well as OVRO CO(4–3) measurements and a re-analysis of the available SCUBA, VLA-radio, and Chandra X-ray data. We use this combination of multi-wavelength data to localize the sub-mm emission within the optical/near-IR images and to discuss the spectral energy distribution (SED) of the ‘Blob’. All calculations assume a flat CDM cosmology with and km s-1 Mpc-1, so that 1 arcsec corresponds to 8.2 kpc at , where the luminosity distance is 28360 Mpc.
2. Observations and Analysis
2.1. HST-Visible observations
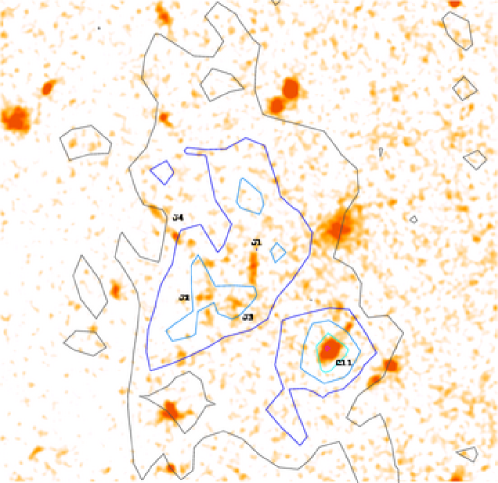
HST imaging was obtained with the Space Telescope Imaging Spectrograph (STIS). Three orbits of LOW SKY integration time were split between six exposures, using the 50CCD-clear filter, providing 7020 sec. Pipeline processed frames were calibrated, aligned, and cosmic ray rejected, using standard IRAF/STSDAS routines. The pixel size in the STIS image is 0.0508″. The sensitivity limit reached is mag (5), corresponding to for a point source with a late-type spiral galaxy SED. The 50CCD-clear filter is roughly a Gaussian with 1840Å halfwidth and an effective wavelength of 5733.3Å. We refer to the associated AB magnitude as hereafter. The STIS image is presented in Fig. 1 with a Ly outline overlaid (Bower, private communication). The relative astrometry was carried out by matching all bright sources, providing a relative positional error of 0.28″.
Whereas no optically detected continuum sources were present within the core of the Ly cloud from the ground based imagery in Steidel et al. (2000), we find several compact and distorted sources in the deep HST-STIS imagery (Fig. 1), labeled J1, J2, J3 and J4. However, comparison of our HST image with the Ly contours from Steidel et al. (2000) and Bower et al. (2004), suggests that these HST sources do not always trace the density of Ly. For example, there was no narrow-band knot at the position of J1 or J4, although J2 and J3 sit near Ly peaks. The 1″aperture magnitudes for the different components using the SExtractor package (Bertin & Arnouts 1996) are: J1; J2; J3; and J4. Only the J2 component is detected in the band (, Steidel et al. 2000).


2.2. OVRO CO(4–3) observations
SSA22-‘Blob 1’ was observed using the Owens Valley Millimeter Array over 8 hour tracks scheduled through March and June of 2001. A total of 28 hours of high quality integration time on-source was obtained in good winter weather conditions, in two configurations of six m telescopes. The phase center for the CO observations was the position of the brightest near-IR component of the SSA22-‘Blob 1’ cloud identified as an Extremely Red Object (ERO) in Steidel et al. (2000), which we now refer to as J2: (J2000)=, (J2000)=. The CO(4–3) line was observed using a digital correlator configured with MHz channels, centered on GHz in the lower side-band, corresponding to CO(4–3) emission at a redshift of .
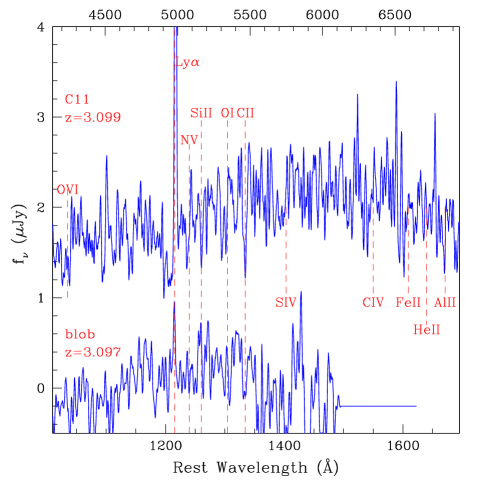
Choosing an observing frequency for molecular lines is difficult when only the Ly emission line redshift is known. The closest bright Lyman Break Galaxy in the proto-cluster is C11, with for Ly. The redshift for the Ly knot 7″ farther along the slit, and associated with the source, is identical within the errors. Using the interstellar absorption lines for LBG-C11 gives . From near-IR spectroscopy, the systemic redshift is typically half-way between the Ly and absorption redshifts (Pettini et al. 2001, Adelberger et al. 2003), suggesting . However, there is no detected continuum in the spectrum of J2 and it is not clear that the same estimate should necessarily apply. Hence the uncertainty in the systemic redshift is probably around . The Keck spectrum of SSA22-‘Blob 1’ (see below) shows weak Ly in emission, to the red of LBG-C11 (or at a redshift ). The low S/N of the spectrum, coupled with uncertainties in the systemic redshift suggest that this new information would not improve the estimated redshift for the CO measurement.
Typical single-sideband system temperatures were approximately 400–K, corrected for telescope losses and the atmosphere. In addition to the CO line data, we recorded the mm continuum data with a GHz bandwidth for both the upper (line-free, centered on GHz) and lower sidebands. The nearby quasar 2213+035 was observed every 25 minutes for gain and phase calibration. Absolute flux calibration was determined from observations of Uranus, Neptune, and 3C 273. The absolute calibration uncertainty for the data is approximately 15%. The 95% confidence upper-limit for the continuum emission is Sν(3 mm) mJy. This is insufficient to detect the expected thermal dust emission discovered by SCUBA, assuming a dust spectrum .
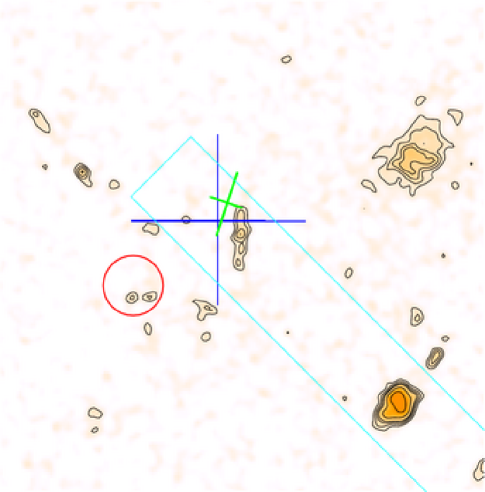
Fig. 2 shows the CO(4–3) spectral map for the ‘Blob’. The CO line is tentatively detected at a redshift offset MHz from our central frequency, corresponding to shift to the red. The line width is estimated at FWZI. We achieved a detection for the peak in the integrated CO(4–3) map (upper frequency half-band map). The CO position appears offset to the north by 2″ from the ERO/Ly peak position. The OVRO beamsize (4″ by 6″) is shown as inset, while the beam pattern sidelobes are shown in the middle panel. An apparent excess power at the sidelobe positions of our SSA22-‘Blob 1’ CO map is consistent with a tentative detection. The CO map shows no obvious evidence for extended emission. The lower frequency half-band map is also shown in Fig. 2 (right panel), finding no sources above 3, and no sources within 10″ of the center. We caution that the noise from the interferometer is unlikely to be Gaussian, and the 3 noise limit could be an underestimate.
We interpret the OVRO data as a marginal detection of the CO line, of width around – the Gaussian width we will assume for the analysis of the molecular gas properties in §3.4.
2.3. VLA Radio Observations
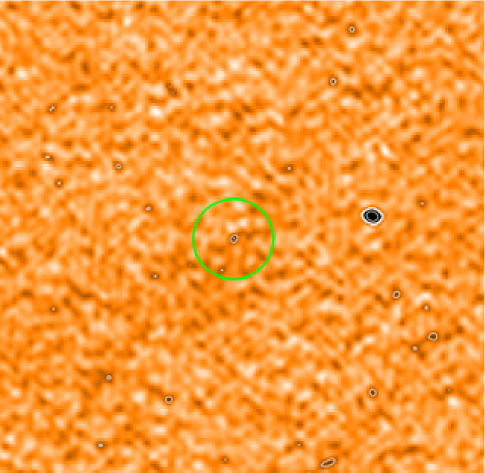
VLA observations were obtained in the ‘A’ (36 hours) and ‘B’ (12 hours) configuration at 1.4 GHz. The map reaches an r.m.s. sensitivity of 8.5 Jy near the phase center of the map. Reductions and details are described elsewhere (R.J. Ivison, in preparation). We used these observations to search for a radio counterpart to the sub-mm source in order to pin-point the location of the far-IR emission (Fig. 2.3). A 4.4 radio source is detected at the optical position of J1, 22:17:25.94 +00:12:38.9 in the radio FK5 grid, lying well within the SCUBA beam. The primary beam corrected flux of the radio source is 44.410.1 Jy. The detection is significant above the non-Gaussian phase noise in the interferometric data (Richards 2000), as the only peak (positive or negative) within the square arcmin region of Fig. 2.3 other than the neighboring bright radio source 20″ to the West. At this corresponds to a luminosity of . The neighboring western radio galaxy (188 Jy peak, 242 Jy integrated) identifies a second SCUBA detection in the field (Fig. 2.5) at 22:17:24.682 +00:12:42.02.
2.4. Chandra X-ray Observations
A 70 ksec Chandra ACIS-I integration was taken, centered on the SSA22 field. The data were procured from the Chandra archive and searched in the vicinity of SSA22-‘Blob 1’. No significant counts were recorded over the ‘Blob-1’ region, where a limit of 85 counts was achieved (although the adjacent candidate sub-mm source 30″ to the West has a weak X-ray counterpart). This limit on extended emission over the Ly ‘Blob’ is not very restrictive, with 2.8 from the 0.2–keV band for a 4 keV thermal spectrum at . In our adopted cosmology, this translates to , which corresponds only to the upper mass range of rich galaxy clusters (e.g. Edge 2003). The point source limit for ‘J1’ however, is much more restrictive (), well within the regime of local low-luminosity AGN, similar to Seyfert galaxies.
2.5. SCUBA Sub-mm Observations
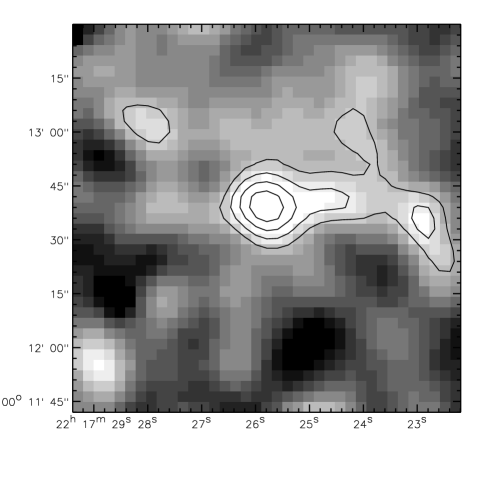
We have also obtained new SCUBA observations of the ‘Blob’. These jiggle-map mode observations were taken during April 2001. In addition, archival observations (PI: A. Barger) covering part of the region were retrieved and combined with the new data. The final combined map detects the main SSA22-‘Blob 1’ source with mJy, mJy. The separate data sets yield consistent results. We checked that there is no indication that the core of the source is extended, although there seems to be extent in the emission towards the west. This may simply be confusion with other apparent sources more than a beam-width away in the SCUBA m image. This significant () extention of the central source, peaking 21″ to the West of SSA22-‘Blob 1’, is identified with a bright (188 Jy peak) radio source.
The range of structures present in this field, and the multiple chop throw angles used for the different subsets of the data, may give rise to artificial structures caused by off-beams. The S/N of the image does not merit a detailed deconvolution. The combined SCUBA image is shown in Fig. 2.5.
2.6. Keck-LRIS spectroscopy of ‘Blob 1’
Keck LRIS spectroscopy of the ‘Blob’ HST identified source (J1) was taken using the 400 lines/mm grism, providing a spectral resolution of 10Å (Fig. 5). A slitlet was positioned on the source J1, with a position angle of , allowing the LBG, C11, lying 7″ southwest of J1 to also be aligned on the slit (Fig. 5, offset brighter spectrum). This facilitated the 1-dimensional extraction of the extremely faint continuum of J1. The spectrum shows detected Ly emission, and possibly low significance features commonly found in LBG spectra (Shapley et al. 2003).
Ohyama et al. (2003) also recently presented optical spectroscopy of the ‘Blob’ using SUBARU-FOCUS. While their deep -band image detects the HST sources (J1, J2, J3, J4) in 0.5″ seeing, their spectrograph slit position misses all these components.
The weak Ly line in J1 shows a rest equivalent width of Å and an essentially unresolved width (). The lack of detectable high ionization lines (CIV, SIV), and the relatively narrow Ly line suggest that an energetic AGN is unlikely to be present (or else it is highly obscured). There is a redshift offset to the red in J1 from the Ly peak of the LBG C11, corresponding to a shift of . However, large offsets from systemic velocities due to stellar winds are likely (Adelberger et al. 2003), and we cannot interpret this offset as physical displacement. We note that the redshift of the peak in the tentative CO measurement is very close to the J1 Ly peak ( redwards of the J1 Ly ).
3. Results
3.1. Spectral Energy Distribution
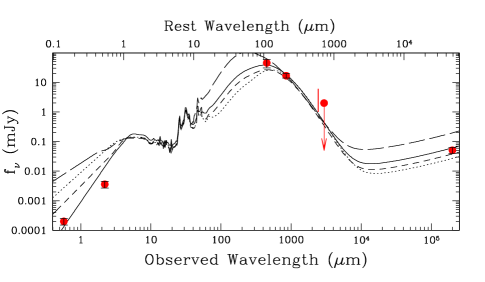
A spectral energy distribution (SED) for the ‘Blob’ with all the new data points and upper limits is shown in Fig. 6. In particular we have indicated the OVRO continuum limit as well as the marginal line detection. A range of dust temperatures are reflected by the four overlaid SED templates (25, 29, 34 and 50 K, for a dust emissivity ), with the 34 K SED fitting the sub-mm points the best. The direct extrapolation of this SED to the radio using the far-IR/radio correlation (Helou et al. 1985) is consistent within the error bars of our radio detection.
The various optically detected fragments are fainter than 80% of SCUBA galaxy identifications (Chapman et al. 2003b), however the components vary considerably in their color. A steep () power-law is required for consistency with the limit on ‘J1’.
3.2. The location of the sub-mm emission
Since the ‘Blob’ appears to be a unique object, we would like to relate the emitting regions at various wavelengths in order to study its physics. The radio source is coincident with the source, J1, to within the astrometric errors aligning the optical/radio frames (0.4″). The relative astrometry between the OVRO/SCUBA data and the HST frame is achieved by mapping the SSA22 radio sources onto a deep -band image and matching the HST sources to this frame.
The r.m.s. variation in pointing errors with the JCMT/SCUBA observations were typically throughout these observations, as measured by offsets to pointing sources, and this dominates the centroiding of the sub-mm source. Assuming that we can pin-point a source to the FWHM divided by 2.35 times the signal-to-noise ratio, and adding the errors in quadrature, the estimated error in the SCUBA position is about 3″. This error is overlaid on the HST image with the large cross in Fig. 1. From the tentative CO(4–3) detection from the OVRO peak, we obtain a centroiding error 0.6″, dominating the positional uncertainty of the phase reference. This is shown with the smaller cross in Fig. 1.
The most likely association of the OVRO/SCUBA source is therefore with the 51 Jy radio source corresponding to the brightest linear feature in the HST image, denoted J1 in Fig. 1. We can therefore likely rule out J2 or J3 as contributing significantly to the submillimeter emission. Note that the component J2 is the ERO source described in Steidel et al. (2000), which we now measure to have . As this is not the source of the sub-mm emission, it is at odds with findings from other sub-mm systems, that nearby ERO components, often seem to be the sub-mm source (Smail et al. 2000; Frayer et al. 2000, 2003, 2004; Webb et al. 2004). J1 has an , to the 3 limit of our -band data.
3.3. Linear Features in the HST Image
We also note the striking linear structure between J1 and J2 that sticks out towards the NE – labeled J4 in Fig. 1). At approximately 5 arcsec in length, this is quite unusually long and linear compared with chain-like galaxies (e.g. Cowie et al. 1995) in similar HST images.
Could this linear object-chain be jet-induced star-formation from the hidden AGN in J1 (or perhaps from another AGN in J2 or even in C11?). This is similar to what was suggested might be the case in 53W002 at (Windhorst, Keel & Pascarelle 1998). If so, it is curious that we see no jet-like radio or X-ray source, in fact no radio or X-ray source is seen at all at the position of J4 (although a weak radio source does identify the J1 optical feature). With little detailed information, we can offer little more than speculation. The optical ‘jet’ may not dim as much as it would in the radio or X-ray, since here we may be possibly looking at a string of star-bursting knots – putatively all induced by the AGN jet – but each essentially unresolved by STIS.
The unresolved peak within the linear structure of J1 is at least suggestive of an AGN, although without other diagnostics, we cannot rule out a compact starburst. The apparent limit on the X-ray emission is not sufficient to rule out an obscured AGN. Spatially resolved spectroscopy along the axis of the linear feature could in principle differentiate emission mechanisms, however, the fragment is extremely faint in the optical and our present Keck-LRIS spectrum likely represents the best practical quality achievable with a 10 m class telescope.
3.4. Molecular gas
The limit on the integrated CO(4–3) line flux from the marginal detection of the ‘Blob’ represents . No adjustment has been made to account for the continuum level since it appears to be negligible. The observed CO(4–3) line flux (peaking at mJy) implies an intrinsic CO line luminosity (see the formulae in Solomon, Downes, & Radford 1992). The CO luminosity is related to the mass of molecular gas (including He) by , with the value for expected to be , consistent with that estimated for local ultraluminous infrared galaxies (ULIGs; Solomon et al. 1997). We then adopt a correction for the excitation CO(4–3):CO(1–0) brightness ratio of typically observed in starbursts (Devereux et al. 1994), yielding . The inferred limit on the molecular gas mass of the ‘Blob’ is , which is consistent with that of the most massive low-redshift ULIGs (Sanders & Mirabel 1996).
With the addition and refinement of data points along the SED, we can also fit a dust temperature. Fixing the dust emissivity at , we find a best fit T K, colder than the typical Td found locally for sources extrapolated to this luminosity (Chapman et al. 2002). The implied gas-to-dust ratio is then 220. This gas-to-dust ratio is at the lower end of the range of values seen in spiral galaxies (Devereux & Young 1990), local ULIGs (Sanders et al. 1991), and certainly other high-redshift CO sources. Hence the ‘Blob’ seems to represent a cooler system with different molecular gas properties than other high- sub-mm galaxies, or local galaxies with comparable far-IR luminosities.
4. Discussion
Having detected multiple irregular, and apparently filamentary sources lying within the Ly cloud, it is tempting to attribute the Ly emission to the ionizing photons from starbursts or AGN in these objects. The HST-identified features are suggestive of the first generation of merging between substantial fragments of galaxies. We note that planar structures in the galaxy formation process, or sequential star formation may also lead to such configurations , although the scales of the HST fragments in the ‘Blob’ are larger than any objects identified as ‘chain galaxies’ in Cowie, Hu, Songaila (1995). We further note that the radio-identified object, J1, which we identify with the sub-mm source, lies in an apparent Ly cavity in the integral field data of Bower et al. (2004), suggesting that huge winds may be driven by this object.
Many pieces of evidence are consistent with this starburst scenario. There are no obvious signatures of AGN, with non-detections in moderately deep X-ray measurements, a weak radio source consistent with the local far-IR–radio correlation (and thus suggestive of a starburst), and a rest-frame UV spectrum which is inconsistent with an energetic AGN.
One problem with this scenario is that the equivalent width of the Ly halo, under Case-B assumptions, would imply a difference in the apparent and required continuum luminosities of a factor 2300. Even with very red spectra, it is impossible that a correction to the star formation rates of the linear sources could be this large (although for the most luminous infrared galaxies seen locally, the star formation rates are factors of 100 larger than implied by the detectable UV emission – Goldader et al. 2002).
One object which may be rather similar to the ‘Blob’ is SMMJ 17142+5016, in the field of radio galaxy 53W002 at . This object is clearly identified as an AGN with an extended Ly halo (Smail et al. 2003a). SMM J163650.0+405733 is also identified with an AGN, in the halo of extended Ly and [OIII] (Smail et al. 2003b). The lack of obvious signatures of AGN activity in the ‘Blob’, and the clear presence of AGN in many other similar objects, suggest that we seriously consider the possibility that an AGN is present in SSA22-‘Blob 1’.
In this case, jet induced star formation may well be responsible for many of the HST fragments, as is likely the case in classical radio galaxies (e.g. Pentericci et al. 1999). If the extended NE structure (J4) represents emission from an AGN jet, the jet would then be roughly inclined at to the plane of the sky, potentially also explaining why the AGN itself is not seen directly in the X-ray (its soft X-rays are mostly obscured by the dust torus). This might also explain the general shape of the huge Ly reflection cloud, which might be interpreted loosely as a triangular structure, in this case with a very wide opening angle (). One might speculate even further about a counter cloud emanating from J1 in the other direction towards C11. The scenario is similar to that outlined for the radio-loud AGN, 53W002 (Windhorst et al. 1998), but on a much larger scale. Deeper observations might indicate whether this picture is correct.
A likely scenario for the ‘Blob’ is then a buried AGN. The Chandra non-detection in the X-ray at first seems difficult to reconcile with the copious Ly extended emission. However, it is much easier to obscure a compact X-ray emitting source that to preclude scattered photons from escaping and ionizing the surrounding medium. As with all submillimeter galaxies, the explicit presense or absense of an AGN does not necessitate that it dominate the bolometric energy. Ongoing star formation with cycles of AGN activity are the most likely scenario in the core of this massive proto-cluster region. For now, we consider it a triumph that we have finally been able to pin down the location of the submm and UV emission in this enigmatic object.
5. Conclusions
The SSA22-‘Blob 1’ object is still mysterious – containing strong dust and Ly emission coexisting in an environment that shows no unambiguous signs of AGN activity. A buried AGN may be the most likely explanation from energetic grounds alone, but this needs to be confirmed through some clear sign of AGN activity. High ionization lines in the mid-IR (15m) may be detectable in the ‘Blob’ with SIRTF-LWS if excited by a dust-obscured AGN (see e.g., Rigopoulou et al. 1999). It might still be that cooling radiation from a forming halo plays a role (Fardal et al. 2001). Further data will be required to determine whether multiple processes contribute to the Ly emission, and how these are related to the sub-mm source. Meanwhile it is worth investigating the relationship between Ly and sub-mm emission for a wider sample of objects, to determine how unique the SSA22-‘Blob 1’ object really is.
References
- (1)
- (2) Adelberger K., Steidel C., 2000, ApJ, 544, 218
- (3)
- (4) Adelberger K., Steidel C., Shapley A., Pettini M., 2003, ApJ, 584, 45
- (5)
- (6) Archibald E., et al., 2001, MNRAS, 323, 417
- (7)
- (8) Almaini O., Lawrence A., Boyle B.J., 1999, MNRAS, 305, L59
- (9)
- (10) Archibald E.N., Dunlop J.S., Jiminez R., Friaca A.C.A., McLure R.J., Hughes D.H., 2002, MNRAS, 336, 353
- (11)
- (12) Bertin A., Arnouts S., 1996, A&AS, 117, 393
- (13)
- (14) Blain A.W., Smail I., Ivison R.J., Kneib J.-P., Frayer D., 2002, Phys. Rep., 369, 111
- (15)
- (16) Blain A.W., Chapman S.C., Smail Ian, Ivison R.J., 2004, ApJ, submitted
- (17)
- (18) Bower R., et al. 2004, MNRAS, submitted
- (19)
- (20) Calzetti D., 1997, AJ, 113, 162
- (21)
- (22) Carilli C.L., et al, 2001, ApJ, astro-ph/0103252
- (23)
- (24) Carilli C.L., Yun M.S., 2000, ApJ, 539, 1024
- (25)
- (26) Chapman S.C., Smail I., Ivison R.J., Blain A.W., 2002, MNRAS, 335, 17
- (27)
- (28) Chapman S.C., et al., 2001, ApJ, 548, L17
- (29)
- (30) Chapman S.C., et al., 2003a, Nature, 422, 695
- (31)
- (32) Chapman S.C., et al., 2003b, ApJ, 585, 57
- (33)
- (34) Chapman S.C., Blain A., Smail I., Ivison R.J., 2004, ApJ, submitted
- (35)
- (36) Cowie L., Hu E., Songaila A., 1995, AJ, 110, 1576
- (37)
- (38) Condon J., 1992, ARA&A, 30, 575
- (39)
- (40) Dale D., et al., 2001, ApJ, 562, 142
- (41)
- (42) Devereux N., Taniguchi Y., Sanders D.B., Nakai N., Young J.S., 1994, AJ, 107, 2006
- (43)
- (44) Devereux N.A., Young J.S., 1990, ApJ, 359, 42
- (45)
- (46) Eales S., Lilly S., Webb T., Dunne L., Gear W., Clements D., Yun M., 2000, AJ, 120, 2244
- (47)
- (48) Edge, A., 2003, Carnegie Observatories Astrophysics Series, Vol. 3: Clusters of Galaxies: Probes of Cosmological Structure and Galaxy Evolution, ed. J.S. Mulchaey, A. Dressler, and A. Oemler (Cambridge: Cambridge Univ. Press), astro-ph/0307150
- (49)
- (50) Fardal M.A., Katz N., Gardner J.P., Hernquist L., Weinberg D.H., Davé R., 2001, ApJ, 562, 605
- (51)
- (52) Frayer D. T., Armus L., Scoville N.Z., Blain A.W., Reddy, N.A., Ivison, R.J., Smail, Ian, 2003, AJ, 126, 73
- (53)
- (54) Frayer D., Smail Ian, Ivison R.J., Scoville N.Z., 2000, AJ, 120, 1668
- (55)
- (56) Frayer D., et al., 1999, ApJ, 514, 13
- (57)
- (58) Frayer D., et al., 1998, ApJ, 506, 7
- (59)
- (60) Frayer D., Reddy N., Armus L., Blain A., Scoville N., Smail I., 2004, ApJ, in press
- (61)
- (62) Goldader J., Meurer G., Heckman T., Seibert M., Sanders D., Calzetti D., Steidel C., 2002, ApJ, in press, astro-ph/0112352
- (63)
- (64) Greve T., et al., 2004, MNRAS, submitted
- (65)
- (66) Helou G., et al., 1985, ApJ 440, 35
- (67)
- (68) Ivison R., et al., 1998, MNRAS, 298, 583
- (69)
- (70) Ivison R., et al., 2000a, MNRAS, 315, 209
- (71)
- (72) Ivison R., Dunlop J.S., Smail I., Dey A., Liu M.C., Graham J.R., 2000b, ApJ, 542, 27
- (73)
- (74) Ivison R., Smail I., Frayer D., Kneib J.-P., Blain A.W., 2001, ApJ, 561, L45
- (75)
- (76) Ivison R., Smail I., et al., 2002, MNRAS, 337, 1
- (77)
- (78) Le Févre O., Abraham R., Lilly S. J., Ellis R.S., Brinchmann J., Schade D., Tresse L., Colless M., Crampton D., Glazebrook K., Hammer F., Broadhurst T., 2000, MNRAS, 311, 565
- (79)
- (80) Magorrian J., et al., 1998, AJ, 115, 2285
- (81)
- (82) Meurer G.R., Heckman T.M., Calzetti D., 1999, ApJ, 521, 64
- (83)
- (84) Neri R., et al., 2003, ApJL, in press
- (85)
- (86) Ohyama Y., et al. 2003, ApJ, 591, L9
- (87)
- (88) Pentericci L., et al. 1999, A&A, 341, 329
- (89)
- (90) Pettini M., et al., 2001, ApJ, 554, 981
- (91)
- (92) Richards, E. A. 2000, ApJ, 533, 611
- (93)
- (94) Rigopoulou, D., et al., 1999, AJ, 118, 2625
- (95)
- (96) Sanders D.B., Mirabel I.F., 1996, ARAA, 34, 749
- (97)
- (98) Sanders D.B., Scoville N.Z., Soifer B.T., 1991, ApJ, 370, 158
- (99)
- (100) Sanders D.B., Soifer B.T., Elias J.H., et al., 1988, ApJ, 325, 74
- (101)
- (102) Sato Y., Cowie L.L., Kawara K., Taniguchi Y., Sofue Y., Matsuhara H., Okuda H., 2002, ApJ, 578, L23
- (103)
- (104) Scoville N. Z., Yun M. S., Bryant P. 1997, ApJ, 484, 702
- (105)
- (106) Shapley A., et al., 2003, ApJ, 588, 65
- (107)
- (108) Shapley A., Steidel C., Adelberger K., Dickinson M., Giavalisco M., Pettini M., 2001, ApJ, 562, 95
- (109)
- (110) Smail I., Ivison R.J., Blain A.W., Kneib J.-P., 2002, MNRAS, 331, 495
- (111)
- (112) Smail I., Ivison R.J., Gilbank D.G., Dunlop J.S., Keel W.C., Motohara K., Stevens J.A., 2003a, ApJ, 583, 551
- (113)
- (114) Smail I., et al., 2003b, MNRAS, 342, 1185
- (115)
- (116) Solomon P.M., Downes D., Radford S.J.E., Barrett J.W., 1997, ApJ, 478, 144
- (117)
- (118) Steidel C., et al., 2000, ApJ, 532, 170
- (119)
- (120) Steidel C., Pettini M., Hamilton D., 1995, AJ, 110, 2519
- (121)
- (122) Taniguchi Y., Shioya, Y., Kakazu Y., 2001, ApJ, 532, L13
- (123)
- (124) Webb, T., Brodwin, M., Lilly, S., Eales, S., 2004, ApJ, in press
- (125)
- (126) Windhorst R.A., Keel W.C., Pascarelle S.M., 1998, ApJ, 494, L27
- (127)
- (128) Windhorst R.A., et al., 2002, ApJS, 143, 1
- (129)