LYCEN 2003-36
October 15th, 2003
Calibration of the EDELWEISS Cryogenic Heat-and-ionisation Germanium Detectors
for Dark Matter Search
The EDELWEISS Collaboration:
O. Martineau1, A. Benoît2, L. Bergé3, A. Broniatowski3, L. Chabert1, B. Chambon1, M. Chapellier4, G. Chardin5, P. Charvin5,6, M. De Jésus1, P. Di Stefano1, D. Drain1, L. Dumoulin3, J. Gascon1, G. Gerbier5, E. Gerlic1, C. Goldbach7, M. Goyot1, M. Gros5, J.P. Hadjout1, S. Hervé5, A. Juillard3, A. de Lesquen5, M. Loidl5, J. Mallet5, S. Marnieros3, N. Mirabolfathi6, L. Mosca5,6, X.-F. Navick5, G. Nollez7, P. Pari4, C. Riccio5,6, V. Sanglard1, L. Schoeffel5, M. Stern1, L. Vagneron1
1Institut de Physique Nucléaire de Lyon-UCBL, IN2P3-CNRS,
4 rue Enrico Fermi, 69622 Villeurbanne Cedex, France
2Centre de Recherche sur les Très Basses Températures,
SPM-CNRS, BP 166, 38042 Grenoble, France
3Centre de Spectroscopie Nucléaire et de Spectroscopie de Masse,
IN2P3-CNRS, Université Paris XI,
bat 108, 91405 Orsay, France
4CEA, Centre d’Études Nucléaires de Saclay,
DSM/DRECAM, 91191 Gif-sur-Yvette Cedex, France
5CEA, Centre d’Études Nucléaires de Saclay,
DSM/DAPNIA, 91191 Gif-sur-Yvette Cedex, France
6Laboratoire Souterrain de Modane, CEA-CNRS, 90 rue Polset,
73500 Modane, France
7Institut d’Astrophysique de Paris, INSU-CNRS,
98 bis Bd Arago, 75014 Paris, France
Abstract
Several aspects of the analysis of the data obtained with the cryogenic heat-and-ionisation Ge detectors used by the EDELWEISS dark matter search experiment are presented. Their calibration, the determination of their energy threshold, fiducial volume and nuclear recoil acceptance are detailed.
1 Introduction
The dominant ( 90%) component of the mass budget of the Universe may consist in Weakly Interacting Massive Particles (WIMPs), which could be the Lightest Supersymmetric Particles (neutralinos in most models)111 See e.g. [1] for a review.. WIMPs would be present at the galactic scale as a halo of mass typically ten times larger than the visible part of the galaxy. The EDELWEISS collaboration has developped heat-and-ionisation Ge detectors [2] to measure recoils induced by elastic scattering of galactic WIMPs on a target nucleus. Constraints on the spin-independent WIMP-nucleon cross-section in the framework of the Minimal SuperSymmetric Model (MSSM) have been derived from the nuclear recoil rate measured with the EDELWEISS detectors [3], [4]. We present in this paper the experimental details of these measurements. In Section 2, we describe briefly the experimental setup and the method of detection of an energy deposit in the target. We then show the calibration procedure for the heat and ionisation signals (Section 3), the trigger threshold determination (Section 4) and the tagging of the nuclear recoils (Section 5). We finally present an original method to determine the fiducial volume of the detectors (Section 6).
2 The EDELWEISS detectors
2.1 Experimental setup
The experimental setup of the EDELWEISS-I experiment is described in [3] and [4]. We simply recall that up to three
detectors can be housed in a low background dilution cryostat working at a regulated temperature (27 mK in
[3] and 17 mK in [4]). The EDELWEISS detectors
are made of a germanium absorber (target for the incident particles) equiped with a thermal sensor and with
metallic electrodes for charge collection. The
simultaneous measurement of both phonons and charges created by a single interaction is therefore possible.
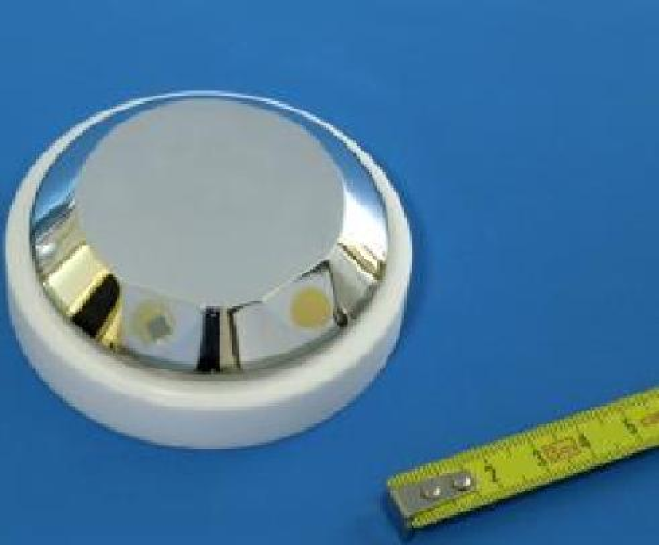
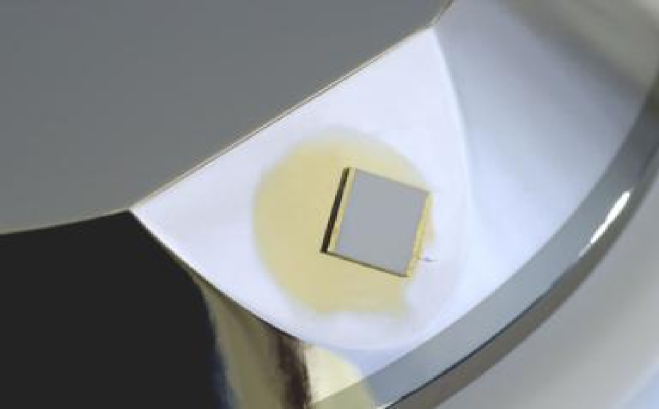
The main characteristics of the detectors studied in this article are given in Table 1. For all of these detectors, the absorber is a 320 g Ge cylindrical
crystal (70 mm diameter and 20 mm thickness). Their edges have been beveled at an angle of 45o (Fig. 1).
The electrodes for ionisation measurement are made of
100 nm Al layers sputtered on the surfaces after etching. The top electrode is divided in a central part and a guard ring, electrically
decoupled for radial localization of the charge deposition. The bottom electrode is the common reference. For the GGA1 and GGA3 detectors (GSA1 and GSA3), a
60 nm hydrogenated amorphous germanium (silicon) layer was deposited under the electrodes in order to reduce the charge
collection problems associated with events where the energy is deposited close to the detector surface. It
has indeed been shown that the probability that charge carriers be collected on the same-sign electrode during
the diffusion phase which preceeds the charge collection (dead layer problem) is reduced for this type of
detectors [5, 6].
The thermal sensor consists of a Neutron Transmutation Doped germanium crystal (NTD)222The NTD thermal
sensors have been produced by Torre and Mangin for GeAl6 and by Haller-Beeman Associates for the other
detectors.,
close to the metal-insulator transition. It is glued on a sputtered gold pad near the edge of the bottom Al
electrode (Fig. 1). The resistance of the DC-polarized
GeAl6 sensor was chosen to be 3 M for GeAl6 (27 mK), and ranged from 3 M to 6 M at 17 mK for the other detectors.
Reliable electrical contacts and heat links have been achieved by the ultrasonic bonding of gold wires (diameter 25 m) on
gold pads. The thickness of these pads has been chosen to minimize the production of dislocations in the absorber caused by the bonding.
A thermal analysis of the detectors will be published in Ref. [6].
2.2 Detection method
The rise in temperature due to an energy deposit in the absorber gives rise to a variation of the thermal sensor resistance. When the sensor is polarized by a constant current , then induces a voltage fluctuation across the resistor, which corresponds to the heat signal:
| (1) |
The ionisation signal is obtained by collection of the electron-hole pairs created by
the interaction in the germanium crystal polarized through a bias voltage applied to the electrodes. A low bias voltage333
During the data takings, the bias voltage applied to the top electrode varied from 3 V to 9 V depending on the detector.
is required to limit the heating of the cristal due to the drift of the charge carriers, known as the Neganov-Luke effect [7].
The energy deposited by a particle interacting in the detector can be determined by subtracting the
Neganov-Luke effect from the heat signal :
| (2) |
where V is the bias voltage and V the mean electron-hole pair creation potential in
germanium for -ray interactions (electron recoils). The variables and stand respectively
for the heat and ionisation signal amplitudes calibrated for -ray interactions following the
procedure described in Section 3.1.
We define the quenching variable Q as:
| (3) |
This variable is of particular interest in the case of WIMP search since nuclear and electronic recoils correspond to different ionisation efficencies. As and are calibrated using -rays, for electronic interactions by definition. In the case of nuclear recoils (such as those that would be produced by WIMP interactions), this ratio is much lower: . The simultaneous measurement of heat and ionisation therefore provides an event-by-event identification of the type of recoils and thus gives an efficient method to reject the dominant -ray background. The precise definition of the rejection criteria is discussed in Section 5.
3 Calibration and resolution of heat and ionisation signals
3.1 Calibration of heat and ionisation channels
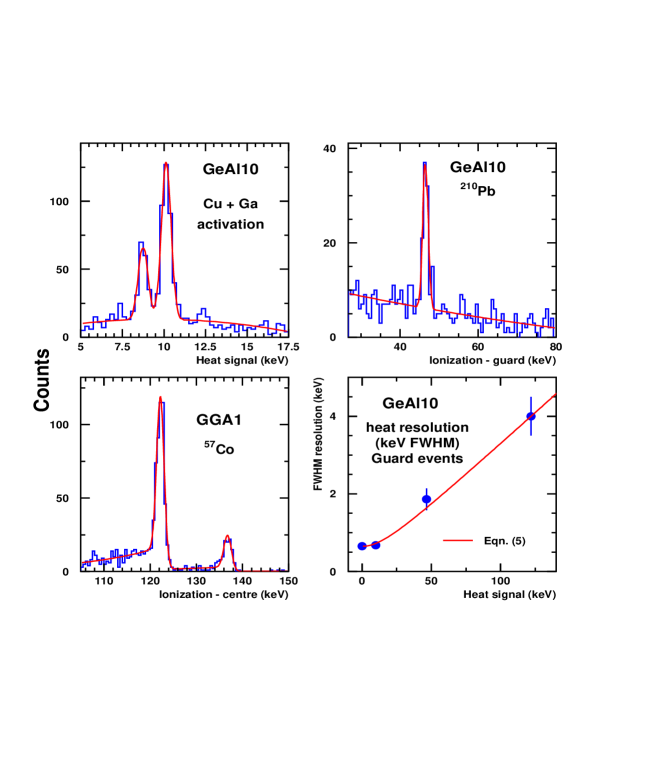
The ionisation signal is calibrated using a 57Co source that can be inserted in the liquid He bath of the cryostat to a distance of
10 cm from the detectors, with only a 0.5 cm thick copper shielding layer between the source and the detectors. The 122 and 136 keV peaks
are clearly visible on the spectra (Fig. 2c), allowing a precise calibration of the ionisation signal. The linearity of the signal
amplitude has been verified using the 46.52 keV line from 210Pb (Fig. 2b) in the detector
environment and the 8.98 and 10.37 keV lines from the decay of cosmic-ray induced long life isotopes
65Zn and 68Ge in the detector. The calibration
factor is observed to be stable within a fraction of percent over periods of months.
Because of the parasite capacitance between the centre and guard electrodes, a
charge fully collected on an electrode also induces a signal on the other. This cross-talk of a few percents
is purely linear and remains constant in time for a given detector.
It can thus be easily corrected off-line (Fig. 3). The ionisation signal is defined as the sum of the
guard ring and center electrode signal amplitudes after correction of the cross-talk and calibration of the two channels.
The heat signal amplitude is periodically calibrated using the same 57Co source. In contrast with
ionisation, the heat signal appears to be very sensitive to long term drifts of the NTD temperature. It may for example vary by a
few percent during several hours after transfers of cryogenic fluids. Between two 57Co calibrations, the heat signal is therefore monitored on a continuous
basis using the data from the low-background physics runs themselves by setting the average value of the ratio to 1 for
electron recoils. The 46.52 keV line from 210Pb and the 8.98 and 10.37 keV lines associated with
cosmogenesis activation of 65Zn and 68Ge in the detector (Fig. 2a) are used to check the quality of the
calibration of the heat signal.
It should be stressed again at this point that the heat and ionisation signals are calibrated using
-ray sources, which induce electron recoils. The and values thus correspond to the
actual energy deposit for this type of interactions only, and are therefore expressed in keV electron
equivalent (keVee).
3.2 Resolution of heat and ionisation channels
For each detector, the baseline resolutions of the heat and the two ionisation channels are regularly controlled through runs with an automatic random trigger. These runs show that the noises of the three channels are not correlated. The ionisation baseline resolution can therefore be written as :
| (4) |
The 57Co calibrations give a measurement of the resolutions for the ionisation and heat signals at 122 keV. Typical values
obtained for the detectors studied here are given in Table 2.
We parametrize the heat and ionisation signals resolutions at a given electron-equivalent energy E as :
| (5) |
where the factors and are deduced from the resolution of the ionisation and heat signals at 122 keV. The resolutions of the 10.37 and
46.52 keV peaks observed in low-background physics runs fit well with the expressions from Eq. (5)
(Fig. 2d). It can be noted that the resolutions at 10 keVee -an energy
below which most of the WIMPs signal is expected- is dominated by the baseline
resolutions and .
Finally, the recoil energy resolution can be computed from the heat and ionisation signal resolutions using Eq. (2). The noises of
both signals being uncorrelated, this resolution can be written as:
| (6) |
In the case of GeAl6, and for the bias voltage applied during the low-background physics run (=6 V), the resolution values displayed in Table 2 lead to 8 keV FWHM around 30 keV. This value is reduced to 4 keV FWHM in the condition of the low-background physics run recorded with GGA1 (=4 V) [4].
4 Threshold
The ionisation and heat channel data are continuously digitized and filtered at a rate of 200 kHz and 2kHz, respectively. When a filtered ionisation value exceeds a fixed threshold value, data samples in all detectors are stored to disk. The trigger is defined by requiring a minimum threshold on the absolute value of any of the filtered ionisation channels. For each event, the list of all detectors having triggered is stored as a bit pattern.
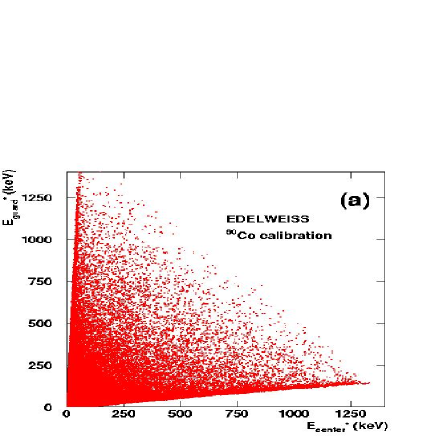
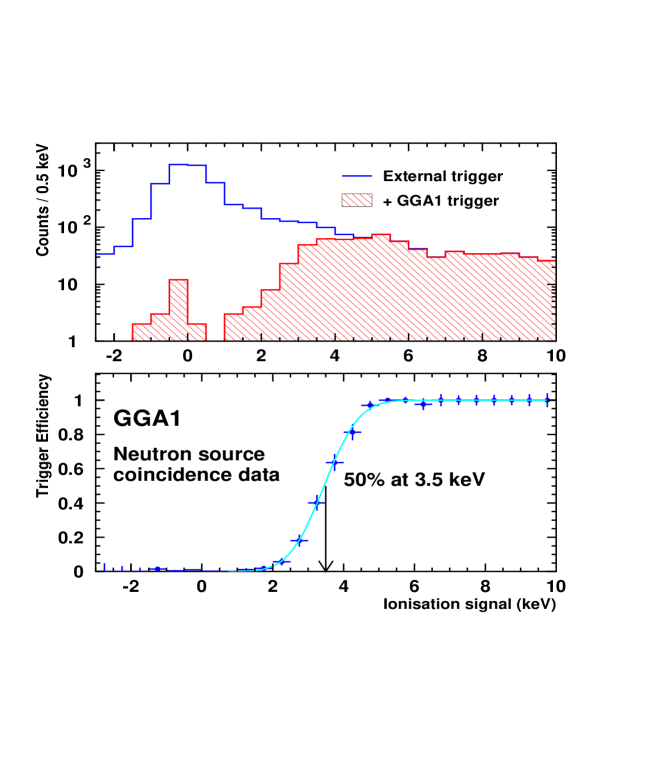
The ionisation threshold value, is defined as the ionisation energy (in keVee) at which the trigger efficiency reaches 50%. It is the most important parameter governing the recoil energy dependence of the efficiency. Its value is measured using two different techniques: one is based on the Compton plateau observed with a -ray source, and the other on coincidence neutron data.
In the first one, a -ray spectra is recorded using a source producing a important Compton plateau, such as 60Co or 137Cs. Monte Carlo simulations indicate that the shape of the plateau above 10 keV can be linearly extrapolated to lower energy. The efficiency as a function of , , is thus obtained by dividing the measured rate by the straight line extrapolated from the rate above 10 keV. The resulting data is fitted by a integral of a gaussian (erf), yielding the experimental value of . However, this method is limited by the large data sample necessary to obtain a significant number of events in the threshold region.
The second technique was made possible by the simultaneous operation of three detectors with a 252Cf neutron source (and thus could not be applied to the GeAl6 detector). Neutron scattering induces a large number of coincidence events where at least two detectors are hit. The upper pannel of Fig. 4 shows the distribution recorded in one detector with the condition that any of the other two detector triggered (unfilled histogram). Despite that the detector under study is not requested in the trigger pattern, the peak at =0 due to baseline noise is not overwhelmingly large, due to the importance of the coincident rate. An unbiased sample of events with keV is thus obtained. When in this sample it is further requested that the detector under study be present in the trigger pattern, the shaded histogram is obtained. The ratio of the two distributions shown in the lower pannel of Fig. 4 correspond to the efficiency . This interpretation is valid in the region close to and above because in that energy range the contribution of the peak due to baseline events is negligible and because the slope of the unbiased distribution is reasonnably small compared to the experimental resolution on . Indeed, applying this method to a distribution proportionnal to and smeared with an experimental r.m.s. resolution , this method would result in a shift of of the deduced value of relative to the true value. In the present case, where the range of exponential slopes and resolution are 3 8 keV and 1 2.35 2 keV, the shift should not exceed 0.2 keV.
Both Compton and neutron coincidence techniques give consistent ionisation threshold measurements. The coincidence measurements are the most precise, as the neutron source has the advantage of yielding a maximum rate at the lowest energy, and in addition, the quenching of ionisation for nuclear recoils ensure that the stability of the measurement can be tested by imposing a cut on the heat signal without affecting the ionisation signals with above . The measured values for the different ionisation channels of the detectors under study are listed in the last column of Table 2.
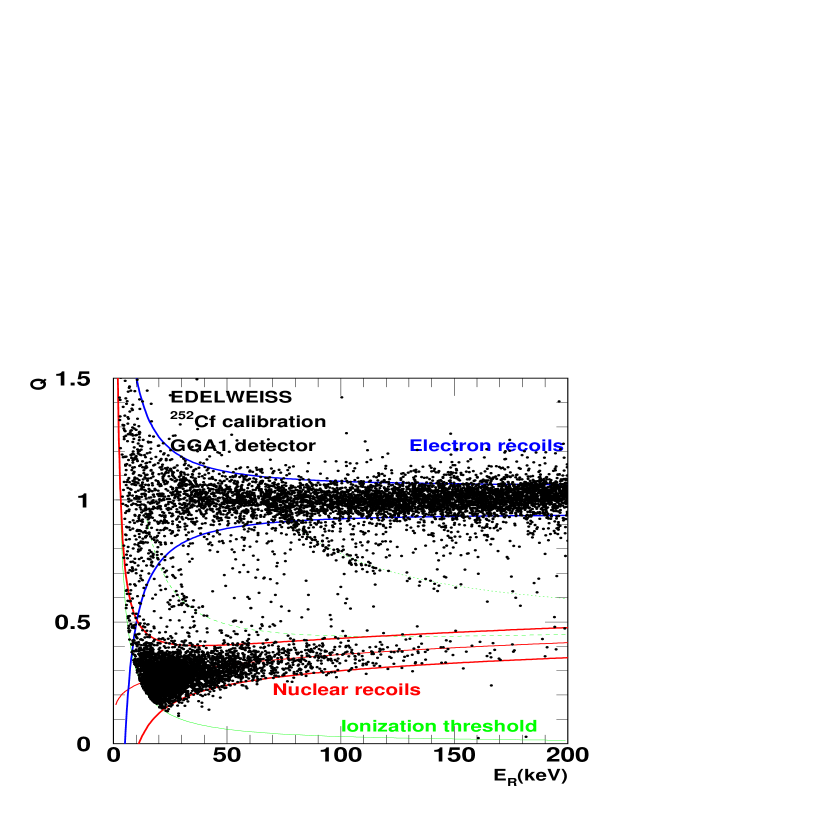
5 Nuclear recoil band
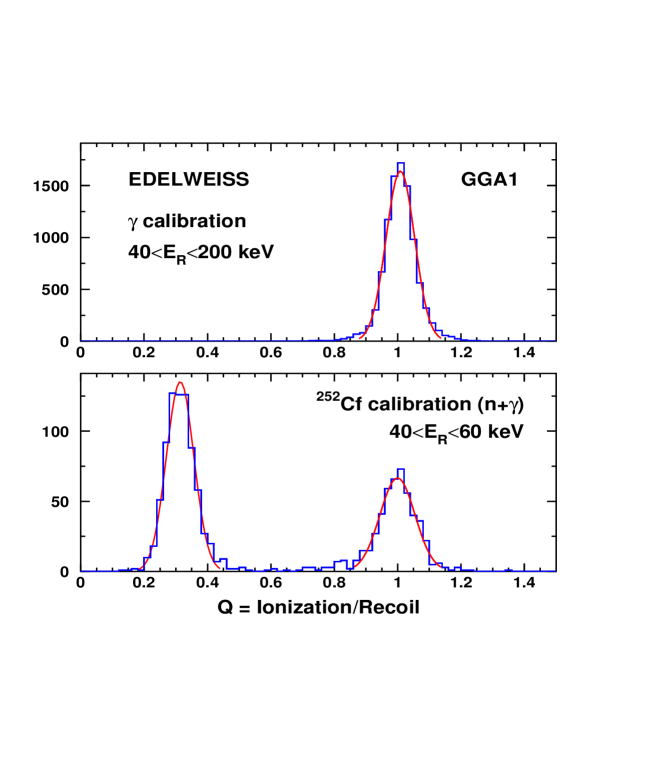
Figure 5 shows a (, ) distribution from the data recorded with a 252Cf source emitting -rays and neutrons. Experimentally, the variable appears to follow a gaussian distribution at the level for both nuclear and electron recoils populations (Fig. 6). We therefore parametrize the region of 90% acceptance for the nuclear recoils by the following cut:
| (7) |
where and are the average value and the standard deviation of the distribution for nuclear recoils, both variables being determined for each detector from 252Cf calibration data under the same experimental conditions as the low-background physics runs.
5.1 Neutron line
The neutron line is the average value for the nuclear recoils population. It is parametrized from 252Cf calibration data by :
| (8) |
The and values resulting from the fit of the experimental data for each EDELWEISS detector are statistically consistent with the values and quoted in [8]. The biases on the determination of due to experimental calibration uncertainties, heat quenching effects [9], and multiple scatterings are globally taken into account with this measurement.
5.2 Electron and nuclear recoils zones standard deviations
The standard deviation of the electronic and nuclear recoil distributions, respectively noted and , can be calculated with Eqs. (2) and (3) by propagation of the experimental values and :
| (9) | |||||
| (10) |
In the case of 60Co, 252Cf calibrations and low-background physics runs, the experimental values of at high energy
are significantly larger (up to +30% at 122 keV) than those calculated from the
resolutions given in Table 2 with Eqs. (4), (5) and
(9) (Fig. 7a). A dependance of the heat signal amplitude on the position of the
interaction provides an explanation for this discrepency. This hypothesis is consistent with the
% heat signal amplitude difference observed between center and guard events in 57Co
calibrations. We therefore enlarge the coefficient in Eq. (5) so that the analytic expression given in
Eq. (9) for actually follows the experimental distribution for
60Co, 252Cf and
low-background physics runs. We have checked that 90% of the experimental events then fall inside the
electron recoil zone defined in this way.
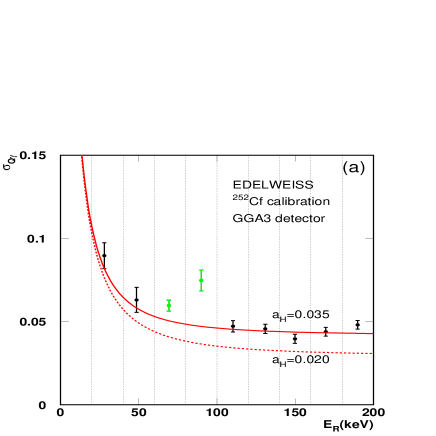
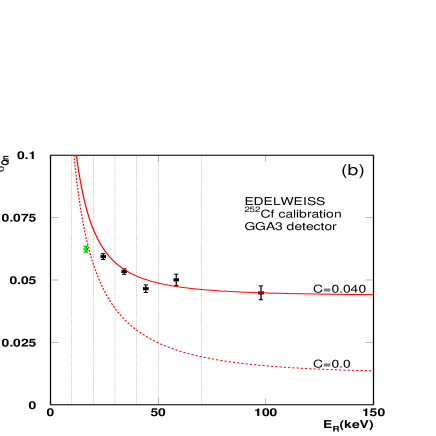
Even after correcting the value, the nuclear recoils distribution of 252Cf
calibration data is broader at high energy than what is expected from Eq. (10) (Fig. 7b).
Atomic scattering processes [11], fluctuations in the number
of charges created by a nuclear recoil [12] and multiple scattering (see Section 5.3) are in particular expected to
give an intrinsic width to the distribution for nuclear recoils and thus explain this
behavior. The experimental dependance on recoil energy is properly described when a constant
is quadratically added to the term associated with the experimental resolution. The equation
(10) is thus re-written as follows:
| (11) |
Typical values of 0.040 are determined for each EDELWEISS detector by fitting the experimental points using Eq. (11). With this definition, we have checked for each detector that 90% of nuclear recoils induced by 252Cf calibrations are inside the nuclear recoil zone defined in Eq. (7).
5.3 Effect of multiple scattering
The nuclear recoil zone is determined through neutron calibrations, for which the proportion of multiple
interactions is around 40% between 20 and 200 keV. This is of particular importance because in
contrast to neutrons, WIMPs are expected to interact only once in the detector, and the variable
is in this case larger than when the same energy is deposited
in multiple nuclear interactions, as can be deduced from Eq. (8).
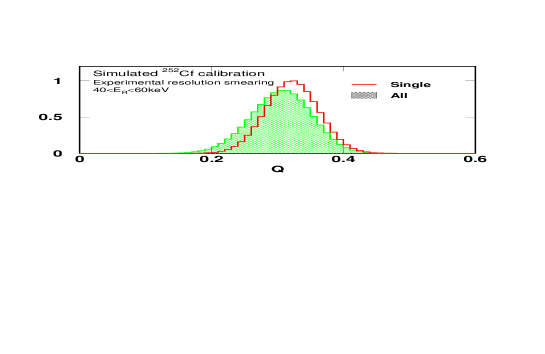
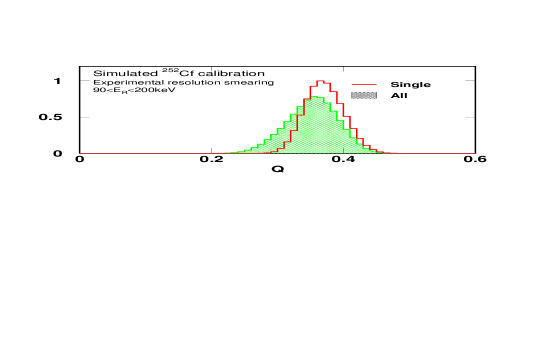
We therefore evaluated quantitatively the effect of multiple interactions using a GEANT [10]
simulation of 252Cf calibrations of the EDELWEISS detectors. The variable has been calculated for the simulated nuclear events by associating with
Eq. (8) an ionisation signal of amplitude to an energy deposit in a single interaction, and summing each
individual to obtain the total energy for a given neutron.
The effect of multiple interactions has then been evaluated with these simulated data by smearing the
resulting distribution with the experimental resolution given in Eq. (10), and then by
comparing the distributions obtained when selecting or not single interactions events (Fig. 8).
Although multiple interactions tend to lower , this effect remains weak, and the distribution
associated with single interactions events is only slightly narrower and completely included in the wider band. The nuclear recoils
zone determined through 252Cf calibrations has therefore been conservatively used for the low-bakground
physics run analysis.
5.4 Analysis energy range
Equations (9) and (10) predict that the discrimination between electronic and nuclear
interactions is deteriorated at low energies (see also Fig. 5). Rejection of the -ray
background at a given level therefore defines a lower bound for the analysis energy range.
Secondly, the detection efficiency has to be as close to 100% as possible in the analysis window in order to insure a good quality
for the data set. The trigger threshold is therefore another factor which has to be taken into account for the definition of the
analysis lower energy bound. For both 2000 [3] and 2002 [4] runs, the choice of the analysis
lower bound has mainly been driven by this last factor. The threshold values of 5.7
and 3.5 keVee for the ionisation signal indeed correspond respectively to recoil energies of 30 and 20 keV for a 100% detection
efficiency, and 90% efficiency when the nuclear recoil zone is taken into account.
Extensive -rays and neutron calibrations are performed before the physics data taking is initiated
in order to fix the lowest recoil energy value corresponding to acceptable levels of -ray background
rejection and detection efficiency. This ensures that the lower limit of the analysis
window is not influenced by the possible presence of events in the final data set. The definition of the upper
bound of the analysis window is described in [4].
6 Fiducial volume
6.1 Modelisation of the collection process
The segmentation of the upper charge collection electrode in a central part and a guard ring leads to the
definition of a fiducial volume. This volume is shielded against a significant amount of the radioactivity of the detector environment by the
peripherical volume, as shown in [3]. To allow for the experimental resolution on the ionisation signals, the fiducial cut is defined as
corresponding to a fraction of 3/4 of the charge collected on the center electrode. In order to give a robust and precise
estimation of the detector volume
associated with this fiducial cut, it is necessary to relate a given ratio of the two ionisation signal amplitudes to a given volume
inside the detector. This is not a straightforward process: first, for non-WIMP interactions, multiple
interactions have to be taken into account, and furthermore, interactions between charges may play a crucial
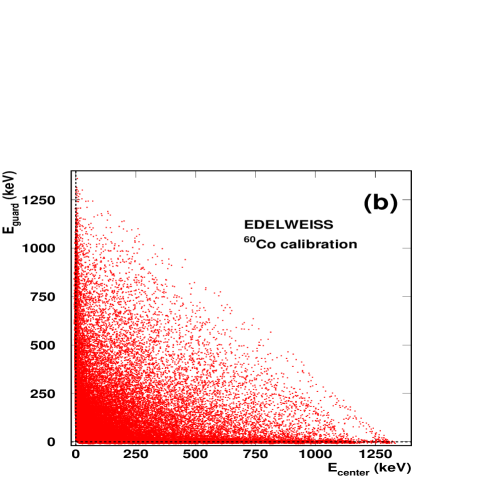
role in the collection process. In particular, the important proportion of events with a charge signal shared between the two channels observed in each
detector for 60Co calibrations (see e.g. Fig. 3) hints to the importance of these charge interactions processes.
In order to test their influence on the determination of the fiducial volume, we choose to model the
collection process with the simplified phenomenological description of charge collection given in Ref. [13], associated with the hypothesis of a
plasma effect before charge drift. We will see that, even if some of our results cannot
be explained in the framework of this very simplified model (Section 6.2), it provides a good empirical tool to determine the fiducial volume and estimate
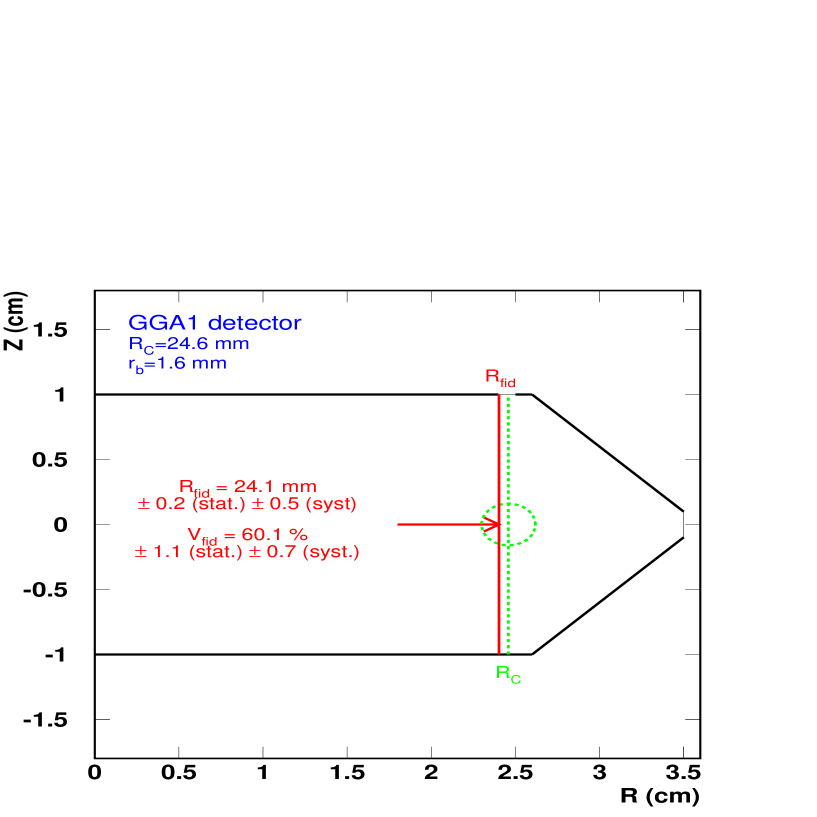
systematic errors on its value (Section 6.3). The model used here assumes the distribution of the charges in a sphere with uniform density, extending to a maximal
radius before the charge is fully collected. Charges are distributed among the two electrodes depending on the position of the interaction relative to the surface
corresponding to the separation between drift lines going to the center and guard rings. Here, we assume for
simplicity that this surface is parametrized by a
cylinder of radius (Fig. 11). For an interaction at the radius in the crystal, the whole charge is fully associated with the guard ring.
If , then the charge has to be associated with the center electrode. Finally, if , then the charge is splitted among the
two electrodes, with a relative proportion associated with the center electrode corresponding to the fraction of the sphere inside the cylinder of radius .
For given values of and , the fiducial volume is determined in this model by the following
expression of the fiducial radius:
| (12) |
A fraction of 1/4 of the total volume of a sphere of radius centered on is inside the cylinder of radius . In the framework of our model, interactions inside the cylinder of radius thus correspond to a charge collection equal or greater than 3/4 of the total charge.
6.2 Validity and limits of the modelisation
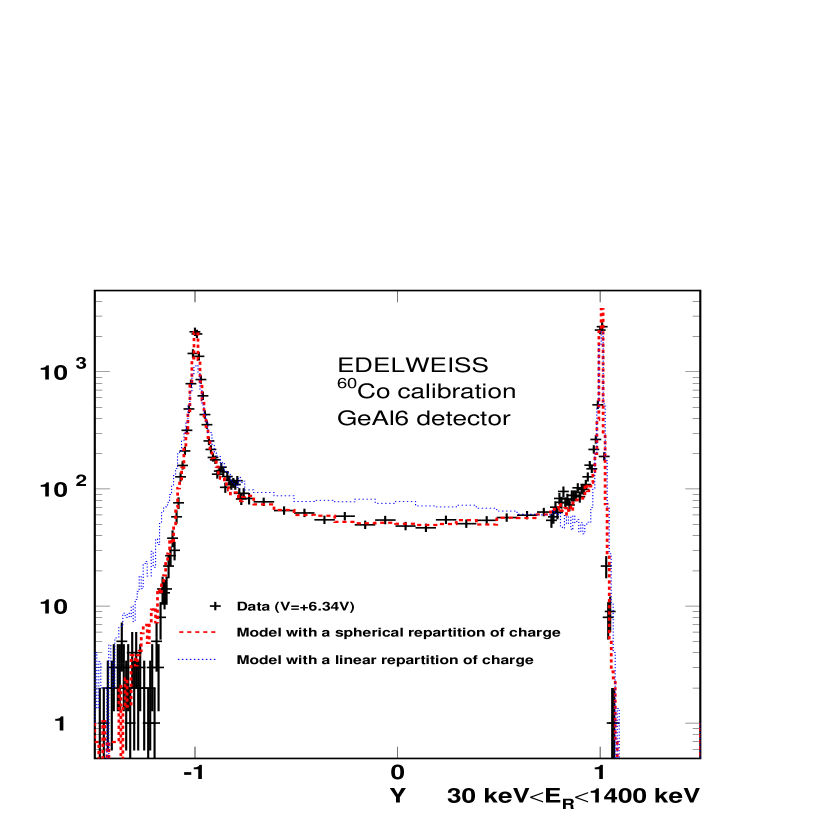
In order to test its ability to reproduce the distribution of charge amplitudes, ionisation signals are simulated in the framework of this simple model, using the program GEANT [10] for 60Co and 252Cf calibrations, as described in Section 5.3. The parameters and of the simulated data are then adjusted to match the experimental distribution of the variable on a given energy range, the variable being defined as the normalized difference of the ionisation signals:
| (13) |
The result of this optimisation is shown in Fig. 9 in the case of a 60Co calibration of the GeAl6 detector under
6.3 V bias voltage. The shape of the simulated distribution closely follows that of the experimental data, while a simulation
using an alternative model (linear distribution of the charge, detailed in [14]) clearly exhibits a different pattern.
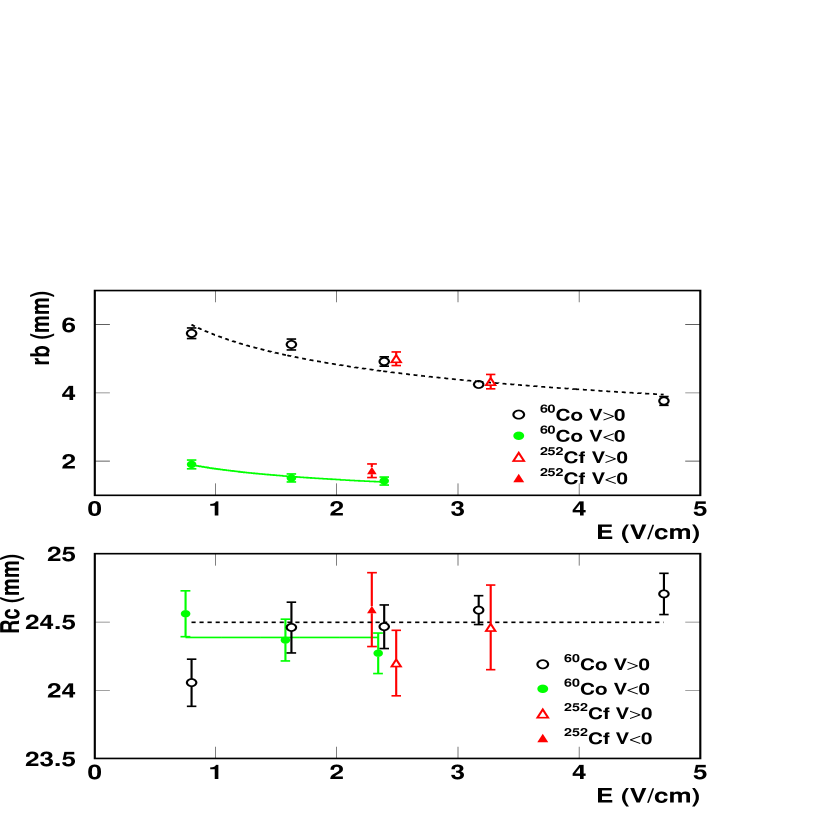
We have also studied the evolution of the (, ) parameters as a function of bias voltage for the GeAl6 detector [15].
should not depend on the value and sign of the bias voltage, since it is related to the static field distribution only,
while should increase with decreasing bias
voltage: as the field increases, the less time there is for diffusion processes. The values of the parameters and determined for
60Co and 252Cf calibrations of the GeAl6 detector versus the applied
field are displayed in Fig. 10. The and values follow the expected behavior. Moreover, the
mean measured value of ( mm) is statistically compatible with the value mm expected from numerical calculations
of the electric potential inside this detector (see Table 1).
The very large values are a clear sign that macroscopic charge extension perpendicular to the drift direction occurs before the charge collection is completed.
However the data does not support that this expansion is driven by the plasma effect invoqued in Ref. [13]: a charge cloud size of the order or above a
millimeter is indeed not compatible with results of studies on the dead layer [5, 16]. Furthermore, Fig. 10 shows that and
that the values of for 60Co and 252Cf calibrations do not differ significantly for a same bias voltage. These two experimental results are also in strong
disagreement with the predictions derived from the hypothesis of a plasma effect: firstly, the observed asymmetry for values
between positive and negative bias voltage does not find any explanation in the
framework of the plasma model, and secondly, the plasma effect should be weaker in the case of 60Co
calibrations than for 252Cf (and thus values much smaller), since
-rays induce much lower charge densities than neutrons.
These are strong indications that the simple model presented here does not provide a proper description
of the dynamics of the charge drift and collection. Charge repulsion during drift, not taken into account
here, could for example play an important role in the collection process. A more detailed study, with
dedicated detectors, has been initiated in the EDELWEISS collaboration in the aim of better understanding
the collection process [16].
6.3 Measurement of the fiducial volume
Our results clearly point out the limits of the modelisation presented in Section 6.1. Still, it has to be stressed that this model reproduces
correctly the distribution of charges
among the electrodes (Fig. 9), which represents the net effect of the charge collection process. It is therefore
sufficient to give a precise determination of the fiducial volume and evaluate possible systematic errors, before a better, physically motivated model replaces
it.
We have calculated with Eq. (12) and the and values determined
from 252Cf calibrations under the same bias voltage as that of the low-background physics run for each detector.
For all detectors except GeAl10, the values are compatible with those expected from the geometry of
the electrodes and from numerical simulations of the electric potential inside the detectors. The
values determined for for the detectors are summarized in Table 3. The systematic error associated with the uncertainty on the exact
mechanism producing the charge expansion is evaluated by taking the difference between the fiducial volume
value deduced using the linear model and the one presented in Section 6.1. Despite
the poor description of the charge distribution by the linear model (see Fig. 9), this difference is only 1%. The variation of
the energy range used to determine the values of and through comparison of the experimental and simulated
distributions proved to be a minor contribution to this systematic error.
An alternative evaluation of the fiducial volume is
the fraction of cosmic activation events at 8.98 and 10.37 keV
(see Fig. 2) selected by the fiducial volume cut.
Such events are expected to be evenly spread inside the detector,
and are observed at rates varying between 3 to 15 events per
detector per day.
In the few days following a neutron calibration, the 10.37 keV rate is
also enhanced due to activation ( = 2.7 d),
a population that is also expected to be evenly spread inside the
detector.
The measured fractions, directly interpreted as values,
are listed in the last column of Table 3.
They are compatible within statistics with the values derived from
the neutron calibration data and the collection process
modelisation. The cosmic activation data is however less precise due to
statistics, but this measurement is a good cross-check for the determination of the fiducial volume, and validates the use of the model presented in Section
6.1 to determine the fiducial volume.
7 Conclusion
We have described in the present work the calibration aspects of the data analysis in the EDELWEISS experiment. In particular, the nuclear recoil zone and fiducial volume have been estimated using several methods, allowing to define a conservative value of these important parameters. A simple parametrization allows us to reproduce accurately the distribution of the charges between the centre and guard electrodes associated with 60Co and 252Cf calibrations, making possible the systematic studies necessary to establish the robustness of the determination of the fiducial volume of the detectors.
References
- [1] L. Bergström, Rep. Prog. Phys 63, 793 (2000).
- [2] X.F. Navick et al., NIM A 444, 361 (2000).
- [3] A. Benoît et al., Phys. Lett. B 479 8 (2000).
- [4] A. Benoît et al., Phys. Lett. B 545 43 (2002).
-
[5]
P. Luke et al., IEEE Trans. Nucl. Sci. 41 (4) (1994) 1074.
T. Shutt et al., NIM A 444, 340 (2000).
T. Shutt et al., in Proc. 9th Int. Workshop on Low Temperature Detectors, AIP conference proceedings 605, 513 (2001). - [6] XF. Navick et al., to be published.
-
[7]
B. Neganov and V. Trofimov, USSR patent No 1037771, Otkrytia i izobreteniya 146, 215 (1985).
P.N. Luke, J. Appl. Phys. 64, 6858 (1988). - [8] P. Di Stefano et al., Astropart. Phys. 14, 329 (2001).
- [9] E. Simon et al., NIM A 507, 643 (2003).
- [10] R. Brun et al., GEANT3, CERN report DD/EE/84-1 (1987).
- [11] J. Lindhard et al., Mat. Phys. Medd. Dan. Vid. Selsk 10, 1 (1963).
- [12] T. Yamaya et al., NIM 159, 181 (1979).
- [13] M.J. Penn et al., in Proc. 6th Int. Workshop on Low Temperature Detectors, NIM A 370, 215 (1996).
- [14] O. Martineau et al., in Proc. 9th Int. Workshop on Low Temperature Detectors, AIP conference proceedings 605, 505 (2001).
-
[15]
O. Martineau, Recherche de WIMPs par l’expérience EDELWEISS: caractérisation des détecteurs et analyse des données,
PhD thesis, Université Lyon I (2002) (in french).
Available at http://edelweiss.in2p3.fr/pub/fichiers/theses.html. -
[16]
A. Broniatowski et al., in Proc. 9th Int. Workshop on Low Temperature Detectors, AIP conference proceedings 605, 521 (2001).
A. Broniatowski, to be published in LTD10 proceedings (Genova, July 2003).
| Label | Mass | Vol. NTD | Amorphous | ||
| (g) | (mm) | (mm3) | layer | (mK) | |
| GeAl6 | 321.62 | 24.4 | 4.0 | none | 27 |
| GeAl9 | 325.43 | 24.0 | 5.6 | none | 17 |
| GeAl10 | 323.91 | 24.0 | 5.6 | none | 17 |
| GGA1 | 318.50 | 24.0 | 1.64 | Ge | 17 |
| GGA3 | 324.40 | 24.0 | 5.6 | Ge | 17 |
| GSA1 | 313.68 | 24.0 | 5.6 | Si | 17 |
| GSA3 | 297.03 | 24.0 | 5.6 | Si | 17 |
| FWHM @ 0 keV | FWHM @ 122 keV | Trigger Threshold | |||||
|---|---|---|---|---|---|---|---|
| Center | Guard | Heat | Ion. | Heat | Center | Guard | |
| Detector | (keVee) | (keVee) | (keVee) | (keVee) | (keVee) | (keVee) | (keVee) |
| GeAl6 | 2.0 | 1.4 | 2.2 | 2.8 | 3.5 | 6.0 | 4.0 |
| GeAl9 | 1.2 | 1.4 | 0.5 | 2.6 | 3.3 | 4.3 | 4.9 |
| GeAl10 | 1.1 | 1.3 | 0.4 | 3.0 | 3.5 | 3.3 | 4.3 |
| GGA1 | 1.3 | 1.3 | 1.3 | 2.8 | 3.5 | 3.5 | 3.5 |
| GGA3 | 1.3 | 1.5 | 0.4 | 3.1 | 2.7 | 2.9 | 3.9 |
| GSA1 | 1.2 | 1.4 | 0.6 | 3.1 | 2.8 | 3.5 | 3.4 |
| GSA3 | 1.1 | 1.3 | 1.4 | 3.3 | 3.3 | 3.0 | 3.4 |
| Detector | Bias | Activation | ||||
|---|---|---|---|---|---|---|
| (V) | (mm) | (mm) | (mm) | (%) | (%) | |
| GeAl6 | +6.34 | |||||
| GeAl9 | +2.00 | |||||
| GeAl10 | -3.00 | |||||
| GGA1 | -4.00 | |||||
| GGA3 | -4.00 | |||||
| GSA1 | -4.00 | |||||
| GSA3 | -4.00 |
 |
 |
 |
 |