New high-resolution radio observations of the SNR CTB 80
Abstract
We report new high resolution and high sensitivity radio observations of the extended supernova remnant (SNR) CTB 80 (G69.0+2.7) at 240 MHz, 324 MHz, 618 MHz, and 1380 MHz. The imaging of CTB 80 at 240 MHz and 618 MHz was performed using the Giant Metrewave Radio Telescope (GMRT) in India. The observations at 324 MHz and 1380 MHz were obtained using the Very Large Array (VLA, NRAO) in its C and D configurations. The new radio images reveal faint extensions for the asymmetric arms of CTB 80. The arms are irregular with filaments and clumps of size 1′ (or 0.6 pc at a distance of 2 kpc). The radio image at 1380 MHz is compared with IR and optical emission. The correspondence IR/radio is excellent along the N arm of CTB 80. Ionized gas observed in the [SII] line perfectly matches the W and N edges of CTB 80. The central nebula associated with the pulsar PSR B1951+32 was investigated with an angular resolution of 10′′ 6′′. The new radio image obtained at 618 MHz shows with superb detail structures in the 8′ 4′ E-W “plateau” nebula that hosts the pulsar on its western extreme. A twisted filament, about 6′ in extent ( 3.5 pc), trails behind the pulsar in an approximate W-E direction. In the bright “core” nebula (size 45′′), located to the W of the plateau, the images show a distortion in the morphology towards the W; this feature corresponds to the direction in which the pulsar escapes from the SNR with a velocity of 240 km s-1. Based on the new observations, the energetics of the SNR and of the PWN are investigated.
1 Introduction
The morphology and brightness distribution in supernova remnants, as observed in the different spectral regimes, are due to internal and external factors. The former include the explosion mechanism itself as well as the possible presence of a neutron star injecting relativistic charged particles during the lifetime of the SNR. Externally, inhomogeneities in the distribution of the surrounding interstellar matter (dense clouds or cavities) can modify the expansion of the SN blast wave.
Based on their appearance in the radio domain, SNRs have been classically classified into three broad categories: shell-like (where electrons are accelerated at the shock front), filled-center or plerions (where relativistic particles are provided by an active pulsar) and composite or hybrid (that combine both characteristics, a hollow shell and central emission). High resolution and sensitive radio observations have revealed, however, other interesting morphological patterns such as helicoidal filaments (Dubner et al. 1998), “barrels”, bi-lobed SNRs, jets components (Gaensler 1999), etc. Furthermore, the availability of sensitive and high-resolution X-ray observations in recent years has extended this broad classification to include the so called “X-ray composite”, i.e. SNRs consisting of a radio shell with centrally peaked X-ray emission. Investigations of brightness distribution and spatial spectral variation along with multiwavelength comparisons (e.g. radio images with optical, infrared and X-ray ones) are important to understand the nature and evolution of SNRs. In addition, the study of the surrounding matter is very useful to disentangle the different physical mechanisms at play.
CTB 80 is an example of a peculiar morphology that does not fit standard classifications and whose nature as a SNR is still questioned (Green 2001). This source, located at a distance of 2 kpc (Strom & Stappers 2000), has a large angular size (over 1∘ from the northern extreme to the southernmost limit). It is generally faint, except for the central region, where three extended arms overlap in a flat spectrum nebula (with spectral index -0.3, where , and about in size). Strom (1987) reported the existence of a compact radio source immersed in this nebula. Later, Kulkarni et al. (1988) confirmed that the point source was a fast spinning pulsar, PSR B1951+32. Different radio observations (Angerhofer et al. 1981, Strom, Angerhofer, & Dickel 1984, Mantovani et al. 1985, Strom 1987, Strom & Stappers 2000) show that the pulsar is located within a small ( ) and flat spectrum component ( 0.0) which is called the “core”. The “core” is in turn placed on the western end of the central nebula, called by Angerhofer et al. (1981) the “plateau” region. The three outer arms about long each, point to the E, N and SW of the plateau and have a steeper spectral index ( -0.7). Over a large part of the remnant there is a high degree of linear polarization, that rises up to 10-15 on the central component (Velusamy, Kundu, & Becker 1976).
The associated pulsar PSR B1951+32 has a period of 40 ms and is moving toward the SW with the relatively high velocity of 240 km s-1 (Migliazzo et al. 2002). Based on proper motion measurements carried out by these authors, the pulsar’s age is estimated at 64 kyr. Gamma-ray pulsations from PSR B1951+32 (E 100 MeV) have been found by Ramanamurthy et al. (1995) with the EGRET instrument. Pulsed X-rays from this object have been reported by Ögelman & Buccheri (1987), Lingxiang et al. (1993), Safi-Harb, Ögelman, & Finley (1995), and Chang & Ho (1997) from , , , and observations, respectively.
X-ray radiation has been imaged from the central region of CTB 80 using the and instruments. The image shows emission from the bright “core” and the diffuse nebula E of the pulsar, similar to the radio emission morphology in the center of the source (Safi-Harb et al. 1995).
In the optical regime, the characteristic structure of this remnant arises from forbidden-line emission such as [NII], [SII], [OIII], and the Hα line. The emission in these lines essentially delineates the radio “core” component. Studies focused on this area reveal filamentary Hα, [NII], and [SII] emission, extending in an irregular fashion in the E-W direction (Angerhofer, Wilson, & Mould 1980). In the [OIII] line, the central component itself is observed as a system of filaments showing a shell-type structure, which brightens in the vicinity of the pulsar (Hester & Kulkarni 1989). A larger area has been recently observed by Mavromatakis et al. (2001) in Hα+[NII], [SII], [OIII] and [OII] lines. Both filamentary and diffuse structures are observed in the optical domain to the S, S-E, S-W, and N of PSR B1951+32.
The current work presents high resolution and high sensitivity radio observations of CTB 80 at 240 MHz, 324.5 MHz, 618 MHz, and 1380 MHz of the entire 1∘ source. The radio data presented here at 240 MHz and 618 MHz were acquired with the Giant Metrewave Radio Telescope (GMRT111 The GMRT is run by the National Centre for Radio Astrophysics of the Tata Institute of Fundamental Research.) located near Pune, in India, while the 324.5 MHz and 1380 MHz data have been obtained with the Very Large Array of the National Radio Astronomy Observatory (VLA222The Very Large Array of the National Radio Astronomy Observatory is a facility of the National Science Foundation operated under cooperative agreement by Associated Universities, Inc.) in its C and D configurations.
2 Observations and data reduction
2.1 Radio continuum at 240 MHz
CTB 80 was observed at 240 MHz with the GMRT (Swarup et al. 1991) on 2002 May 6 and 7 for a total of 10 hours. The source was observed with a bandwidth of 8 MHz split into 128 channels. The relevant flux density scale of our observations was determined using observations of 3C 286 and 3C 48. The source 1924+334 was used as the phase and amplitude calibrator. The observations were carried out in continuous cycles of 10 minutes on 1924+334 and 30 minutes on CTB 80. The flux density calibrators, which were also the bandpass calibrators, were observed once for a total of 45 minutes. The relevant observational parameters for all observed frequencies are listed in Table 1.
The 240 MHz data were fully reduced using AIPS++. To flag the data we used the “autoflag” tool, searching for interference points across channels and time respectively for each baseline. The interference rejection on the data was 15 . The data were then bandpass calibrated and combined in channels.
To image CTB 80 we have used wide-field imaging techniques based on a multi-facet method (Cornwell & Perley 1992) to deal with the non-coplanarity of the visibilities. In order to recover the image of the extended CTB 80 remnant, the 240 MHz GMRT data were imaged and self-calibrated as a patchwork of 26 subfields; 25 facets on CTB 80 and one outlier field on Cygnus A (located at about to the NE of CTB 80). The imaging process included two-stages. First, a multiscale clean was carried out at the center of the image. Then, this model was used as the starting point for the multi-facet wide-field imaging process. We found that performing the deconvolution in a two stage scheme, reduces the CLEAN striping problem. The resulting image at 240 MHz has an angular resolution of 26′′ 17′′, P.A. = 77∘. For presentation purposes the image displayed in Figure 1 has been convolved with a beam 1.4 times larger than the naturally weighted point spread function obtained. The final rms noise is 4.6 mJy beam-1.
2.2 Radio continuum at 324 MHz
The = 90 cm image presented here has been produced after merging data taken with the VLA in the C and D configurations. The C-array data were taken on 2000 March 21, while the shortest spacings information was available from the VLA D-array on 2000 August 14. In both cases 26 antennas were available, providing 325 instantaneous baselines. For each array the observations were made with two 3 MHz bands centered at 321.5 MHz and 327.5 MHz. Each 3 MHz bandwidth was divided into 31 channels. The main purpose of observing in spectral mode was to assure better interference editing capability and to reduce the effect from bandwidth smearing in the longer baselines.
For both C and D arrays, measurements were interleaved with the primary flux density calibrators 3C 48 and 3C 286. The latter was also used as bandpass calibrator. Also, regular observations of the secondary calibrators, 1859+129 and 2038+513 for C-array and of 1859+129 for D-array, were used for amplitude and phase calibration.
The total integration time on CTB 80 was 8 hours in VLA-C configuration and 3.5 hours in the D-array. Cygnus A, 8∘ away from the observation center, is a strong source of interference, even though it is in the sidelobes. To deal with this problem we need to follow a careful approach because phase errors are different for sources in the sidelobes than those in the mainlobe (due to the nature of noise and how errors propagate in phase and amplitude; see Napier & Crane 1982, Perley 1999). We thus used the following imaging scheme: (1) image Cygnus A only; (2) perform a phase self-calibration using the model obtained from (1); (3) re-image Cygnus A; (4) estimate new visibilities’s contribution due to Cygnus A as from (3) and subtract it from the uv-data; (5) image CTB 80 and phase self-calibrate. This step was repeated several times and cleaned deeper each time. Finally, (6) we performed a phase and amplitude self-calibration before producing the final image. The imaging was done with AIPS using the 3-D multi-facet algorithm, with 16 facets, for the C-array data.
The VLA D data, were initially reduced using standard 2-D imaging techniques, since the widefield errors on the quality of the map are expected to be small when the array is in this configuration.
The final calibrated C and D maps were combined in the u-v-domain. We used the same two stage imaging as described in the Sect. 2.1, that is using multi-scale clean followed by the general 3-D widefield clean. The final angular resolution of the image at 324.5 MHz is 73′′ 63′′, P.A. = -88∘ and the sensitivity is 14 mJy beam-1.
2.3 Radio continuum at 618 MHz
The data at 618 MHz were obtained using the GMRT in two periods on 2002 May 7 and 8 for a total of 10 hours. A total of 128 channels were used spread across a bandwidth of 16 MHz. The observation at this frequency was made in a similar fashion as at 240 MHz (see Sect. 2.1).
The imaging was done in AIPS++. We used the wide-field imaging technique with 9 facets on CTB 80, along with an outlier field on Cygnus A. The large scale structure is faint and is corrupted by the noise introduced in the deconvolution process. This, we believe, is due to residual calibration errors with small time scale variations. For this image the resulting beamsize is 10′′ 6′′, P.A. = 67∘ and the sensitivity is 0.6 mJy beam-1.
2.4 Radio continuum at 1380 MHz
Since the angular size of the SNR CTB 80 exceeds 1∘, mosaicing techniques were employed to image the source at 1.4 GHz (VLA primary beam 30′). The pointings were separated by 15′ according to the Nyquist sampling criterion.
The observations were carried out in two observing sessions. On January 3, 1994, 35 pointings were observed with the D configuration of the VLA in two 50 MHz bands centered at 1385 and 1465 MHz and on 1995 April 3, 32 pointings were observed with the same configuration of the VLA, but in two 50 MHz bands centered at 1365 and 1665 MHz.
The data were calibrated using the standard AIPS procedures. The flux density calibration was based upon 3C 286 while the phase calibrator was 1830-210. The instrumental polarization was derived using 1830-210, and the RR–LL offset was calibrated on 3C 286.
The calibrated data from different dates were further processed separately, using the SDE package (Software Development Environment, Cornwell, Briggs, & Holdaway 1996). Single antenna data, as taken from the Bonn-100 m 1408 MHz Survey (Reich, Reich, & Fürst 1990) were incorporated in the synthesis image. The single dish data have after taking into account an inaccuracy in the Jy px-1 into Jy beam-1 conversion in Reich et al.’s (1990) factor. This image was employed as the prior image in the maximum entropy based mosaic program MOSAICM, based on the Cornwell (1988) algorithm. The technique is fully discussed by Holdaway (1999).
Because of the disparity of the second IF in the VLA data (1465 and 1665 MHz) we only used the low frecuency bands. The images observed at 1365 and at 1385 MHz were averaged using the task COMB in AIPS. The final image has an angular resolution of , P.A. = 72∘ and an rms noise level of 4 mJy beam-1.
3 Results
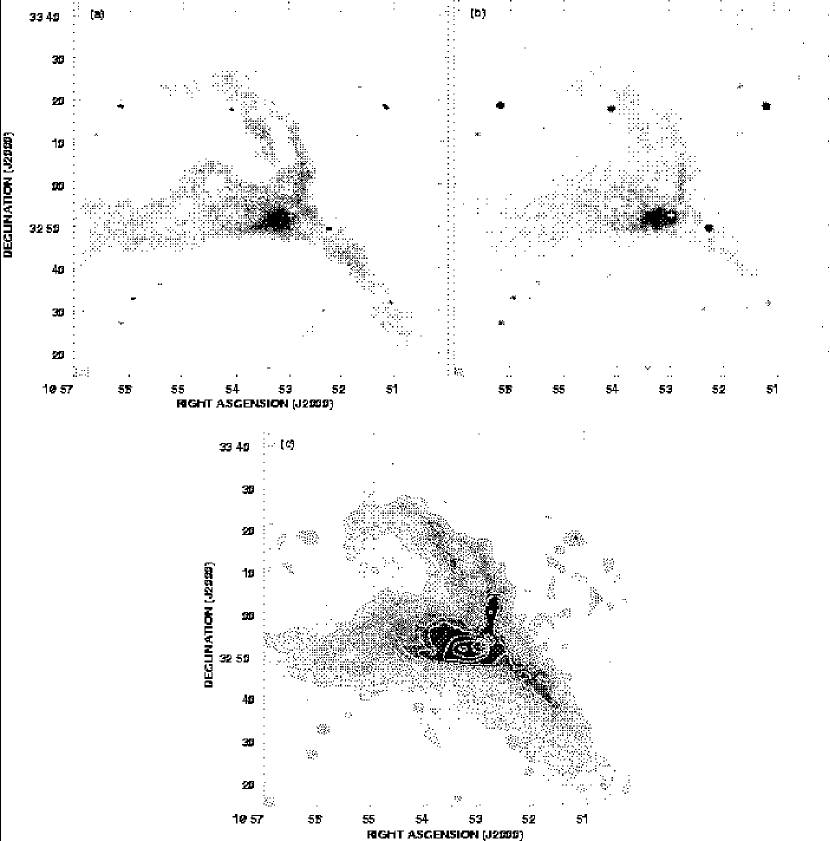
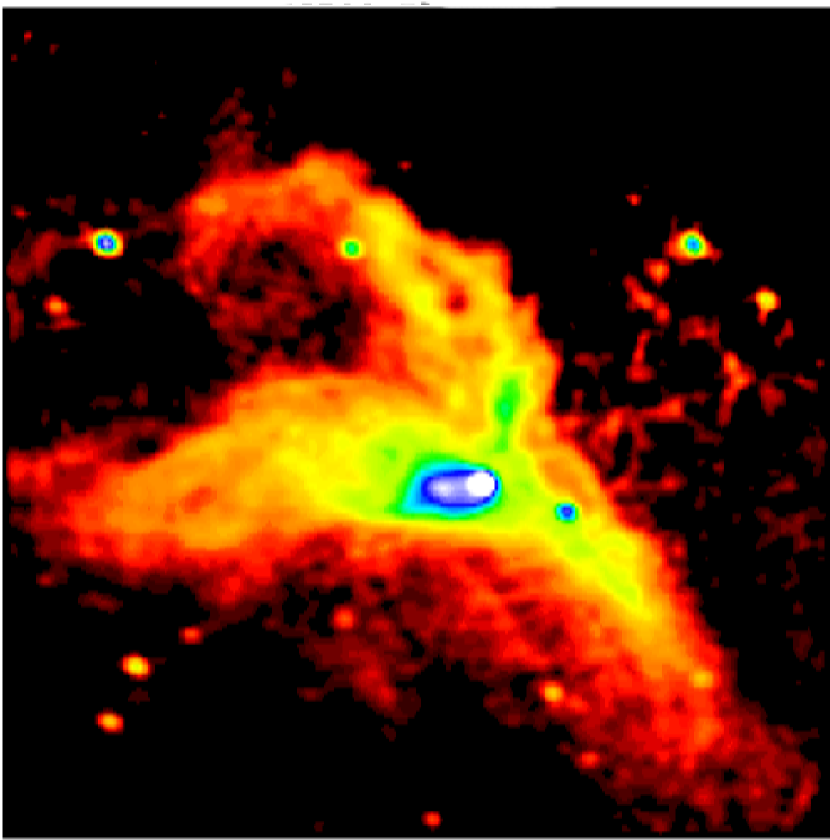
The complex structure of the extended radio remnant CTB 80 is shown in Figure 1. The top panels show the resulting images of the total intensity distribution at 240 MHz (Figure 1a) and at 324 MHz (Figure 1b). The bottom image in Figure 1 shows the SNR as observed near 1380 MHz, in greyscale and contours (Figure 1c). As noted in Sect. 2.3, at 618 MHz the faint large scale structures are attenuated due to the lack of short spacings and this image is not shown here (see Sect. 5). Figure 2 shows the new image of CTB 80 at 1380 MHz in a color representation, useful to display not only the distribution of the bright components, but also to illustrate the faint extensions of the arms revealed for the first time.
From the present data, we have determined the total flux density for CTB 80 S240MHz=99 15 Jy, S324MHz=85 9 Jy, and S1380MHz=55 5 Jy. In all cases, the errors in the flux density measurements take into account the uncertainties both in the background contribution and in the choice of the integration boundaries in addition to the inherent rms noises of the images. These values are based on Perley & Taylor’s (2003) flux density scale. When the observations are made consistent with the scale of Baars et al. (1977) the flux densities are S = 106 16 Jy, S = 91 10 Jy and S = 56 6 Jy, respectively. In Figure 3 we present the radio spectrum of CTB 80 from the integrated flux density values Sν, derived from the new observations (reduced to Baars et al. 1977 flux density scale for consistence) (black dots) and previous multiwavelength (open symbols) estimates taken from the literature (summarized in Table 2). A least-square fit to our data allows to derive a global spectral index of -0.35 0.16, in very good agreement with the =-0.35 obtained by Mantovani et al. (1985). A detailed study of spectral index variations across the SNR and a discussion about a possible spectral break at low frequencies will be published elsewhere.
One of the major contributions of this work is the high fidelity representation attained in the 1380 MHz image that has revealed considerable internal structure in the three extended arms, in spite of the faintness of the emission. The N-NE arm can be clearly traced to almost R.A. 19 56 to the E, where it bends towards the S and delineates an incomplete circle (see Figure 2). The branching in the emission of this arm around R.A. 19 53.5, decl. between +33∘ 05′ and +33∘ 20′, is also striking. The gap in the emission attains a maximum width of approximately 4′ near R.A. 19 53 11, decl. +33∘ 10′ 18′′. Another striking feature is the bright and short NS filament located along R.A. 19 52 56, near decl. +33∘ 00′, that appears as a protrusion extending to the N from the flat spectrum nebula formed around the pulsar. The high resolution image of the flat-spectrum “core” component obtained by Strom (1987) at 20 cm shows an extension of the central nebula (near R.A. , decl. , epoch 1950, plate L7 in Strom’s paper), in the direction of the feature that we detect at large scale. This correspondence suggests a connection between the two features. We will refer to this feature as the “northern protrusion” (NP in Figure 4). This feature, as well as the bifurcation in the northern arm and other morphological characteristics, are evident in the 92 cm image of CTB 80 reported by Strom & Stappers (2000) based on WSRT observations.
The SW wing also exhibits a filamentary structure. This portion of the remnant extends to declination +32∘ 20′ to the S. The presence of a narrow emission arc to the W border (near the center, at about R.A. 19 52, decl. +32∘ 52′) is also evident. This filament is separated from the central nebula by a minimum in emission (note Figure 2). The emission associated with the E wing is also patchy, with brighter spots and voids. This is the broadest of the three extended components, attaining a maximum width of about 11′.
The three bright point sources that appear overlapping CTB 80 on the N and SE arms are likely to be extragalactic and have been previously identified as TXS 1952+331, MG3 J195211+3248, and NVSS J195107+323147 (NED database).
4 Comparison of the 1380 MHz radio emission with infrared and optical features
4.1 Radio and Infrared emission
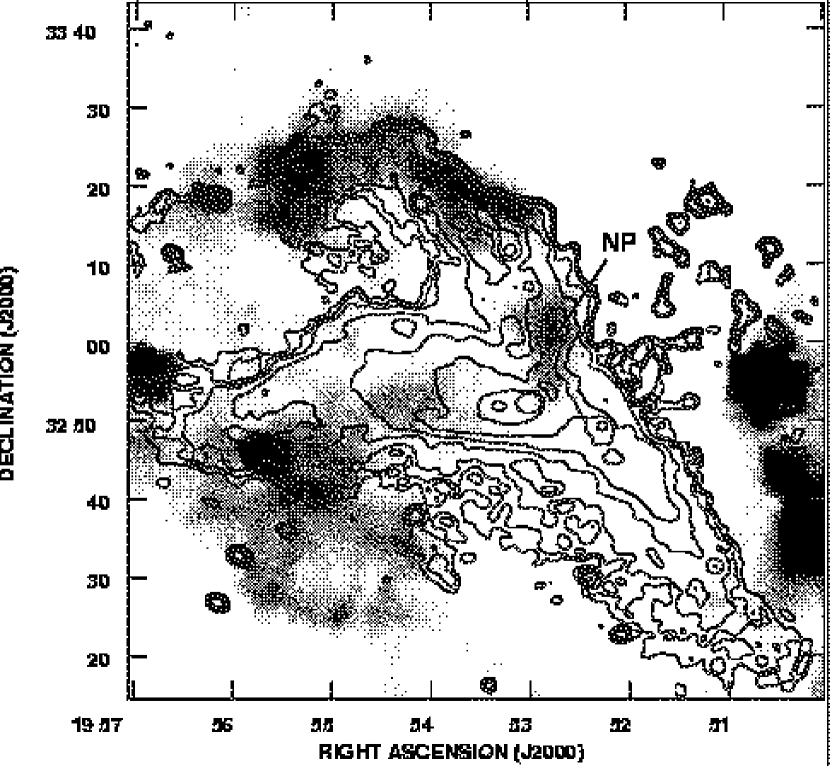
Based on IRAS HCON images Fesen, Shull, & Saken (1988) reported the discovery of an IR shell associated with CTB 80. This feature is described as an almost complete circle, open to the SW and centered at R.A.(1950)=19 52.9, decl.(1950)= +32∘ 51′ ( 2′) (R.A.(J2000)=19 54.8, decl.(J2000)= +32∘ 59′), with a diameter of about 64′. The structure is revealed by the enhanced IR emission ratio 60/100 m and appears to the N to consist of a large arc that matches the N-NE branch of CTB 80. An increase in the 60/100 m IR color is a useful tracer of shock-heated dust. Based on HI observations (beam 36′), Koo et al. (1990) report the detection of an expanding HI shell with a center, shape and neutral gas mass that matches the properties of the IR shell. Later, on the basis of HI observations carried out with higher angular resolution (beam of 1′ and 3′) Koo et al. (1993) conclude that the interstellar medium around CTB 80 consists of cold neutral clumps immersed in a warm neutral medium and suggest that the SNR has apparently encountered a cavity to the SE (that coincides with enhanced IR color).
Here we present a comparison of the new 20 cm image with the IR color distribution. Figure 4 displays an overlay of the radio contours at 1380 MHz with the 60/100 m ratio image constructed from the IRAS Sky Survey Atlas. We find that the 60/100 IR color is enhanced behind the radio shock front in all the extension of the N-NE arm of the SNR (as shown in Figures 1 and 2), in agreement with the conclusions of Fesen et al. (1988) and Koo et al. (1993). The quality of the new 20 cm radio image allows us to confirm this association and to establish the IR/radio agreement up to to the E (Koo et al. 1993 had noticed the agreement only up to positions near 19 based on the comparison with a 49 cm image, see for example Figure 9 in their paper). Moreover, in the place where the radio emission associated with the N arm of CTB 80 curves to the S in an arc at the NE extreme, delineating a faint, open circle (centered near R.A. 19 55, decl. +33∘ 15′; see for example in the color image in Figure 2), the IR enhancement perfectly matches this peculiar curved morphology. This last IR feature, weaker than the rest of the shell, has a color corrected ratio I60μm/I100μm 0.30, thus implying a dust temperature of the order of 26 K, in agreement with the Td=27.52.0 K derived by Fesen et al. (1988) for the large IR shell, and compatible with shock heated dust temperatures as observed in other SNRs (Arendt et al. 1992). We conclude that this singular termination observed in the N arm is real, and has the same nature as the rest. In addition to the general IR/radio correspondence in this part of the remnant, two aspects of the inner structure of the N arm of CTB 80 are striking: (1) the radio “northern protrusion” (NP in Figure 4), has an infrared counterpart that mimics the appearance and extension of the radio enhancement; (2) the two branches observed in the radio emission near R.A. 19 53.5, decl. +33∘ 11′ correspond with local maxima in the IR emission.
In conclusion, the present accurate IR/radio comparison provides additional support to Fesen et al’s. (1988) and Shull et al.’s (1989) suggestions that the pulsar’s relativistic electrons may rejuvenate an old shell, giving rise to the synchrotron emission where the magnetic field lines have been compressed behind radiative shocks. In addition, the morphology and brightness of the ‘northern protrusion” suggest that this structure might be tracing the link between the pulsar and the extended N radio continuum arm.
In contrast to the excellent agreement found in the N branch, little correlation between IR and radio continuum features can be shown from the morphological point of view in the rest of the proposed IR shell around CTB 80.
An interesting IR feature is the roughly elliptical ring of higher IR 60/100 ratio located to the south of CTB 80, centered near 19 55, +32∘ 30′. In displays of the 1380 MHz radio emission at the level of 4-sigma ( 12 mJy/beam), a faint radio structure (with maxima of 21 mJy/beam) is detected at the same location as this IR ring, with identical shape and diameter. No similar feature has been, however, detected at 240 and 324 MHz above the respective noise levels, suggesting that this feature may be thermal. As noticed by Mavromatakis et al. (2001) this IR feature is associated with optical filaments (see Figure 5 in the next section).
4.2 Radio and Optical emission
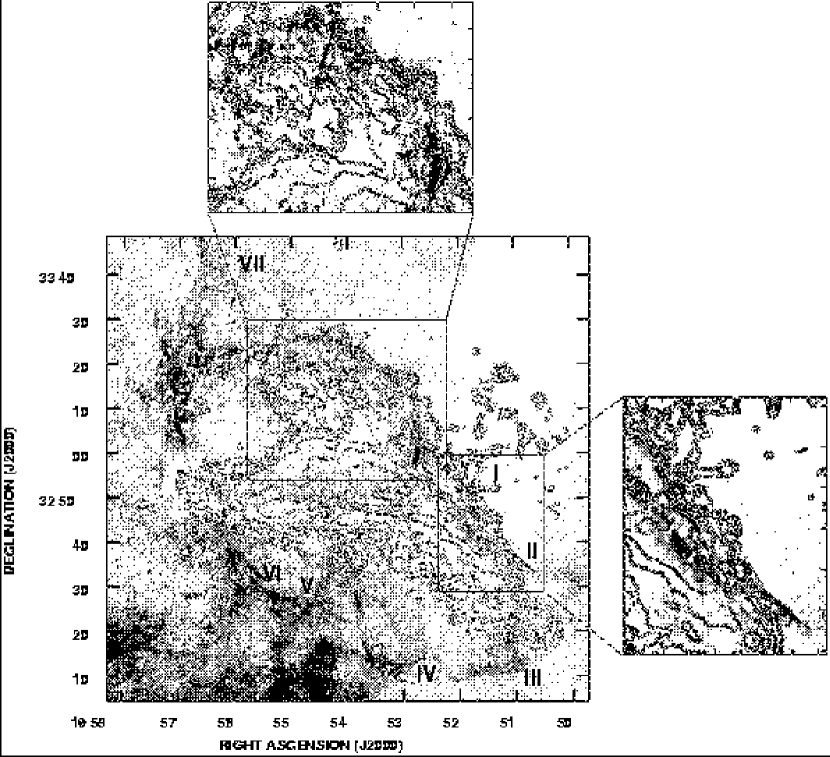
Several optical studies (narrow-band imagery and spectroscopy) have shown that the remnant consists of outlying diffuse and filamentary emission surrounding a central ring of filaments, coincident with the central radio emission peak (Blair et al. 1984 and references therein, Fesen & Gull 1985). Recently, Mavromatakis et al. (2001) have presented new optical images from deep CCD exposures in the lines Hα+[NII] 6555 , [SII] 6708 , [OII] 3727 , and [OIII] 5005 covering a 2∘ 2∘ area. These large scale images reveal new filamentary and diffuse structures to the S, SE, and N of CTB 80. Here we use these images to analyze the large-scale emission, far from the pulsar nebula.
Figure 5 shows an overlay of the radio continuum emission at 1380 MHz with the [SII] optical emission. Two enlargements of interesting areas (of size 30′) are included to facilitate the detailed comparison. The radio and optical features along the SW wing are well correlated, especially in the filament labeled I in Mavromatakis et al. (2001) (see close-up image to the right), where the optical filaments closely match the radio emission. In addition the radio/IR feature “NP” has an optical counterpart (see the top close-up image). The optical emission also reproduces the branching noticed in both radio and IR in the N-NE arm of CTB 80. The [SII] emission accompanies the radio synchrotron emission all along this arm. It is interesting to note that at the eastern extreme of this arm, near R.A. 19 55 30, decl. 33∘ 20′, short, bright optical filaments are observed in coincidence with a flattening in the radio contours and enhanced IR 60/100 ratio. It is possible that the expanding shock has encountered denser material at this location, of the kind of dense cold clumps reported by Koo et al. (1993) in the SNR shell. A dense cloud at this location may have modified the shock expansion, originating the singular “curl” observed at the termination of this arm. The bright larger optical filaments observed farther east (R.A. 19 57, decl. +33∘ 15′) correspond to the HII region LBN 156 (Lynds 1965).
While the SW filaments are conspicuous in all the optical lines, the N-NE arc is only prominent in [SII] line. [SII] is known to be a tracer of hot, shocked gas in regions where the expanding SNR shell encounters and overtakes enhancements in the surrounding gas (Fesen et al. 1997). This fact is compatible with the presence of the IR and HI shell in this portion of the SNR. In all cases, the complex of optical filaments are detected behind the shock front as delineated by the radio synchrotron emission. According to Draine & McKee (1993), the presence of shocked interstellar gas (delineated by Hα and [SII] emission) indicates the presence of radiative shocks. Regions behind such shocks undergo strong compression, resulting in both magnetic fields amplification and enhancements in the density of relativistic particles. The excellent morphological correspondence observed in CTB 80 confirms this scenario.
The filaments III and IV from the images by Mavromatakis et al. (2001) lie to the S of CTB 80 and are probably unrelated. The filaments called V and VI perfectly match the E, S, and W sides of the IR hollow feature shown in Figure 4 to be located S of CTB 80, around 19 55, +32∘ 30′. Mavromatakis et al. (2001) suggest that these filaments are also related to CTB 80. On the basis of the new sensitive radio observations, we conclude that their association with CTB 80 is unlikely. Further deep multispectral studies of this region are needed to confirm the nature of the observed emissions at optical and IR wavelengths.
5 The Pulsar Wind Nebula and its X-ray counterpart
Angerhofer et al. (1981) have characterized the central emission in CTB 80 as composed of a compact 45′′ “core” nebula immersed in a 10′ 6′ “plateau” emission. Since both components have flat spectra, compatible with a nebula powered by the pulsar wind (Castelletti et al. 2003, in preparation), we use in what follows the term PWN to describe both, the “plateau” and “core” components.
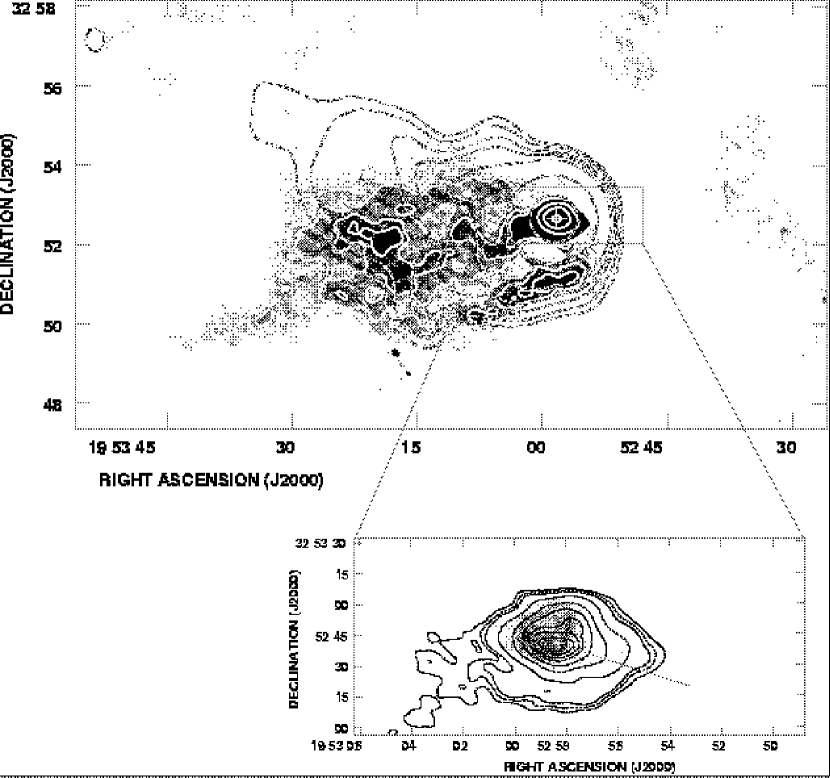
The highest resolution radio image for the plateau nebula that contains the pulsar PSR B1951+32 at the W end was obtained at 618 MHz (beam 10′′ 6′′, PA= 67∘.5). This image improves by a factor of 10 the angular resolution of Angerhofer et al.’s (1981) image of this region of the SNR. Figure 6 displays in greyscale and white contours the synchrotron emission at 618 MHz. The ROSAT PSPC X-ray data (1 to 2.4 keV) are shown in black contours (Safi-Harb et al. 1995). The X-ray data are smoothed by a 72′′ Gaussian following Safi-Harb et al. (1995). In spite of the presence of low level interferometric artifacts (striations at an angular scale of a few arcsec), this image reveals that the radio emission in the “plateau” nebula is structured and extends 8′ 4′ (5 pc 2 pc at the distance of 2 kpc). There are two prominent features in Figure 6 with intensities about five times brighter than the surrounding levels: one running along the nebula, approximately aligned in the E-W direction and the other located to the SW of the pulsar. The E-W feature appears to trail from the pulsar and has a morphology suggestive of a helix. This source has a size of about 6′ ( 3.5 pc). The narrow feature at the SW of the nebula has an extension of 3′.7 ( 2 pc). An absolute maximum of 110 mJy beam-1 is observed at the pulsar position. From the comparison of the “plateau” radio nebula with X-ray emission, two characteristics are apparent: (1) the X-ray nebulae (both the core and the extended plateau) have comparable sizes to the radio features, and both are asymmetric with extensions in the E-W direction; (2) although the radio and X-ray are similar in size and general appearance, deviations are observed in the E extreme: the radio nebula shows a bend to the S, while the X-rays emission extends to the N.
A blow-up of our image at 618 MHz of the “core” radio nebula is shown in the lower panel of Figure 6. In this enlargement, we display in black contours the 618 MHz emission, and in greys the central nebula as observed at 1.4 GHz by Strom (1987) with 1′′ resolution, in order to facilitate the comparison of the information at the different angular scales. The position of the pulsar is marked by the plus sign, and the arrow shows the direction in which the pulsar is moving according to Migliazzo et al. (2002). The “core” nebula appears slightly elongated in the E-W direction with a size of about 1′.2 ( 0.7 pc). In the close-up image included in Figure 6, a distortion towards the western edge with a position angle of 259∘ (N through E) is also observed. This position agrees within errors with the estimate by Migliazzo et al. (2002) for the pulsar motion PA=(252∘ 7∘). In general X-rays and radio radiation are in good agreement; however there is no radio counterpart for an extended “conelike” hard X-ray emission feature located SE of the pulsar, reported by Safi-Harb et al. (1995).
6 Energetics in CTB 80 and in the PWN
Based on the observed properties, we can estimate the energy content of CTB 80. The synchrotron energy consists of the kinetic energy of the relativistic particles and the energy stored in the electric and magnetic field (i.e. Poynting flux). Assuming equipartition between particles and magnetic field we estimated through the relation derived by Moffet (1975) a minimun energy content of relativistic electrons for CTB 80 in the range 5.5 1048 to 5 1049 ergs, for a ratio between the energy in relativistic electrons and energetic baryons assumed to be 1 and 50, respectively. These values, low as compared with the canonical 1051 ergs for SN, suggest that the energy required to accelerate electrons represents only a small fraction of the total energy. Most of the energy must have been dissipated in the interstellar medium as kinetic energy.
For the central components (core and plateau), based on the size of the radio nebula (assuming it is formed by the central core plus the component trailing to the E) and the pulsar velocity of 240 km s-1 derived by Migliazzo et al. (2002), we can estimate an age of 18200 yr, for the PWN. Based on the average Lorentz factor of the electrons, Safi-Harb et al. (1995) conclude that the lifetime of the X-ray emitting electrons in the plateau nebula is 20000 yr, in good agreement with the current radio results. By assuming equipartition, we find that the energy content in relativistic particles in the PWN (plateau plus core) is in the range 1.3 1047 to 1.2 1048 ergs (for an energy ratio between electrons and baryons of 1 and 50, respectively). The spin-down energy loss rate for PSR B1951+32 has been estimated as Ė = 3.7 1036 ergs sec-1 (Kulkarni et al. 1988). Thus the energy injected by the pulsar during a total lifetime of 64 kyr (Migliazzo et al. 2002) is expected to be E 7 1048 ergs, in reasonable agreement with the energy content observed in relativistic electrons in the PWN when equipartition is assumed.
We have estimated the magnetic field of the plateau nebula G)=1040(/1012Hz)-1/3 (/1000 yr)-2/3 (Pacholczyk 1970). To estimate the cutoff frequency , we follow Chevalier’s (2003) analysis for 3C 58 and MSH 15-52. Chevalier (2003) suggests that the fact that the X-ray nebula extent is comparable to that of the radio nebula indicates that is not much lower than X-ray energies, assuming that particles originate close to the pulsar and then disperse in the nebula. The case for the extended nebula associated with PSR B1951+32 is analogous. We thus adopt a break frequency 2.4 1016 Hz. Based on this frequency and the estimated age for the nebula tneb 18200 yr, the nebular magnetic field is 5.2 G. This field is in reasonable agreement with the 3.4 G derived by Safi-Harb et al. (1995) based on X-ray data, and comparable to the 3C 58 and MSH 15-52 magnetic fields (16 and 8 G, respectively).
On the other hand, the total pressure of the plateau component of the PWN can be estimated as (2/3) (), where is the source volume. We obtain a total pressure of to , which easily satisfies the condition for confinement of the wind ( ) for an ambient density of 0.5 H atoms cm-3. For the core region, the total pressure is in the range to .
7 Summary
We have presented new images of the SNR CTB 80 at 240 MHz, 324 MHz, 618 MHz, and 1380 MHz, using the GMRT and VLA. The radio images obtained at all the different frequencies display the same underlying morphology. The new images reveal the faint wings of CTB 80 in their full extent. The northern arm exhibits a peculiar bifurcation in the emission, with a low intensity gap between the two edges. Also a bright feature, called the “northern protrusion” appears as an extension of the pulsar wind nebula to the north, suggesting that this may be the link between the pulsar energy and the radiation in the extended N arm of CTB 80. The SW arm also exhibits a filamentary structure. The central E-W component is the broadest and is patchy in appearance. From the comparison of the high resolution and sensitivity radio data at 1380 MHz with the IR shell proposed by Fesen et al. (1988) to be associated with CTB 80, we conclude that there is an excellent agreement between radio continuum emission and IR color all along the N arm of the SNR. Moreover, with the sensitivity attained at 1380 MHz the N arm of CTB 80 is shown to have a peculiar curved termination at its eastern extreme, in concordance with a similar feature in the IR. Little IR/radio correspondence is, however, observed associated with the E and SW arms of CTB 80. Optical filaments prominent in the [SII] line are observed to accurately match the radio emission along the W and N edges of CTB 80. In all cases, the optical emission is detected behind the shock front as delineated by the radio emission.
The pulsar wind nebula (the “core” plus “plateau”) was investigated with arcsec resolution at 618 MHz. The new radio image shows with unprecedented detail the presence of a helicoidal bright trail behind the pulsar “core” nebula and a distortion in the “core” nebula in the direction of motion of the pulsar PSR B1951+32. The correspondence between the radio synchrotron nebula and the 1-2.4 keV X-rays associated with the PWN is also striking. However the images in the X-ray and radio diverge in the plateau at about 8′ E from the pulsar. In effect, while the radio emission at all the observed frequencies is clearly aligned in the E-W direction with a slight bend to the S, the X-ray nebula covers approximately the same extension but curves to the N.
From the present data we have estimated the total energy carried by relativistic electrons in CTB 80 to lie in the range 5.5 1048 to 5 1049 ergs; while for the PWN the energy content is between 1.3 1047 and 1.2 1048 ergs, depending on the particle composition. The total pressure in the nebula has been estimated to . A magnetic field of about 5.2 G has also been estimated for the PWN.
A subsequent paper (Castelletti et al. 2003 in preparation) will deal with local spectral index variations in the entire source. The study of spectral distribution may help to understand the role of the pulsar in influencing the shape and energetics of this peculiar SNR.
References
- Angerhofer, Wilson & Mould (1980) Angerhofer, P. E., Wilson, A. S., & Mould, J. R. 1980, ApJ, 236, 143.
- Angerhofer et al. (1981) Angerhofer, P. E., Strom, R. G., Velusamy, T., & Kundu, M. R. 1981, A&A, 94, 313.
- (3) Arendt, R., Dwek, E., & Leisawitz, D. 1992, ApJ, 400, 562.
- (4) Baars, J. W. M., Genzel, R., Pauliny-Toth, I. I. K., Witzel, A. 1977, A&A, 61, 99.
- (5) Bennett, A. S. 1963, MNRAS, 127, 3.
- (6) Blair, W. P., Kirshner, R. P., Fesen, R. A., & Gull, T. R. 1984, ApJ, 282, 161.
- (7) Chang, H. K., & Ho, C. 1997, ApJ, 479, L125.
- (8) Chevalier, R. A. 2003, astro-ph/0301370.
- (9) Cornwell, T. J. 1988, A&A, 202, 316.
- (10) Cornwell, T. T., & Perley, R. A. 1992, A&A, 261, 353.
- (11) Cornwell, T. T., Briggs, D. S., & Holdaway, M. A. 1996, User’s Guide to SDE, (Socorro, NM:NRAO).
- (12) Draine, B. T., & McKee, C. F. 1993, ARA&A, 31, 373.
- (13) Dubner, G., Holdaway, M., Goss, W. M., & Mirabel, I. F. 1998, AJ, 116, 1842.
- (14) Felli, M., Tofani, G., Fanti, C., & Tomasi, P. 1977 A&AS, 27, 181.
- (15) Fesen, R. A., & Gull, T. R. 1985, Astrophys. Lett., 24, 197.
- (16) Fesen, R. A., Shull, M. J., & Saken, J. M. 1988, Nature, 334, 229.
- (17) Fesen, R. A., Winkler, P. F., Rathore, Y., Downes, R. A., Wallace, D., & Tweedy, R. W. 1997, AJ, 113, 767.
- (18) Gaensler, B. M. 1999, Ph.D. thesis, University of Sidney.
- (19) Galt, J. A., & Kennedy, J. .E. D. 1968, AJ, 73, 135.
- (20) Green, D. A. 2001, A Catalogue of Galactic Supernova Remnants, Mullard Radio Astronomy Observatory, Cambridge, United Kingdom (2001).
- (21) Haslam, C. G. T., Salter, C. J., Stoffel, H., & Wilson, W. E. 1982, A&AS, 47, 1.
- (22) Hester, J. J., & Kulkarni, S. R. 1989, ApJ, 340, 362.
- (23) Holdaway, M. 1999 in Synthesis Mapping in Radio Astronomy II, ASP Conference Series, ed. G. B., Taylor, C. L. Carilli, & R. A. Perley, Vol. 180, 40.
- (24) Koo, B-C., Reach, W. T., Heiles, C., Fesen, R. A., & Shull, J. M. 1990, ApJ, 364, 178.
- (25) Koo, B-C., Yun, M. S., Ho, P. T. P., & Lee, Y. 1993, ApJ, 417, 196.
- (26) Kovalenko, A. B., Pynzar, A. V., & Udal’tsov, V. A. 1994, Astronomy Reports, 38, 78.
- (27) Kulkarni, S. R., Clifton, T. C., Backer, D. C., Foster, R. S., Fruchter, A. S., & Taylor, J. H. 1988, Nature, 331, 50.
- (28) Lingxiang, C., Tipei, L., Xuejun, S., Yuqian M., & Mei, W. 1993, Ap&SS, 213, 135.
- (29) Lynds, B. T. 1965, ApJS, 12, 163.
- (30) Mantovani, F., Reich, W., Salter, C. J., & Tomasi, P. 1985, A&A, 145, 50.
- (31) Mavromatakis, F., Ventura, J., Paleologou, E. V., & Papamastorakis, J. 2001, A&A, 371, 300.
- (32) Migliazzo, J. M., Gaensler, B. M., Backer, D. C., Stappers, B. W., van der Swaluw, E., & Strom, R. G. 2002, ApJ, 567, L141.
- (33) Moffet, A. T. 1975, in Star and Stellar Systems in Galaxies and the Universe, ed. A., Sandage, M., Sandage, & J. Kristian, Vol. 9, 236.
- (34) Napier, P. J., & Crane, P. C. 1982, in Synthesis Mapping, Proceedings of NRAO-VLA Workshop, Signal to Noise Ratios, ed. A. R., Thompson & L. R., D’Addario, 3-1.
- (35) Ögelman. H, & Buccheri, R. 1987, A&A, 186, L17.
- (36) Pacholczyk, A. G. 1970, Radio Astrophysics (San Francisco: Freeman).
- (37) Pauliny-Toth, I. I. K., Wade, C. M., & Heeschen, D. S. 1966, ApJS, 13, 65.
- (38) Perley, R. A. 1999, in Synthesis Imaging in Radio Astronomy II, ASP Conference Series, ed. G. B. Taylor, C. L. Carilli, & R. A. Perley,Vol. 180, 275.
- (39) Perley, R. A., & Taylor, G. 2003, VLA Calibrator Manual, http://www.aoc.nrao.edu/gtaylor/calib.html.
- (40) Ramanamurthy, P. V. et al. 1995, ApJ, 447, L109.
- (41) Reich, W., Reich, P., & Fürst, E. 1990, A&AS, 83, 539.
- (42) Safi-Harb, S., Ögelman, H., & Finley, J. P. 1995, ApJ, 439, 722.
- (43) Shull, J. M., Fesen, R. A., & Saken, J. M. 1989, ApJ, 346, 860.
- (44) Sofue, Y., Takahara, F., Hirabayashi, H., Inoue, M., & Nakai, N. 1983, PASJ , 35, 437.
- (45) Strom, R. G., Angerhofer, P. E., & Dickel, J. R. 1984, A&A, 139, 43.
- (46) Strom, R. G. 1987, ApJ, 319, L103.
- (47) Strom, R. G., & Stappers, B. W. 2000, Pulsar Astronomy -2000 and Beyond, ASP Conference Series, Vol. 202, 509, Proceedings of the 177th Colloquium of the IAU, ed. M. Kramer, N. Wex, and N. Wielebinski.
- (48) Swarup, G., Ananthakrishnan, S., Kapahi, V. K., Rao, A. P., Subrahmanya, C. R., & Kulkarni, V. K. 1991, Current Science, 60, 95.
- (49) Velusamy, T., & Kundu, M. R. 1974, A&A, 32, 375.
- (50) Velusamy, T., Kundu, M. R., & Becker, R. H. 1976, A&A, 51, 21.

| GMRT Observations | ||
|---|---|---|
| Central frequency | 240 MHz | 618 MHz |
| Field center (J2000) | 19 53 21, +32 55 42 | 19 53 21, +32 55 42 |
| Observing dates | May 6, 7 2002 | May 7, 8 2002 |
| Min. and max. baselines | 52 m - 26 km | 52 m - 26 km |
| Bandwidth | 8 MHz | 16 MHz |
| Total observing time | 10 hours | 10 hours |
| Main Calibrators and assumed | 3C 48 (50 Jy) | 3C 48 (29 Jy) |
| flux densities aaVLA Calibrator Manual 2003, (http://www.aoc.nrao.edu/gtaylor/calib.html). | 3C 286 (28 Jy) | 3C 286 (21 Jy) |
| FWHM of primary beam | 150′ | 54′ |
| Synthesized beam | 26′′ (EW) 17′′ (NS) | 10′′ (EW) 6′′ (NS) |
| Position angle (E to N) | 76∘.92 | 67∘.46 |
| Noise level | 4.6 mJy/beam | 0.6 mJy/beam |
| VLA Observations | ||
| Central Frequency | 324 MHz | 1380 MHz |
| Configurations | C and D | D and single dish bbData taken from the Bonn-100 m 1408 MHz Survey (Reich, Reich, & Fürst 1990). |
| Field center (J2000) | 19 52 58, +32 55 41 | 19 55 42, +32 32 33 |
| Observing dates | March 21 2000, Aug. 14 2000 | Jan. 3 1994, April 3 1995 |
| Min. and max. baselines | 35 m - 3.3 km | 35 m - 1.03 km |
| Bandwidth | 3 MHz | 50 MHz |
| Total observing time | 11.5 hours | 7.5 hours |
| Main Calibrators and assumed | 3C 286 (25 Jy) | 3C 286 (14.55 Jy) |
| flux densities aaVLA Calibrator Manual 2003, (http://www.aoc.nrao.edu/gtaylor/calib.html). | 3C 48 (42.8 Jy) | |
| FWHM of primary beam | 139′ | 32′ |
| Synthesized beam | 73′′ 63′′ | 93′′ 78′′ |
| Position angle (E to N) | -88∘ | 72∘ |
| Noise level | 14 mJy/beam | 4 mJy/beam |
| Frequency | Integrated Flux | References |
|---|---|---|
| (MHz) | (Jy) | |
| 83 | 90 15 | Kovalenko, Pynzar, & Udal’tsov (1994) |
| 111 | 80 15 | Kovalenko, Pynzar, & Udal’tsov (1994) |
| 178 | 60 12 | Bennett (1963) |
| 240 | 106 16 | Present work aaReduced to Baars et al.’s (1977) scale for consistency. |
| 324 | 91 10 | Present work aaReduced to Baars et al.’s (1977) scale for consistency. |
| 408 | 67 13 | Felli et al. (1977) |
| 408 | 67.5 10.5 | Mantovani et al. (1985) |
| 408 | 83 15 | Haslam et al. (1982) |
| 750 | 127 15 | Velusamy, Kundu, & Becker (1976) |
| 750 | 75 8 | Pauliny-Toth, Wade, & Heeschen (1966) |
| 1000 | 121 15 | Velusamy, Kundu, & Becker (1976) |
| 1380 | 56 6 | Present work aaReduced to Baars et al.’s (1977) scale for consistency. |
| 1400 | 75 8 | Pauliny-Toth, Wade, & Heeschen (1966) |
| 1410 | 62 9 | Mantovani et aal. (1985) |
| 1420 | 80 10 | Galt & Kennedy (1968) |
| 1720 | 66 5 | Mantovani et al. (1985) |
| 2695 | 51 4 | Mantovani et al. (1985) |
| 2700 | 42.2 3.0 | Velusamy & Kundu (1974) |
| 4750 | 44 3.3 | Mantovani et al. (1985) |
| 10200 | 18.8 1.3 | Sofue et al. (1983) |