E-mail: mrejkuba@eso.org
The distance to the giant elliptical galaxy NGC 5128 ††thanks: Based on observations collected at the European Southern Observatory, Paranal, Chile, within the Observing Programmes 63.N-0229, 65.N-0164, 67.N-503, 68.B-0129 and 69.B-0292 and at La Silla Observatory, Chile, within the Observing Programme 64.N-0176(B).
The distance to NGC 5128, the central galaxy of the Centaurus group and the nearest giant elliptical to us, has been determined using two independent distance indicators: the Mira period-luminosity (PL) relation and the luminosity of the tip of the red giant branch (RGB). The data were taken at two different locations in the halo of NGC 5128 with the ISAAC near-IR array on ESO VLT. From more than 20 hours of observations with ISAAC a very deep -band luminosity function was constructed. The tip of the RGB is detected at mag. Using an empirical calibration of the -band RGB tip magnitude, and assuming a mean metallicity of dex and reddening of , a distance modulus of NGC 5128 of was derived. The comparison of the -band RGB tip magnitude in NGC 5128 and the Galactic Bulge implies a distance modulus of NGC 5128 of in good agreement with the -band RGB tip measurement. The inner halo field has larger photometric errors, brighter completeness limits and a larger number of blends. Thus the RGB tip feature is not as sharp as in the outer halo field. The population of stars above the tip of the RGB amounts to 2176 stars in the outer halo field (Field 1) and 6072 stars in the inner halo field (Field 2). The large majority of these sources belong to the asymptotic giant branch (AGB) population in NGC 5128 with numerous long period variables. Mira variables were used to determine the distance of NGC 5128 from a period-luminosity relation calibrated using the Hipparcos parallaxes and LMC Mira period-luminosity relation in the -band. This is the first Mira period-luminosity relation outside the Local Group. A distance modulus of was derived, adopting the LMC distance modulus of . The mean of the two methods yields a distance modulus to NGC 5128 of corresponding to Mpc.
Key Words.:
Galaxies: elliptical and lenticular, cD – Galaxies: stellar content – Stars: fundamental parameters – Galaxies: individual: NGC 51281 Introduction
Thanks to its proximity NGC 5128 (Centaurus A) has attracted lots of attention. It is the closest representative of the active radio galaxy and giant elliptical galaxy class of objects and is among the nearest AGNs. The latest review (Israel israel98 (1998)) summarises its characteristics and it is a good starting point for the vast literature about this galaxy. It also gives a summary of distance determinations, which started converging in the last decade from the early highly uncertain values ranging between 2.1 and 8.5 Mpc (Sersic sersic58 (1958), Sandage & Tammann sandage&tammann74 (1974)) towards a less uncertain range between 3.2 Mpc (Hui et al. hui+93 (1993)) and 4.2 Mpc (Tonry et al. tonry+01 (2001)).
The recent determinations of distance to NGC 5128 applied a range of methods. Hui et al. (hui+93 (1993)) used the planetary nebula luminosity function to derive a distance modulus of mag. The globular cluster luminosity function was analysed by Harris et al. (harris+88 (1988)) yielding mag. More recent globular cluster searches in this galaxy (e.g. Rejkuba rejkuba01 (2001), Peng pengPhD (2003)) will allow a more precise determination of distance with this method through a much better sampled globular cluster luminosity function.
The luminosity of the red giant branch (RGB) tip stars in the -band is a recognised distance indicator (e.g. Lee et al. lee+93 (1993)). In NGC 5128 it was first used by Soria et al. (soria+96 (1996)) who resolved the stellar halo using HST+WFPC2. They derived a distance modulus of mag for WF chips and mag for the PC chip, and adopted a mean distance modulus of mag. More recently, Harris et al. (harris+99 (1999)) used deeper HST+WFPC2 photometry in a less crowded field to derive the distance. Their RGB tip luminosity analysis resulted in mag. Moreover, the same authors adjusted the Hui et al. (hui+93 (1993)) distance modulus to , increasing it by 0.2 mag in order to correct for the contemporary Local Group distance scale and the M31 distance of (van den Bergh vandenbergh95 (1995), Harris harris99 (1999)).
More than the planetary nebula luminosity function, the surface brightness fluctuations (SBF) method received several revisions of its calibration zero point. Tonry & Schechter (tonry&schechter90 (1990)) first derived using I-band SBF. This value was subsequently revised to by Israel (israel98 (1998)) who used the results from Tonry (tonry91 (1991)) and then to by Marleau et al. (marleau+00 (2000)) after Tonry et al. (tonry+97 (1997)). Most recently, Tonry et al. (tonry+01 (2001)) report -band SBF yielding a distance modulus of . In their list of nearby galaxies with SBF distance measurements, NGC 5128 occupies place and is the nearest giant elliptical galaxy. The distance modulus determinations from the literature are summarized in Table 1.
| # | DM (mag) | Method | Reference |
|---|---|---|---|
| 1 | 26.6 | Stellar luminosity function (LF) | Sersic sersic58 (1958) |
| 2 | 29.6 | Largest HII regions | Sandage & Tammann sandage&tammann74 (1974) |
| 3 | Planetary nebula LF | Hui et al. hui+93 (1993) | |
| 4 | Planetary nebula LF | (3) revised by Harris et al. harris+99 (1999) | |
| 5 | Globular cluster LF | Harris et al. harris+88 (1988) | |
| 6 | -band RGB tip (WF chips of WFPC2) | Soria et al. soria+96 (1996) | |
| 7 | -band RGB tip (PC chip of WFPC2) | Soria et al. soria+96 (1996) | |
| 8 | -band RGB tip (WFPC2) | Harris et al. harris+99 (1999) | |
| 9 | -band SBF | Tonry & Schechter tonry&schechter90 (1990) | |
| 10 | -band SBF | (9) revised by Israel israel98 (1998) | |
| 11 | -band SBF | (9) revised by Marleau et al. marleau+00 (2000) | |
| 12 | -band SBF | Tonry et al. tonry+01 (2001) |
In this paper I use Mira variables from the long period variable star catalogue in NGC 5128 (Rejkuba et al. 2003a ) and the and -band luminosity functions to derive independent measurements of distance to NGC 5128. Data are briefly described in Sect. 2, and in Sect. 3 , , and -band luminosity functions are analysed. The distance to NGC 5128 is derived from the RGB tip magnitude in Sect. 4.1. The Mira period-luminosity (PL) diagram is constructed in Sect. 4.2 and used to determine the distance to NGC 5128. Finally the results are summarized in Sect. 5.
2 The data and photometry
Data used here were described in detail in Rejkuba et al. (rejkuba+01 (2001) and 2003a ). They consist of a set of 20 -band epochs, 1 , and 1 -band image of a field located north-east from the center of NGC 5128 (Field 1). The second field (Field 2) was observed once in the and -bands and 24 times in the -band. It is located south from the galactic center. All the observations, except one -band epoch of Field 2, were taken with the ISAAC near-IR array at UT1 (Antu) telescope at ESO Paranal Observatory in service mode. The additional -band observation of Field 2 was secured during an observing run with the SOFI near-IR array on the NTT at ESO La Silla Observatory under exceptional seeing conditions.
For the details about the photometry and completeness simulations the reader is referred to the above mentioned papers. The photometry is complete more than 50% in the and -bands for stars brighter than 22.5 for Field 1 and 21.6 for Field 2. The 50% completeness limit for the -band is 23.25 and 22.5 mag for Field 1 and 2, respectively.
Multi-epoch -band observations span a 1197 day interval and were used to search for variable stars. A total of 1504 red variables were detected in the two halo fields. For 1146 variables with at least 10 good measurements, periods, amplitudes and mean magnitudes were determined using Fourier analysis and non-linear sine-curve fitting algorithms. Almost all these variables belong to the class of long period variables (LPVs) with Mira and semiregular variable stars. The complete catalogue of all LPVs is presented in Rejkuba et al. (2003a ) to which reader is referred for discussion of completeness and accuracy of period and amplitude determination.
The ISAAC filters used are , and . The filter was preferred over , due to the red leakage of the latter. It is centered at 1.24 m and has a width of 0.16 m. The transformation to the -band of the LCO photometric system (Persson et al. persson+98 (1998)) was obtained through the following transformation (Chris Lidman private communication):
| (1) |
The ISAAC and filters are on the LCO photometric system.
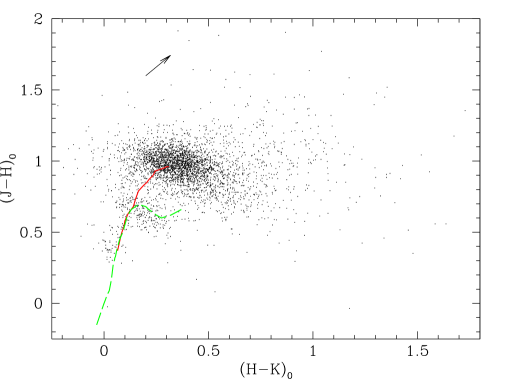
It should be noted that to all the -band magnitudes from the catalogue (Rejkuba et al. 2003a ) a constant of 0.1 mag has been subtracted. A comparison of the color-color diagrams with the intrinsic colors of Galactic dwarfs and giants (Bessell & Brett bessell+brett88 (1988)) has revealed an error in the aperture correction of the -band photometry. For reference the vs. color-color diagram is shown in Fig. 1 with the Bessell & Brett (bessell+brett88 (1988)) fiducials overplotted. The solid line indicates the intrinsic colors of early to late type giants and the long-dashed line is for dwarfs. Foreground Galactic stars are found along these lines. The large majority of the stars in NGC 5128 are found close to the locus of late type giants and redwards from there, where long period variables and carbon stars are located. NGC 5128 photometry has been de-reddened adopting (Schlegel et al. schlegel+98 (1998)) and the Cardelli et al. (cardelli+89 (1989)) reddening law and it has been transformed to the Bessell & Brett (bessell+brett88 (1988)) photometric system using the transformation equations available from the 2MASS web page111http://www.astro.caltech.edu/jmc/2mass/v3/transformations/.
3 Luminosity functions
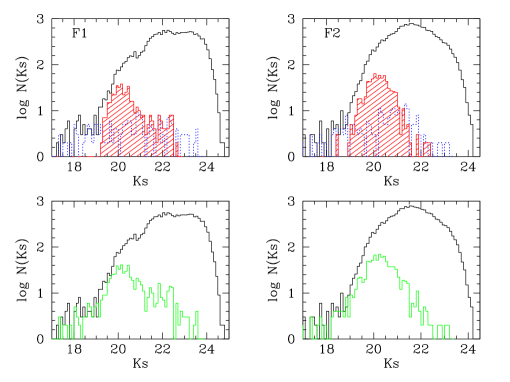
The -band luminosity functions for all the stars in Field 1 (left) and 2 (right) are shown in Fig. 2 as solid line histograms. These are not corrected for incompleteness nor for Galactic foreground contamination. The number of foreground Milky Way stars can be obtained from the color-color diagram (Fig. 1) or from optical-near-IR color-magnitude diagrams published by Rejkuba et al. (rejkuba+01 (2001)). There are 194 stars with near-IR colors consistent with dwarf or early type giants in the Field 1 color-color diagram. Similarly, sources have blue colors in the CMD (see Rejkuba et al. rejkuba+01 (2001)). They are plotted as a dotted histogram in Fig. 2. These stars are mostly foreground Galactic stars as well as young blue and red supergiants in Field 1. The variable star luminosity function is plotted as a shaded histogram. It is clear that majority of the variables have luminosities brighter than the RGB tip (see below) and are in the thermally pulsing asymptotic giant branch (TP-AGB) phase. In the lower panels the total luminosity functions are compared with the luminosity functions of the sums of the contributions of foreground stars and LPVs.
There are stars in Field 1 above the tip of the RGB (, see next section) detected in at least 3 -band images. of these sources have not been detected in and/or -band frames. According to the CMD, 192 stars have blue colors and they belong either to the young population in Field 1 or to the Galactic foreground. Among the remaining 1984 stars 426 are variable stars (accounting for 71% of variables detected in this field).
In Field 2 there are 6072 sources brighter than detected in at least -band images. of these sources have not been detected in and/or -band frames. Of these objects have blue colors and belong to the Galactic foreground contamination. Of the remaining stars brighter than the RGB tip are asymptotic giant branch (AGB) variables (accounting for 92% of detected variables in this field).
Some of the bright non-variable AGB giants could be blends of 2 RGB tip stars. Renzini (renzini98 (1998)) provided the equations that enable the calculation of the expected number of stars in a given evolutionary phase () in an image in which the total sampled luminosity is :
| (2) |
is the specific evolutionary flux of the population or the number of stars entering or leaving any post main sequence evolutionary stage per year and per solar luminosity of the population. It is a very weak function of age and ranges from to stars L yr-1, as age increases from 10 Myr to 15 Gyr. is the duration of the evolutionary phase. For a solar-metallicity, 15 Gyr old population . We can estimate the total sampled luminosity in the two fields by summing the observed counts on the dark subtracted, flat-fielded, sky-subtracted and calibrated frames. Using the combined frames for the reference epoch observed on JD=2451734, the total sampled luminosity is L☉ and L☉ for Field 1 and 2, respectively. From the surface brightness profile of Dufour et al. (dufour+79 (1979)) the total luminosities are and L☉, while from that of Mathieu et al. (mathieu+96 (1996)) they are and L☉. Our measured value for Field 1 is close to that of Dufour et al., but the measured luminosity of Field 2 is much lower.
From Table 1 of Renzini (renzini98 (1998)) the expected number of LPVs in an old near-solar metallicity population is L☉. The total sampled luminosity of Field 1 is 50-100 times higher, yielding 250-500 LPVs in agreement with the 437 LPVs detected in that field (Rejkuba et al. 2003a ). In Field 2 our measured luminosity would suggest LPVs, but the surface brightness measurements from the literature predict LPVs. For comparison, we have detected 903 variable stars and measured periods for 709 LPVs in Field 2.
The probability that a pixel contains two stars in phase is and the number of 2-star blends in a frame with a total number of pixels is:
| (3) |
The resolution of ground based images is worse than 1 pixel and the sampled luminosity has to be divided by the available number of resolution elements. Each resolution element is for Field 1 and for Field 2, corresponding to the best seeing epochs used to detect sources. Hence the expected number of blends of two RGB tip giants in Field 1 is between 100 and 400 for the total sampled luminosity between 5 and L☉. In Field 2 it is if the measured luminosity from the image is assumed, but it rises to for L☉ from Mathieu et al. The expected number of blended stars in the vicinity of the RGB tip is low enough to measure the RGB tip discontinuity in the luminosity function of Field 1, but may smear out that feature in Field 2. Taking the highest probable number of blends, there are at least 1150 non-variable bright AGB giants in Field 1 and some 150 in Field 2. Rejkuba et al. (2003a ) made extensive simulations and estimated the completeness of the detection of LPVs as a function of their magnitude, period and amplitude. These simulations show a similar completeness level of the LPV catalogue in the two fields implying that the number of bright extended giant branch non-variable stars is larger in Field 1. However, these stars could be semi-regular small-amplitude () variables for which the LPV catalogue is less complete. Their near-IR properties will be discussed together with near-IR properties of the LPVs in a forthcoming paper (Rejkuba et al. in preparation).
LPVs account for at least 26% and 70% of the extended giant branch population in Fields 1 and 2, respectively. Their high luminosity cut-off extends beyond . The maximum brightness achieved by AGB stars is evidence for the presence of an intermediate-age population.
4 NGC 5128 distance
In this section the distance to NGC 5128 is measured using two different methods: (i) the brightness of the RGB tip in the and -bands and (ii) the Mira period-luminosity relation.
4.1 RGB tip
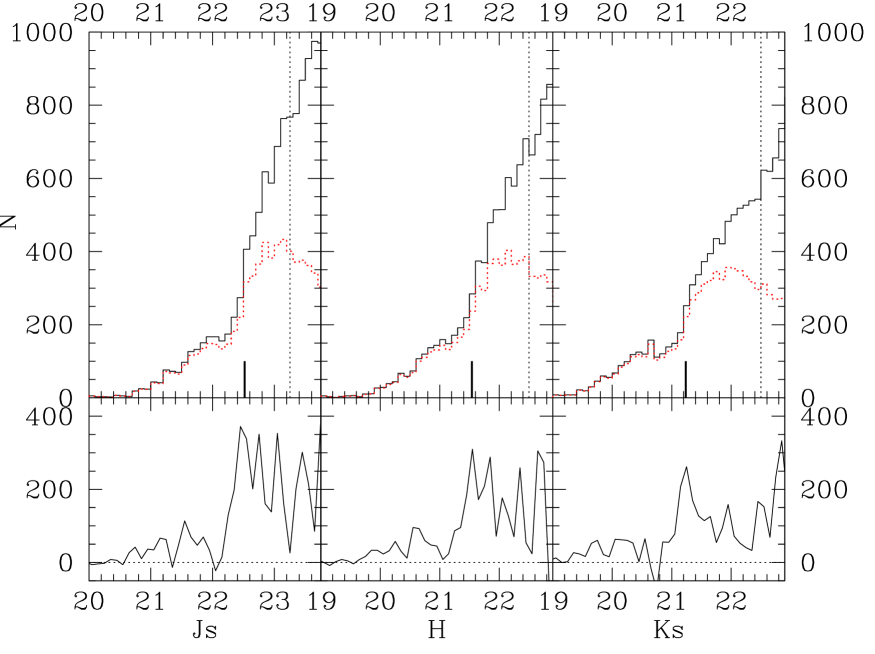
The , and -band luminosity functions of Field 1 stars are presented in Fig. 3. These are the deepest luminosity functions for a stellar population belonging to a galaxy beyond the Local Group. The solid lines are used for completeness-corrected luminosity functions and dotted lines for the observed ones. Vertical dotted line indicates 50% completeness limit of the photometry. Short thick marks indicate the measured RGB tip magnitudes in Field 1.
In the bottom panels of Fig. 3 I show the luminosity functions convolved with the Sobel edge detection filter with a kernel (Lee et al. lee+93 (1993)). They are used as localised slope estimators with 2-point smoothing.
There is a very sharp peak in the Field 1 response function curve at , , and . For easier comparison with the models and literature, the -band measurement is transformed to the LCO photometric system according to Eqn. 1. These maxima appear at the position where there is a strong change in the slope of the RGB luminosity function and it corresponds to the magnitude of the tip of the RGB. The error in the RGB tip magnitude is obtained by averaging over 100 different measurements of Sobel kernel peak magnitude, where luminosity function sampling is varied by 0.001 mag over 0.08 to 0.2 mag.
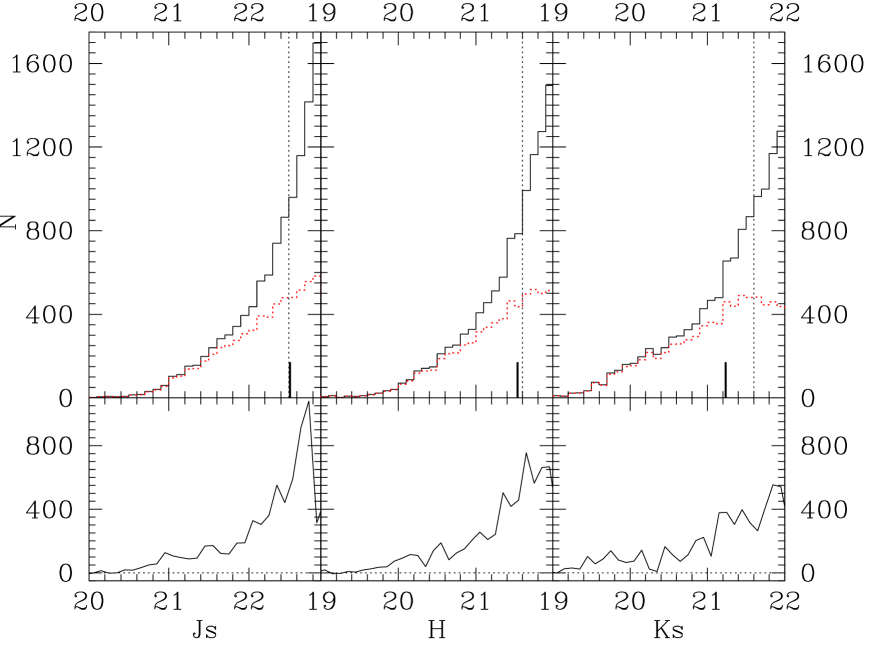
The RGB tip feature is smoothed over a couple of tenths of magnitude in Field 2 (Fig. 4). From the 2-point Sobel kernel, the RGB tip in Field 2 is centered around mag. The broadening and smoothing of the peak is due to much shallower completeness limits (note the short thick marks indicating the RGB tip magnitude measured in Field 1), resulting in larger photometric errors, as well as due to contribution of blends, the presence of AGB stars and a larger metallicity spread in this field.
The tip of the RGB in the -band is a function of metallicity. Its dependence has been measured empirically by Ferraro et al. (ferraro+00 (2000)) using a set of Galactic globular clusters with a range of metallicities. They obtained the following relation:
| (4) |
The mean metallicity for the stars in the NGC 5128 halo has been inferred to be around dex (Marleau et al. marleau+00 (2000), Harris & Harris harris+harris00 (2000), Rejkuba rejkubaPhD (2002)). With this estimate, and assuming a reddening of (Schlegel et al. schlegel+98 (1998)), corresponding to (Cardelli et al. cardelli+89 (1989)), the empirical calibration of the RGB tip -band magnitude can be used to derive the distance to NGC 5128. The difference between the photometric bands is of the order of 0.01 mag (Persson et al. persson+98 (1998)). This yields a distance modulus of . The quoted error does not include the uncertainty in reddening and in mean metallicity of the stars. A higher mean metallicity by 0.1 dex implies a larger distance modulus by 0.06 mag. The -band is rather insensitive to extinction, and reddening as high as would lower the distance modulus by 0.088 mag.
The above measurements can be compared to that of the RGB tip brightness in the LMC and in the Galactic Bulge. For example, Cioni et al. (cioni+00 (2000)) have measured and ; these values are not corrected for metallicity. The difference between the RGB tip magnitudes in the LMC and NGC 5128 imply distance moduli differences of mag and mag. Adopting a distance modulus of 18.5 for the LMC (Alves et al. alves+02 (2002)) yields distance moduli for NGC 5128 of and using and bands, respectively. While this is within errors consistent with the above quoted , it should be remembered that the higher metallicity of the NGC 5128 stars with respect to the LMC, makes the RGB tip magnitude brighter in -band (e.g. Zoccali et al. zoccali+03 (2003)), hence the relative difference of distance modulus is a lower limit in the -band.
The -band RGB tip magnitude is expected to decrease slowly as the metallicity increases, while the tip luminosity in the -band appears to be fairly constant in the metallicity range (Zoccali et al. zoccali+03 (2003)). Hence the latter could be used for distance determination. Schulte-Ladbeck et al. (schulte-ladbeck+99 (1999)) have investigated the behaviour of the -band tip luminosity with age and metallicity. They recommend for . Bertelli et al. (bertelli+94 (1994)) models suggest mag for higher metallicity, while in the Galactic Bulge (Zoccali et al. zoccali+03 (2003)). The latter yields a distance modulus to NGC 5128 of . Due to high extinction, small number of stars and possible differential reddening in the Galactic Bulge field observed, the value is rather uncertain. However, it yields a distance modulus to NGC 5128 of in excellent agreement with that derived from the -band RGB tip magnitude.
4.2 Mira PL relation
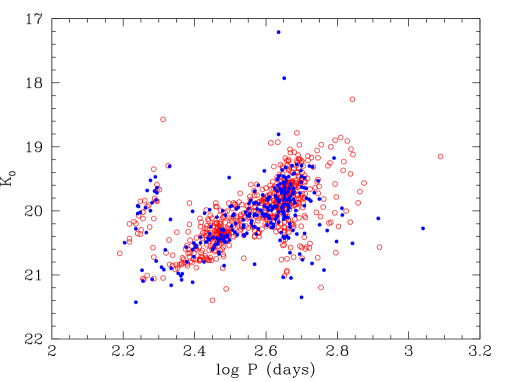
In Fig. 5 I plot the mean magnitudes logarithm of periods for all the variables with 10 or more data points for which derived periods had a significance parameter from Fourier analysis (Rejkuba et al. 2003a ). Field 1 variables are shown with filled and Field 2 with open symbols. The mean magnitudes are corrected for extinction and transformed to the SAAO photometric system (Carter carter90 (1990)) in which most Mira studies are published.
| ID | |||||||||
|---|---|---|---|---|---|---|---|---|---|
| F1 166 | 214. | 0.254 | 4.30 | 0.340 | 19.46 | 522. | 0.262 | 4.49 | 19.44 |
| F1 193 | 195. | 0.213 | 2.30 | 0.140 | 19.62 | 399. | 0.365 | 2.05 | 19.80 |
| F1 201 | 189. | 0.296 | 10.90 | 0.390 | 19.67 | 382. | 0.667 | 5.86 | 20.07 |
| F1 269 | 197. | 0.309 | 4.20 | 0.230 | 19.79 | 401. | 0.549 | 1.90 | 20.10 |
| F1 283 | 185. | 0.178 | 3.80 | 0.660 | 19.83 | 372. | 0.377 | 3.62 | 20.07 |
| F1 286 | 197. | 0.247 | 9.20 | 0.550 | 19.87 | 403. | 0.444 | 5.29 | 20.10 |
| F1 296 | 194. | 0.217 | 2.50 | 0.260 | 19.84 | 392. | 0.413 | 1.49 | 20.08 |
| F1 353 | 652. | 0.378 | 56.00 | 0.630 | 20.26 | 652. | 0.861 | 16.00 | 20.35 |
| F1 375 | 196. | 0.272 | 4.70 | 0.300 | 19.98 | 400. | 0.498 | 2.46 | 20.26 |
| F1 393 | 191. | 0.220 | 6.70 | 0.540 | 20.02 | 387. | 0.466 | 6.61 | 20.29 |
| F1 425 | 174. | 0.242 | 4.00 | 0.220 | 20.07 | 344. | 0.416 | 2.65 | 20.29 |
| F1 431 | 183. | 0.226 | 3.70 | 0.440 | 20.10 | 367. | 0.485 | 2.24 | 20.39 |
| F1 441 | 175. | 0.243 | 3.40 | 0.250 | 20.08 | 346. | 0.360 | 1.77 | 20.25 |
| F1 522 | 174. | 0.237 | 3.00 | 0.260 | 20.19 | 348. | 0.514 | 2.76 | 20.50 |
| F1 527 | 189. | 0.180 | 3.20 | 0.650 | 20.15 | 387. | 0.357 | 1.62 | 19.95 |
| F1 536 | 177. | 0.287 | 4.30 | 0.280 | 20.17 | 352. | 0.528 | 1.96 | 20.46 |
| F1 793 | 455. | 0.077 | 50.30 | 0.090 | 20.56 | 450. | 0.588 | 6.60 | 20.52 |
| F1 816 | 172. | 0.220 | 5.60 | 0.650 | 20.44 | 340. | 0.460 | 4.39 | 20.71 |
| F1 908 | 445. | 0.299 | 5.60 | 0.270 | 20.55 | 304. | 0.314 | 5.41 | 20.57 |
| F1 1001 | 184. | 0.248 | 2.60 | 0.310 | 20.50 | 370. | 0.422 | 1.83 | 20.27 |
| F1 1089 | 160. | 0.238 | 3.60 | 0.320 | 20.65 | 291. | 0.253 | 3.68 | 20.58 |
| F1 1888 | 445. | 0.154 | 16.70 | 0.170 | 21.22 | 202. | 0.325 | 12.00 | 21.30 |
| F2 111 | 486. | 0.367 | 3.20 | 0.140 | 18.94 | 545. | 0.367 | 3.24 | 18.94 |
| F2 258 | 193. | 0.257 | 4.20 | 0.450 | 19.50 | 413. | 0.330 | 2.17 | 19.58 |
| F2 274 | 212. | 0.281 | 4.60 | 0.090 | 19.45 | 515. | 0.304 | 3.92 | 19.42 |
| F2 551 | 730. | 0.862 | 6.70 | 0.030 | 19.87 | 240. | 0.450 | 6.97 | 19.89 |
| F2 594 | 197. | 0.248 | 3.80 | 0.080 | 19.74 | 402. | 0.440 | 1.97 | 19.98 |
| F2 663 | 198. | 0.220 | 1.80 | 0.040 | 19.80 | 400. | 0.390 | 1.87 | 20.02 |
| F2 700 | 200. | 0.224 | 2.80 | 0.130 | 19.82 | 419. | 0.325 | 2.10 | 19.97 |
| F2 767 | 722. | 0.483 | 5.10 | 0.270 | 20.03 | 363. | 0.432 | 8.39 | 19.96 |
| F2 777 | 194. | 0.312 | 8.30 | 0.240 | 19.96 | 399. | 0.546 | 2.32 | 20.23 |
| F2 817 | 177. | 0.279 | 5.50 | 0.210 | 20.00 | 352. | 0.575 | 2.89 | 20.32 |
| F2 935 | 197. | 0.241 | 4.80 | 0.220 | 20.00 | 401. | 0.451 | 1.69 | 20.25 |
| F2 1044 | 182. | 0.242 | 6.40 | 0.360 | 19.99 | 369. | 0.458 | 5.61 | 20.26 |
| F2 1096 | 185. | 0.241 | 4.50 | 0.190 | 20.08 | 371. | 0.538 | 4.21 | 20.42 |
| F2 1216 | 187. | 0.306 | 2.30 | 0.040 | 20.06 | 380. | 0.506 | 1.28 | 20.34 |
| F2 1364 | 180. | 0.266 | 9.10 | 0.620 | 20.17 | 364. | 0.359 | 7.93 | 20.31 |
| F2 1378 | 180. | 0.235 | 2.60 | 0.110 | 20.17 | 362. | 0.318 | 3.04 | 20.32 |
| F2 1465 | 175. | 0.303 | 6.60 | 0.180 | 20.23 | 343. | 0.334 | 6.01 | 20.30 |
| F2 1588 | 476. | 0.129 | 58.10 | 0.080 | 20.41 | 476. | 0.541 | 5.34 | 20.46 |
| F2 1600 | 180. | 0.421 | 7.00 | 0.220 | 20.28 | 367. | 0.510 | 4.40 | 20.10 |
| F2 1623 | 449. | 0.305 | 13.10 | 0.460 | 20.42 | 377. | 0.404 | 11.61 | 20.30 |
| F2 1700 | 460. | 0.142 | 34.50 | 0.080 | 20.43 | 455. | 0.471 | 7.32 | 20.39 |
| F2 1871 | 165. | 0.279 | 4.00 | 0.260 | 20.36 | 328. | 0.398 | 4.14 | 20.18 |
| F2 1917 | 461. | 0.192 | 49.80 | 0.250 | 20.49 | 451. | 0.436 | 6.39 | 20.44 |
| F2 2042 | 172. | 0.290 | 3.50 | 0.110 | 20.36 | 340. | 0.434 | 1.39 | 20.17 |
| F2 2097 | 178. | 0.495 | 10.20 | 0.260 | 20.45 | 359. | 0.587 | 7.38 | 20.26 |
| F2 2100 | 450. | 0.097 | 36.00 | 0.300 | 20.47 | 433. | 0.486 | 5.46 | 20.34 |
| F2 2287 | 174. | 0.299 | 4.30 | 0.170 | 20.51 | 345. | 0.466 | 3.73 | 20.27 |
| F2 2467 | 177. | 0.403 | 6.40 | 0.230 | 20.52 | 351. | 0.455 | 6.57 | 20.42 |
| F2 2554 | 605. | 0.281 | 24.70 | 0.670 | 20.52 | 605. | 0.560 | 9.27 | 20.53 |
| F2 3622 | 155. | 0.312 | 3.80 | 0.160 | 20.81 | 267. | 0.328 | 4.56 | 20.86 |
All the variables with magnitudes brighter than have been carefully checked on the reference (best seeing) image. The two Field 1 LPVs with periods around 430 days, both of which are brighter than are located in a highly crowded areas. The fainter of the two is actually blended with a background galaxy and the brighter might be a blend of more than two stars. Also the third brightest Field 1 LPV could be too bright due to contributing light from the nearby stars. LPVs which are blended with nearby stars should have smaller amplitudes due to larger relative contribution of the neighbour at minimum phases. Only one of the eight Field 2 bright LPVs () is a possible blend of two stars.
There are two sequences in the PL diagram in Fig. 5. Multiple parallel sequences in the PL diagram of LPVs were reported by Wood & Sebo (wood&sebo96 (1996)), Wood (wood00 (2000)) and Cioni et al. (cioni+01 (2001)) in the Magellanic Cloud. The more populated, longer period sequence corresponds to sequence C of Wood (wood00 (2000)) where Mira variables are found. The shorter period sequence B discussed by Wood (wood00 (2000)) is approximately 1.3 mag brighter, while the shorter sequence in Fig. 5 lies only 0.5-1 mag brighter. Moreover, it is is somewhat steeper, indicating a possible problem of aliasing periods.
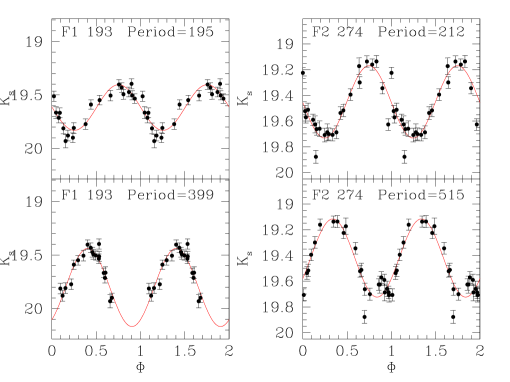
Actually, a close inspection, shows that most of the stars on the shorter period sequence have periods close to year and can be fitted similarly well with periods that are twice as long, and which place them on the Mira sequence. It is interesting to note that this increases also the amplitude of the fit. An example is shown in Fig. 6. In the upper panel the light curve is folded with the original, shorter, period and with the longer period on the bottom. Carefully phased additional observations of these variables would be necessary to determine their periods unambiguously. The period distribution of the LPVs and the comparison between the two fields is discussed by Rejkuba et al. (2003b ).
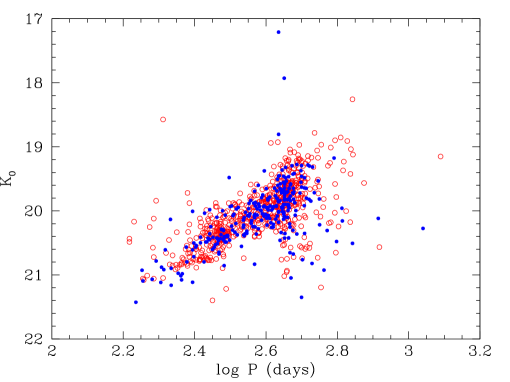
In Table 2 all the variables that could be fitted with 2 aliasing periods are listed. Columns 1 to 6 list: field identification and ID number, original period, semi-amplitude, reduced of the sine-curve fit, significance of the original period and the mean magnitude obtained from the sine-curve fit. The new period, semi-amplitude, reduced of the sine-curve fit with this new period and the associated average magnitude, are listed in columns 7, 8, 9 and 10, respectively. Additionally I have checked for possible aliasing periods all the LPVs that are located below the Mira PL relation. In most cases no shorter period could provide a satisfactory fit to the data, except for 2 LPVs in Field 1 and 5 in Field 2. Fainter average -band magnitudes for the LPVs that lie below the Mira PL relation are due to extinction within their circumstellar shells (see also Kiss & Bedding kiss+bedding03 (2003)). In another 6 cases of the sine-curve fit was improved and a new amplitude and mean magnitude were calculated, although the period remained very close to the original value. Apparently running the sine-curve fitting algorithm in an automatic way failed to find the best fitting amplitudes in a few cases. These are also listed in Table 2. In the following distance determination these LPVs are not used. Fig. 7 displays the PL diagram in which aliasing periods () from Table 2 are used.
A well-defined PL relation has been found for Miras in the Large Magellanic Cloud (Glass & Lloyd Evans glass&lloydevans81 (1981), Wood wood+99 (1999)), the Small Magellanic Cloud (Cioni et al. cioni+03 (2003)), the Galactic Bulge (Glass et al. glass+95 (1995)), the solar neighbourhood (van Leeuwen et al. vanleeuwen+97 (1997)) and in Galactic globular clusters (Feast et al. feast+02 (2002)). The relation holds for both and . Since Miras are very luminous, their tight PL relation makes them interesting for distance determination to other galaxies.
Calibration of the -band PL relation relies on the LMC PL relation for Miras. The Feast et al. (feast+89 (1989)) fit to the LMC Mira PL relation is:
| (5) |
The zero point of has been derived by Feast (feast96 (1996)) using LMC Miras. More recently Whitelock et al. (whitelock+00 (2000)) used Hipparcos parallaxes for Solar neighbourhood Miras to derive and Feast et al. (feast+02 (2002)) obtained for globular cluster Miras using the cluster distances determined from subdwarf fitting with Hipparcos parallaxes of subdwarfs (Caretta et al. caretta+00 (2000)). The straight mean of the two Hipparcos based zero points yields and a Large Magellanic Cloud distance modulus of . Preferring instead a somewhat shorter LMC distance, (Alves et al. alves+02 (2002)), I use a zero point of (where uncertainty in the LMC distance modulus has been added to the zero point error in quadrature).
Glass & Lloyd Evans (glass+lloydevans03 (2003)) have re-reanalysed the Mira PL relation using the MACHO data for the same stars as Feast et al. (feast+89 (1989)) in the LMC. They conclude that the periods of these variables did not change significantly and remained essentially constant over 2–3 decades. Their best fit to the -band Mira PL relation is:
| (6) |
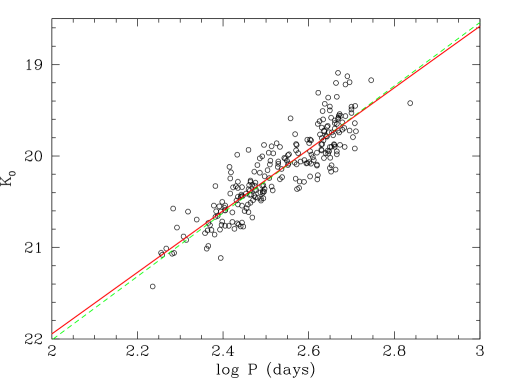
In order to determine the distance to NGC 5128 only Miras with colors have been selected. This ensures that reddening from circumstellar shells that may be present in redder LPVs would not dim the -band magnitudes and also matches the colors of Mira variables used to derive the Mira PL relation in the LMC (, Feast et al. feast+89 (1989)). Moreover, only those LPVs that had the most regular periods, and could be fitted with a sine-curve with were chosen. They are plotted in Fig. 8 together with the best linear least-square fit to the data (thick solid line):
| (7) |
The fits to Field 1 and Field 2 LPVs are identical within the errors. Largely, the error in the constant term is due to the extrapolation of the relation to the period of 1 day. The mean is . If instead the fit is made at the mean period with the following functional form:
| (8) |
the error of the constant term drops to only .
The slope of the PL relation in NGC 5128 agrees well with that in the LMC. It is within of the slope of the Feast et al. (feast+89 (1989)) relation and of the Glass & Lloyd Evans (glass+lloydevans03 (2003)) PL relation. This is yet another piece of evidence that the slope of the PL relation in the -band is universal, lending confidence to the distance determination through the PL relation.
In order to determine the distance modulus of NGC 5128 from the Mira PL relation, one has to assume that the slope is universal and use the same value as in the calibrating PL relation (i.e. that in the LMC). It is straightforward then to calculate the distance modulus from the zero point difference of the two PL relations. Restricting the slope to , and determining the zero-point of the relation at , approximately the mean period of the LMC stars used to determine the relation (Feast et al. feast+89 (1989), Glass & Lloyd Evans glass+lloydevans03 (2003)) the best fitting zero point is (dotted green line in Fig. 8) with the same RMS of the fit. Using the above discussed zero point of , I derive a distance modulus to NGC 5128 of . If instead the slope of the PL relation is fixed to (Glass & Lloyd Evans glass+lloydevans03 (2003)), the resulting distance modulus to NGC 5128 is .
Feast et al. (feast+89 (1989)) as well as Glass & Lloyd Evans (glass+lloydevans03 (2003)) noted the group of stars with periods in excess of days which lie some mag above the PL relation. Due to the fact that a few of them have been found to be Li-rich, it was suggested that they are more massive, hence younger and are in the Hot-Bottom Burning phase (Smith et al. smith+95 (1995)). So, restricting the LPV data in NGC 5128 to LPVs with periods shorter than 400 days, where the above mentioned LMC PL relations have been calibrated, distance moduli of and are derived adopting slopes of and , respectively. These distance moduli are virtually indistinguishable from that determined from the full data set and they point out that most of the long period stars do follow the same Mira PL relation as shorter period Miras. They are not overluminous and in the hot-bottom burning phase.
There are a few dozen stars in Fig. 5 that are above the PL relation. Some of them might be brighter due to contributing light from their neighbours, but some show indications of humps in their light-curves. Similar humps have been found in MACHO light curves of the LMC Li-rich stars by Glass & Lloyd Evans (glass+lloydevans03 (2003)). However, before being able to place firm conclusions, accurate light curves over several periods should be determined for a larger statistical sample of Li-rich hot-bottom burning AGB stars.
5 Conclusions
The tip of the RGB was detected in Field 1 at , yielding a distance modulus of NGC 5128 of . The comparison of the -band RGB tip luminosity in the Galactic Bulge and NGC 5128 implies a similar distance modulus (Table 3). The RGB tip in Field 2 is not a sharp feature due to a brighter completeness limit, larger photometric errors and the presence of blends and AGB stars.
A large population of stars above the tip of the RGB contains 2176 stars in the outer halo field (Field 1) and 6072 stars in the inner halo field (Field 2). Subtracting these foreground sources, detected LPVs, as well as maximum probable number of blends of two RGB tip stars, there are some 1150 and 150 non-variable stars brighter than the first ascent giant branch tip in the two fields. LPVs account for 26% and 70% of the AGB population in Fields 1 and 2, respectively. The high luminosity () achieved by AGB stars is a sign of an intermediate-age population.
| DM (mag) | Method | Field |
|---|---|---|
| -band RGB tip | F1 | |
| -band RGB tip | F1 | |
| -band Mira PL relation | F1 & F2 |
The first Mira period-luminosity relation outside the Local Group is presented. Miras with the best determined and most regular periods that do not have red colors () were used to determine the distance of NGC 5128 from a period-luminosity relation. I derive the distance modulus of , adopting the LMC distance modulus of 18.50 (Alves et al. alves+02 (2002)).
The mean distance of the Miras, obtained from fields on both sides of the center of NGC 5128, is slightly larger than the mean distance of the red giants in Field 1. This indicates that the orientation of NGC 5128 is such that the north-eastern part of the galaxy is closer to us. However, the relative distance of the two fields is smaller than Mpc and negligible compared to the distance from the Milky Way. The mean of the two methods yields a distance to NGC 5128 of ( Mpc), very close to the measurement of Harris et al. (harris+99 (1999)) and within of the distance modulus result of Soria et al. (soria+96 (1996)).
Acknowledgements.
I would like to thank M.-R. Cioni for useful discussions, M. Feast for suggestions regarding the Mira PL relation and to Chris Lidman for communicating the transformation equations between different near-IR photometric systems. Thanks also go to Tim Bedding for carefully reading the manuscript and for making a number of useful comments. Comments from H. Ford and the second anonymous referee improved the clarity of the presentation. I am indebted to many ESO staff astronomers who took the data presented in this paper in service mode operations at Paranal Observatory.References
- (1) Alves, D.R., Rejkuba, M., Minniti, D. & Cook, K.H., 2002, ApJ, 573, L51
- (2) Bertelli, G., Bressan, A., Chiosi, C., Fagotto, F. & Nasi, E., 1994, A&AS, 106, 275
- (3) Bessell, M.S. & Brett, 1988, PASP, 100, 1134
- (4) Carter, B.S., 1990, MNRAS, 242, 1
- (5) Cardelli, J.A., Clayton, G.C. & Mathis, J.S., 1989, ApJ, 345, 245
- (6) Caretta, E., Gratton, R.G., Clementini, G. & Fusi Pecci, F, 2000, ApJ, 533, 215
- (7) Cioni, M.-R.L., van der Marel, R.P., Loup, C. & Habing, H.J., 2000, A&A, 359, 601
- (8) Cioni, M.-R.L., Marquette, J.-B., Loup, C., et al., 2001, A&A, 377, 945
- (9) Cioni, M. -R. L., et al., 2003, A&A, 406, 51
- (10) Dufour, R.J., van den Bergh, S., Harvel, C.A., et al., 1979, AJ, 84, 284
- (11) Feast, M.W., 1996, MNRAS, 278, 11
- (12) Feast, M.W, Glass, I.S., Whitelock, P.A. & Catchpole, R.M., 1989, MNRAS, 241, 375
- (13) Feast, M., Whitelock, P. & Menzies, J., 2002, MNRAS, 329, L7
- (14) Ferraro, F.R., Montegriffo, P., Origlia, L. & Fusi Pecci, F., 2000, AJ, 119, 1282
- (15) Glass, I.S. & Lloyd Evans, T., 1981, Nature, 291, 303
- (16) Glass, I.S. & Lloyd Evans, T., 2003, MNRAS, in press
- (17) Glass, I. S., Whitelock, P. A., Catchpole, R. M., & Feast, M. W. 1995, MNRAS, 273, 383
- (18) Harris, H.C., Harris, G.L.H. & Hesser, J.E., 1988, IAUS, 126, 205
- (19) Harris, G.L.H. & Harris, W.E., 2000, AJ 120, 2423
- (20) Harris, G.L.H., Harris, W.E. & Poole, G.B., 1999, AJ, 117, 855
- (21) Harris, W.E., 1999, in Star Clusters, ed. L. Labhardt & B. Binggeli (28th Saas-Fee Advanced Course), Berlin: Springer
- (22) Hui, X., Holland, C.F., Freeman, K.C. & Dopita, M.A., 1995, ApJ, 449, 592
- (23) Israel, F.P., 1998, A&AR 8, 237
- (24) Kiss, L.L. & Bedding, T., 2003, MNRAS, in press, astro-ph/0306426
- (25) Lee, M.G., Freedman, W.L. & Madore, B.F., 1993, ApJ, 417, 553
- (26) Marleau, F.R., Graham, J.R., Liu, M.C. & Charlot, S., 2000, AJ, 120, 1779
- (27) Mathieu, A., Dejonghe, H. & Hui, X., 1996, A&A, 903, 30
- (28) Peng, E., 2003, PhD thesis, John Hopkins University
- (29) Persson, S.E., Murphy, D.C., Krzeminski, W., Roth, M. & Rieke, M.J., 1998, AJ, 116, 2475
- (30) Rejkuba, M., 2001, A&A, 369, 812
- (31) Rejkuba, M., 2002, PhD thesis, P. Universidad Católica de Chile
- (32) Rejkuba, M., Minniti, D., Bedding, T. & Silva, D.R., 2001, A&A, 379, 781
- (33) Rejkuba, M., Minniti, D. & Silva, D.R., 2003a, A&A, 406, 75
- (34) Rejkuba, M., Minniti, D., Silva, D.R. & Bedding, T., 2003b, A&A, in press
- (35) Renzini, A., 1998, AJ, 115, 2459
- (36) Sandage, A. &Tammann, G.A., 1974, ApJ, 194, 559
- (37) Sersic, J.L., 1958, Obs, 78, 24
- (38) Schlegel, D.J., Finkbeiner, D.P. & Davis, M., 1998, ApJ, 500, 525
- (39) Schulte-Ladbeck, R.E., Hopp, U., Greggio, L. & Crone, M.M., 1999, AJ, 118, 2705
- (40) Smith, V.V., Plez, B., Lambert, D.L. & Lubowich, D.A., 1995, ApJ, 441, 735
- (41) Soria, R., Mould, J.R., Watson, A.M., et al., 1996, ApJ 465, 79
- (42) Tonry, J.L., 1991, ApJ, 373, L1
- (43) Tonry, J.L. & Schechter, P.L., 1990, AJ, 100, 1794
- (44) Tonry, J.L., Blakeslee, J.P., Ajhar, E.A. & Dressler, A., 1997, ApJ, 475, 399
- (45) Tonry, J.L., Dressler, A., Blakeslee, J.P., et al., 2001, ApJ, 546, 681
- (46) van den Bergh, S., 1995, ApJ, 446, 39
- (47) van Leeuwen, F., Feast, M. W., Whitelock, P. A., & Yudin, B., 1997, MNRAS, 287, 955
- (48) Whitelock, P., Marang, F. & Feast, M., 2000, MNRAS, 319, 728
- (49) Wood, P. R. et al. 1999, IAU Symp. 191: Asymptotic Giant Branch Stars, 191, 151
- (50) Wood, P.R., 2000, PASA, 17, 18
- (51) Wood, P.R. & Sebo, K.M., 1996, MNRAS, 282, 958
- (52) Zoccali, M., Renzini, A., Ortolani, S., et al., 2003, A&A, 399, 931