From Large to Small Scales: Global Models of the ISM
Abstract
We review large scale modelling of the ISM with emphasis on the importance to include the disk-halo-disk duty cycle and to use a dynamical refinement of the grid (in regions where steep variations of density and pressure occur) for a realistic modelling of the ISM. We also discuss the necessity of convergence of the simulation results by comparing 0.625, 1.25 and 2.5 pc resolution simulations and show that a minimum grid resolution of 1.25 pc is required for quantitatively reliable results, as there is a rapid convergence for pc.
keywords:
Hydrodynamics, ISM: general, ISM: structure, ISM: kinematics and dynamics, galaxies: halos, Galaxy: disk1 Introduction
The interstellar gas exhibits time-dependent structures on all scales and is heavily non-linear and subject to numerous instabilities in certain parameter regimes, which may lead to chaotic behaviour, while in others the evolution is fairly predictable. The key to a realistic description is the highest possible spatial resolution and a realistic input of the basic physical processes with appropriate boundary conditions. The former is required due to the formation of small scale structures resulting from instabilities in the flows, in particular from thermal instabilities and condensations as a result of radiative cooling. The amount of cooling may be substantially increased if the resolution is high enough to trace regions of high compression by shocks, rather than smearing them out over a larger volume thus decreasing the average density. Such a realistic description requires therefore the appropriate tools, which are computer clusters with parallelized HD and MHD codes and a sophisticated method of tracking non-linear structures, such as shock waves on the smallest possible scales in conjunction with adaptive mesh refinement. Thus the global evolution of the ISM resulting from mass, momentum and energy input due to supernovae can be adequately described.
The structure of the paper is as follows. Section 2 deals with the importance of the disk-halo-disk cycle for global modelling of the ISM. In Section 3 the signature of the initial evolution in the temperature and density PDFs is discussed, as well as the resolution effects in the time histories of the volume filling factors and the maximum density and minimum temperature in the ISM. Moreover the necessity for convergence of the simulations is addressed. In section 4 a summary and final remarks are given.
2 Duty Cycle and Grid Sizes
2.1 The Duty Cycle
The evolution of the ISM in disk galaxies is intimately related to the vertical structure of the thick gas disk and to the input of energy by supernovae per unit area in the Galactic disk. The system can evolve towards some sort of dynamical equilibrium state on the global scale if the boundary conditions vary only in a secular fashion. Such an equilibrium is determined by the input of energy into the ISM by SNe, diffuse heating, the energy lost by radiative cooling and magnetic energy, and is only possible after the full establishment of the duty cycle of the warm and hot gas and its circulation between the disk and the halo, which takes several hundred Myr. An upper limit for this can be estimated by calculating the flow time, , that the gas needs to travel to the critical point of the flow in a steady-state (see Kahn 1981). This is the characteristic distance from which information in a thermally driven flow can be communicated back to the sources. Then , where and are the location of the critical point and the speed of sound, respectively. For spherical geometry, the critical point can be simply obtained from Bernoulli’s or the steady state fluid equations, , which yields for a Milky Way mass of a distance kpc, and thus years as an upper limit for the ascending flow time. This value is of the same order as the radiative cooling time, ensuring that the flow will not only cool by adiabatic expansion, but also radiatively, thus giving rise to the fountain return flow, which is the part of the outflow that loses pressure support from below and therefore cannot escape from the galaxy. Note, that is the maximum extension of the fountain.
In the disk, on the other hand, the heating and cooling time scales are much shorter than in the halo, since they scale typically with the gas density there, i.e. and , respectively. Avillez & Breitschwerdt (2003) show from large-scale simulations of the ISM that typical time scales of pressure fluctuations about a mean value of are about Myr, which is by the way a typical time scale for superbubble evolution.
It should be emphasized, since disk and halo are coupled dynamically, not only by the escape of hot gas, but also by the fountain return flow striking the disk, that the disk equilibrium will also suffer secular variations on time scales of the order of 100 Myr.
2.2 Vertical Extension of Computational Domain
The need of a duty cycle and the establishment of a global dynamical equilibrium requires the use of an extended grid in the direction perpendicular to the Galactic plane. The lack of such an extended -grid inhibits the disk-halo-disk circulation of matter, which otherwise would return gas to the disk sometime later, with noticeable effects for the dynamical evolution there. In runs in which the vertical extension is small, e.g. 1 kpc above and below the midplane111Note, that the maximum extension of the fountain is more than an order of magnitude larger, and therefore such restricted calculations definitely miss an important component of the galactic gas dynamics., compared to the maximum height to which the hot plasma rises due to the injection of energy and momentum from the sources, most of the gas escapes from the disk in less than 100 Myr (without ever returning to it), unless the loss of matter is compensated by some injection of mass into the grid through the top and bottom boundaries. This can be accomplished by the use of (1) periodic boundary conditions (the gas leaving the top/bottom boundary enters in the bottom/top boundary), (2) reflection boundary conditions where the gas hitting the top/bottom boundary reflects in it returning back, or by (3) calculating the amount of mass leaving the grid on each boundary and inject that mass in the form of clouds into the top/bottom boundaries. These schemes assume that the amount of gas that leaves the grid is the same that enters it, neglecting that some of this matter may actually escape from the Galaxy altogether as a wind222In the case in which the appropriate grid is used there is still gas leaving the upper and bottom boundaries amounting to some 10% of the total mass with which the simulations started (Rosen & Bregman 1995, Avillez 2000). Thus, a smaller grid with open boundaries on the top and bottom of the grid will imply the loss of a large amount of matter within a short time thereby evacuating the gas disk. or return to the disk at a different locations due to colliding gas streams. The wind effect may be included in scheme (3) by assuming that the gas injected into the grid is only a fraction of the escaping gas mass.
In any case these schemes neglect the effects of the duty cycle in the dynamics of the disk gas as there is no recycling of gas, and as a consequence the simulations can only run for a small evolution time thus reflecting the initial evolution of the system. Therefore, the volume weighted histograms of the thermodynamic properties (e.g., density, pressure and temperature) of the disk gas will retain a memory of the original set-up.
2.3 Grid Extension Parallel to the Midplane
The extension of the grid in the direction parallel to the Galactic plane is also an important factor. Large -grids, parallel to the midplane are required because counter pressure effects are very important in the bubbles confinement (Avillez 2000; Avillez & Breitschwerdt 2003). If the grid in the plane is too small, say less than 500 pc, then large scale horizontal flows resulting from superbubbles expanding into low density regions and eventually colliding with other hot tenuous bubbles will not be captured adequately. We therefore consider an extension of 1 kpc 1 kpc as the minimum grid extension in the plane.
3 Global Modelling of the ISM
3.1 SN-Driven ISM Model
In order to gain insight into the nonlinear physics of a complex system like the ISM, driven by temporally and spatially variable energy input we first try to understand the interplay and effects of the most dominant processes, and therefore only the most important ingredients are included in the models, neglecting other processes that may be relevant too. We therefore, do not strive for completeness, but for a better understanding of the ISM gas dynamics. The discussion that follows is based on the results from three-dimensional kpc-scale modelling of the ISM with a grid centred on the solar circle and extending from to 10 kpc with a disk area of 1 kpc2. These simulations use adaptive mesh refinement with resolutions of 2.5, 1.25 and 0.625 pc and were obtained with a modified version of the 3D SN-driven ISM model of Avillez (2000).
The basic processes included in the model are the gravitational field provided by the stars in the disk, radiative cooling (assuming an optically thin gas in collisional ionization equilibrium) with a temperature cut off of 10 K, and uniform heating due to starlight varying with . In the Galactic plane background heating is chosen to initially balance radiative cooling at 9000 K. With the inclusion of background heating the gas at K becomes thermally bistable. The interstellar gas is initially set up with a density stratification distribution that includes the cool, warm, ionized and hot gases according to observations. The prime sources of mass, momentum and energy are supernovae types Ia, Ib+c and II with scale heights, distribution and rates according to observations. OB associations can be setup in regions with density and temperature thresholds of 10 cm-3 and 100 K, respectively, and an initial mass function is applied to determine the number of OB stars and their masses, forming an OB association. The time interval between the explosions of all OB stars is determined by their main sequence life time, and the kinematics of both the association and of the low mass stars in the association can be followed in detail.
3.2 General Evolution
Our simulations reproduce many of the features that have been observed in the Milky Way and other star forming galaxies, namely: (i) A thick frothy gas disk composed of a warm, neutral medium overlying a thin HI disk, with a variable thickness up to pc; (ii) bubbles and superbubbles and their shells distributed on either side of the midplane; (iii) tunnel-like structures (chimneys) crossing the thick gas disk and connecting superbubbles to the upper parts of the thick gas disk; (iv) thick gas disk with a distribution compatible with the presence of two phases having different scale heights: a neutral layer with pc (warm HI disk) and an ionized component extending to a height kpc above the thin HI disk; (v) cold gas mainly concentrated into filamentary structures running perpendicular to the midplane. These clouds form and dissipate within some 10-12 Myr. Compression is the dominant process for their formation, but thermal instability also plays a rôle; (vi) for supernova rates , is the Galactic value, the hot gas has a moderately low volume filling factor in agreement with observations () even in the absence of magnetic fields and is mainly distributed in an interconnected tunnel network and in some case it is confined to isolated bubbles (see Figure 2).
3.3 Effects of the Initial Evolution
A major consequence of the set-up of the duty cycle is that the system loses any memory of its initial conditions and evolution as most of the disk gas has already travelled into the halo and back to the disk. Thus, as should be in representative global simulations, memory effects are not present in the volume weighted histograms (PDFs) of the different thermodynamic properties as well as in the history of the volume filling factors of the different ISM phases. Figure 1 compares PDFs of the temperature over the periods of 0-50 Myr (red) and 350-400 Myr (black) for two AMR simulations of the ISM using supernova rates (left panel) and 4 (right panel). The finest AMR level resolution is 1.25 pc.
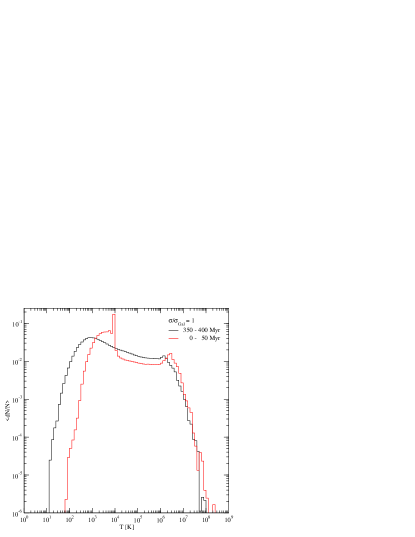
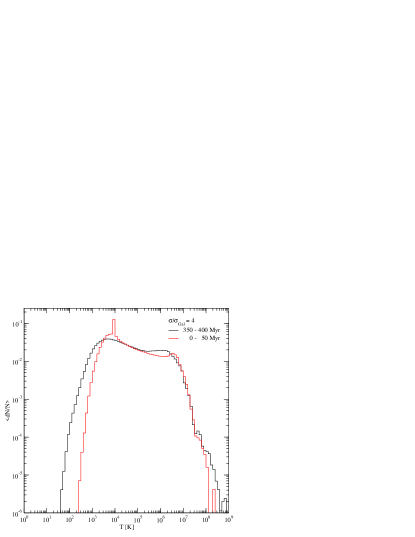
These PDFs indicate that for low , the temperature peak is at about 2000 K, making the cold/warm HI gas the most abundant gas phase, consistent with observations. The relative importance of the hot phase increases with SN rate, and one is moving towards a bimodal distribution. It should be emphasized that a simulation time of only 50 Myrs is not sufficient to establish this result, mainly because the effect of upwards transport has as a duty cycle of the order of a few hundred Myrs. In any of the cases shown in the figures the averaged PDFs for the initial 50 Myr have two pronounced peaks, one around 8000 K and the other around K. Note that with the increase of SN rate the PDFs of the first 50 Myrs suffer large variations, indicating that the loss of recollection of the initial conditions will occur earlier for the highest SN rates.
The inclusion of snapshots taken during the first tens of Myrs in the calculation of PDFs, and consequently also for the volume filling factors, has a considerable effect in the overestimation of the coolest gas in the beginning of the simulations when cooling and gravity are the main physical dominant processes as the system is only building up the pressure support against gravity. Thus, during the first Myrs much of the gas collapses into the plane due to gravity, and simultaneously cools towards low temperatures. As soon as the pressure has built up, there is a redistribution of matter in the grid filling it. Therefore, the PDFs of the disk gas including the first say 40-50 Myr snapshots will show the presence of a large fraction of cold gas, while the PDFs constructed at later times, say up to 90 Myr or so, will show the dominance of the hot gas. A combination of these PDFs gives a pronounced bimodal distribution in the averaged PDFs corresponding to large volume filling factors for the hot and coolest ISM phases. Moreover, the averaged PDFs of the temperature will show a bimodal structure even if there is no background heating due to starlight. However, it should be emphasized that global ISM models, which may be considered representative for star forming galaxies, should be free of initial set-up features.
3.4 Resolution and Convergence
Left panel: mavillezfig2a, Right panel: mavillezfig2b
The simulations show how crucial spatial resolution is in order to capture small scale structures and, in particular, the cold gas as can be seen by the comparison between the left and right panels of Figure 2. Both panels show a snapshot of the density distribution in the Galactic plane for , at different evolution times, for runs with AMR resolutions of 2.5 pc (left panel) and 0.625 pc (right panel). High density gas is shown in blue, while low density gas (high temperatures) is shown in red. For contrast purposes, the maximum density cutoff is set at cm-3, although in the 0.625 pc resolution image there are regions where the density is as large as 800 cm-3. The panels show a clear difference between the morphology of the ISM in the two resolutions. In the 0.625 pc resolution image the filamentary structures are well defined and thinner than in the left panel. It can be clearly seen how cooling promotes the formation of small scale structures.
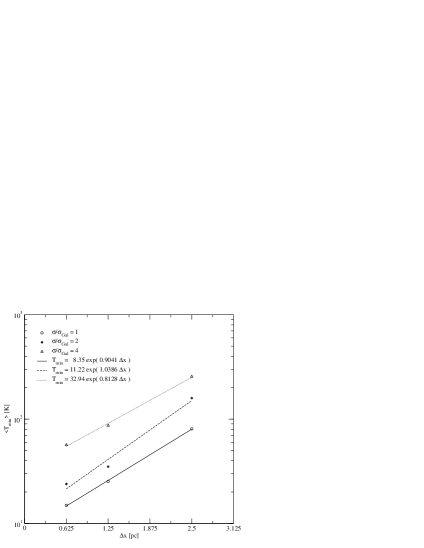
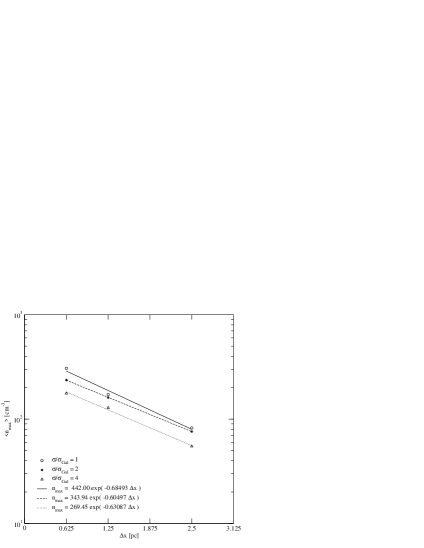
A comparison between the maximum density and minimum temperature measured at the finer level resolutions of 0.625, 1.25 and 2.5 pc reveals that an increase in resolution by a factor of two from to 1.25 pc implies an increase in the maximum density and a decrease in minimum temperature of the gas by factors greater than 4. With an increase in resolution from 1.25 to 0.625 pc the decrease in and increase in is smaller than a factor 2 as can be seen in Figure 3. The figure compares the average values of and calculated between 200 and 400 Myr of evolution for the three resolutions. The values measured for are shown by open circles, for by stars, and for by triangles. The straight lines show the exponential fits associated to the variation of (decrease with resolution) and (increase with resolution).
Resolution also affects the occupation fraction of the gas that is observed in the different ISM phases, most importantly for the cold and hot phases. Figure 4 compares the volume filling factors of the different phases for the AMR resolution level of 0.625 pc (black), 1.25 pc (red) and 2.5 pc (green) for and 4. In general the increase of resolution from 2.5 to 1.25 pc affects three of the ISM phases, and most importantly affects the amount of cold gas (which increases from when 2.5 pc resolution is used to some for 1.25 pc or 0.625 pc resolutions, respectively) for after several crossing times. The relative variation of the cold gas is still very high for , whereas for the hot phase there is a reduction of only a few percent of the occupation fraction with resolution, since here compression and cooling are less effective.
The variations in the volume filling factors are easily understood if one takes into account that with an increase of resolution it becomes possible to resolve the smallest scale structures. The rate of cooling may be substantially increased if the resolution is high enough to allow for the development of turbulent shear layers in addition to more contact surfaces. The latter is most important, because it allows for a faster mixing between parcels of gas with different temperatures (conduction or diffusion processes being of second order and hence inherently slow in nature). The mixing here is promoted by numerical diffusion rather than molecular diffusion, and therefore, the time scale for mixing to occur is somewhat smaller (because it happens on larger scales) than those predicted by molecular diffusion theory (e.g., Avillez & Mac Low 2002). However, turbulent diffusion will be most efficient.
Left panel: mavillezfig4a, Right panel: mavillezfig4b
The fact that there is only a small difference between the volume filling factors for the 1.25 and 0.625 pc resolutions in addition to the small variation of and is a clear indication for the convergence of the results, reproducing the physical processes involved in the dynamics and evolution of the ISM. Thus, the simulations with a resolution of 1.25 pc (or higher) can represent the real ISM. From Fig. 3 and the fit for and , e.g. , we can see that there is rapid convergence for pc.
4 Summary and Final Remarks
In this paper we discus the effects of the inclusion of the duty cycle in global models of the ISM and show that sufficient resolution is crucial in order to obtain quantitatively reliable results that can be compared to observations, and that a minimum grid resolution of 1.25 pc is needed. This is unambiguously demonstrated by the rapid convergence towards the 0.625 pc resolution simulations. The occupation fraction of the different ISM phases depends also sensitively on the presence of a duty cycle established between the disk and halo acting as a pressure release valve for the hot phase.
The calculations presented in this paper do neither include the magnetic field nor the cosmic rays. A parameter study of their effects on the ISM is underway and will be described in forthcoming papers. If the magnetic field is present and is initially mainly orientated parallel to the disk, transport into the halo may be inhibited, although not prevented. As a consequence the hot gas in the disk should have a slightly higher volume filling factor than in the present simulations, since this is the ISM component that tries to escape first from the disk. However, on larger scales magnetic tension forces become weaker than on the smallest scales and therefore vertical expansion might still take place efficiently and therefore the occupation fraction of the hot gas could still be comparable to the values observed in the present simulations.
References
- [1] Avillez M.A. 2000, MNRAS, 315, 479
- [2] Avillez M.A., & Mac Low, M.-M. 2002, ApJ, 581, 1047
- [3] Avillez, M.A., Breitschwerdt, D. 2003, A&A (in preparation)
- [4] Kahn, F.D. 1981, in Investigating the Universe, ed. F.D. Kahn, Reidel Dordrecht, p. 1.
- [5] Rosen, A., & Bregman, J.N. 1995 ApJ, 440, 634