Very compact radio emission from high-mass protostars
We report 5–43 GHz radio observations of the CRL 2136 region at ′′ – resolution. We detect weak (mJy intensity) radio emission from the deeply embedded high-mass protostar IRS 1, which has an optically thick spectrum up to frequencies of 22 GHz, flattening at higher frequencies, which might be explained by emission from a jet. Water maser mapping shows that the strong emission observed redshifted relative to the systemic velocity is spatially coincident with the optically thick continuum emission. The H2O maser emission from this object (and others we know of) seems to have a different origin than most of these masers, which are frequently tracing bipolar high-velocity outflows. Instead, the CRL 2136 H2O emission arises in the close circumstellar environment of the protostar (within 1000 AU). We speculate that most of it is excited in the hot, dense infalling gas after the accretion shock, although this cannot explain all the H2O emission. An accretion shock nature for the continuum emission seems unlikely.
Key Words.:
ISM: molecules – Stars: circumstellar matter – Stars: formation1 Introduction
For the earliest, deeply embedded phases of high-mass star formation, the distribution and kinematics of material on AU scales is poorly known, due to the large ( 1 kpc) distances involved, and the lack of tracers at optical and near-infrared wavelengths. The first systematic description of this phase was presented in a classic paper by Willner et al. (1982), which discussed 2–13 m spectra of a sample of 19 compact infrared sources associated with molecular clouds already coined as “protostars”. Observations of these sources by Mitchell et al. (1990) indicated large column densities of CO, spread over multiple temperature and velocity components. In addition, Mitchell et al. (1991) and others discovered strong outflows with velocities up to 70 km s-1 in CO and/or H2O maser emission and up to 200 km s-1 in infrared CO absorption.
Observations with the Infrared Space Observatory (ISO) Short-Wavelength Spectrometer (SWS, see, e.g., van Dishoeck et al. 1998) have refined our view on the structure and composition of the Willner et al. sources. The ISO data suggest an evolutionary sequence starting with cold, ice-rich objects such as W33A and NGC 7538 IRS9, and going toward warm sources like GL 2591 where gas/solid molecular abundance ratios are 1. Submillimeter maps (van der Tak et al. 2000b) indicate large masses of these envelopes, and a relation between temperature and the ratio of envelope mass to stellar mass. Additional data on this evolutionary sequence comes from submillimeter spectroscopy (van der Tak et al. 2000a, 2003), although the lines are more than an order of magnitude weaker than in the Orion “Hot Core”, the prime example of its class, which is more evolved and less distant.
Despite this progress, not much is known yet about the small-scale structure and kinematics of embedded high-mass protostars. How do the observed outflows start? How do they interact with their environment on AU scales? Subarcsecond resolution observations are necessary to shed light on these and other questions, which, at (sub)mm wavelengths, will begin to be addressable with the Submillimeter Array (Moran 1998), but for the high brightness sensitivities needed will have to await the Atacama Large Millimeter Array (ALMA111http://www.eso.org/projects/alma/ or http://www.alma.nrao.edu/).
Centimeter-wavelength radio emission penetrates dust and can now be studied at these interesting resolutions with instruments such as the Very Large Array (VLA). Medium-sensitivity (few mJy level) VLA surveys of many high-mass star-forming regions were made in the last 15 years at high (sub-arcsecond) resolution (e.g., Wood & Churchwell 1989). Subsequent (sub)millimeter-wavelength molecular line observations have established that in the ultracompact HII region (UCHII) region phase young high-mass stars are still surrounded by massive, dense, and hot molecular cores (Garay & Lizano 1999).
However, also found were a number of submillimeter sources undetected at cm-wavelengths at the sensitivity levels of the mentioned surveys, which, however from their IRAS colours, derived temperatures, densities, and dimensions were virtually indistinguishable from those associated with UCHII regions (e.g., Molinari et al. 1996, 1998, 2000; Sridharan et al. 2002; Beuther et al. 2002a) . Sensitive VLA observations led to the detection of weak radio emission in some of these sources, which, in the case of the Turner-Welch object near the UCHII region W3(OH), surprisingly, turned out to be of non-thermal nature and exhibits a jet-like shape (Reid et al. 1995; Wilner et al. 1999). In other cases, weak, up to (at least) 7 mm wavelength optically thick, ”hypercompact” HII regions were found (e.g., Tieftrunk et al. 1997; Churchwell 2002). In the Orion-KL region, one such source (”I”) was found to be jet-like and have a thermal spectrum (see Menten & Reid 1995 and below).
A basic motivation for searching compact radio continuum emission within high-mass protostellar cores is to precisely locate the position of the exciting sources, a critical requirement nowadays, as adaptive optics techniques deliver infrared observations with resolutions similar to the those of the interferometric radio data. Of equal or even more importance is the fact that the sheer existence of the radio continuum emission and its observed spectrum constrains theoretical models.
A forthcoming paper (Van der Tak & Menten, in prep.) summarizes existing radio data of high-mass protostars and presents new observations of such and similar sources.
In this paper we consider the case of CRL 2136222Also known as AFGL 2136 or GL 2136; = evolution-wise an intermediate case between W33A and GL 2591. Multi-wavelength near-infrared (NIR) imaging by Kastner et al. (1992) revealed a triple source structure, surrounded by nebulosity, which they whimsically named the “Juggler Nebula”. Their IR-polarimetry led Kastner et al. to suggest that a deeply embedded source in the westernmost part of the triple structure, IRS 1, was the dominating energy source, providing to the region, for which they derive a kinematic distance of 2 kpc.
This paper reports successful multi-radio wavelength searches for weak continuum emission from CRL 2136. At our highest observing frequency (43.3 GHz) we resolve the emission. We also present maps of the unusually compact water maser emission distribution associated with the source.
In Sect. 2 we describe the reduction of archival VLA continuum and 22.2 GHz H2O maser line data of CRL 2136 and present the results. In Sect. 3 we discuss these results in the context of other phenomena found in the region in question. We also claim that the H2O masers in this source belong to a class up to now not recognized, that is excited in the innermost circumstellar regions rather, as most water masers, in outflows further out.
2 VLA observations, data reduction and results
2.1 Archival continuum and water data
The archival CRL 2136 data discussed here were retrieved from the NRAO333The National Radio Astronomy Observatory (NRAO) is operated by Associated Universities, Inc., under a cooperative agreement with the National Science Foundation. Very Large Array (VLA) archival database (project name: AK 297, observing date: 1992 May 19, when the VLA was in its -configuration). Three continuum -databases were obtained. Each had data taken with 2 intermediate frequency (IF) bands of width MHz each centered MHz of 4.8601, 8.4399, and 14.9399 GHz. (These band are termed C-, X-, and U-band in radio astronomy lingo). In addition, a 127-channel spectral line database was used, containing a 15-minute duration snapshot of the H2O maser line at 22.23508 GHz toward CRL 2136 (which is in “K”-band). Each of the channels was of 12.2 kHz width, corresponding to 0.165 km s-1 and the total velocity coverage was 20.8 km s-1, centered at an LSR velocity of 26.3 km s-1 and, thus, covered to km s-1 around the systemic velocity, which is 22.8 km s-1 (van der Tak et al. 2000b).
The data were edited, calibrated, and imaged in the “usual” way with NRAO’s Astronomical Image Processing System (AIPS). In the case of the spectral-line data, the “channel 0” database, comprising the inner 75 % of the passband, was used for this. Absolute calibration was obtained from observations of 3C286 using the fluxes interpolated from the values given by Baars et al. (1977). NRAO 530 was the phase calibrator. Unfortunately, no 22.2 GHz data exist for 3C286. To achieve absolute calibration for the K-band data we determined NRAO 530’s flux density at that 22.2 GHz by extrapolation using the spectral index, determined from its X- and U-band flux densities. The error in the absolute calibration should be within 10%.
Restoring beam major and minor axes and position angles (PAs, east of north) were (7. ′′ 7,4. ′′ 5,18∘), (4. ′′ 3,2. ′′ 5), (2. ′′ 4,1. ′′ 5,6∘) for the C-, X-, and U-band maps, respectively.
2.2 Effelsberg water observations
A spectrum of the H2O maser line was taken in position-switching mode with the MPIfR 100 m telescope near Effelsberg, Germany. A K-band HFET receiver was used and the spectrometer was an autocorrelator.
2.3 New VLA continuum data
New VLA data were taken on two dates: On 2001 September 09 in C-configuration and on 2002 March 23 in A-configuration. This time observations were made in the highest (”Q”) VLA frequency band. On both dates, data were taken with 2 intermediate frequency (IF) bands of width MHz each centered MHz of 43.3399 GHz. Absolute and phase calibration and data processing was performed as described above, with the difference that short (duration sec) scans of CRL 2136 were alternated with 10 sec duration scans of the nearby calibrator 1829610374, with a 20 sec ”dead time” in between (needed for slewing). As proven a posteriori by the quality of the resulting images, this fast ”switching” provided for near-perfect calibration. For absolute calibration 3C286 was observed. Q-band observations are more affected by variations in the weather conditions and gain variations with telescope elevation than lower frequency observations.. Therefore, we estimate a 30% uncertainty for our Q-band flux densities.
Restoring beams were (0. ′′ 61,0. ′′ 43,∘) and (0. ′′ 057,0. ′′ 041,7∘) for the Q-band C- and A-array maps, respectively.
2.4 Continuum results
| Source | |||||||||
|---|---|---|---|---|---|---|---|---|---|
| 18h22m | -13∘ | (arcsec) | (mJy ) | (mJy) | (mJy ) | (mJy) | (mJy ) | (mJy) | |
| RS 1 | 17. s 22 | 27′ 414 | 0.3 | 3.1(0.2) | 4.5(0.5) | – | – | ||
| RS 2 | 22.11 | 33 18.5 | 0.4 | 1.9(0.2) | 2.9(0.5) | – | – | ||
| RS 3 | 26.10 | 30 09.7 | 0.3 | – | 0.63(0.08) | 0.69(0.16) | – | ||
| CH3OH | 26.3 | 30 06 | 10 | ||||||
| RS 4 | 26.37 | 30 11.9 | 0.3 | – | 0.56 (0.08) | 0.56 (0.08) | 0.99(0.13) | 1.30(0.27) | |
| H2O | 26.38 | 30 11.8 | 0.1 | ||||||
| IRS 1 | 26.5 | 30 12 | 2 | ||||||
| RS5 | 39.209 | 29 56.36 | 0.2 | 9.0(0.2) | 9.1(0.3) | – | – |
a and are the peak and integrated flux densities, respectively, and their formal errors determined with the AIPS task JMFIT. The absolute flux density calibration should have uncertainties of less than 10% at C, X, and U-band and % at K- and % at Q-band. Upper limits are 3 times the rms noise. Radio position errors are formal errors from JMFIT with the estimated absolute position error of 0.1 arcsec quadratically added. The error in the average H2O maser position is completely dominated by the latter. This “average” H2O position is the variance-weighted mean position of the Gaussian fit results to the velocity channels with strong ( Jy) emission, i.e., from 26.5 to 27.9 km s-1. RS 4 is also detected at 43 and 86 GHz at a position consistent with that given above (see Table 2). See reference in text for the CH3OH maser position.
At 4.9, 8.4, and 14.9 GHz we produced large maps of size around the phase center position of s . At 43.3 GHz only a small map of extent (6. ′′ 4,6. ′′ 4) was made. Table 1 lists the sources detected (using the multiple-peak-finding AIPS task SAD) with more than 5 times the rms noise levels of 0.16, 0.046, and 0.14 mJy beam-1 in the C-, X-, and U-band maps. The flux densities are corrected for primary beam response. The errors in Table 1 are statistical errors delivered by SAD added quadratically to the absolute errors of ′′ determined as follows. To obtain a “realistic” estimate of the absolute position errors remaining after phase calibration, we “calibrated” the NRAO 530 data “with” the 3C286 data. The resulting position differed from 3C286’s nominal position by ) = , , and at C-, X-, and U-band, respectively. Since the arc between NRAO 530 and CRL 2136 is more than 50 times greater than that between NRAO 530 and CRL 2136, we feel safe to assume that the errors in the positions in Table 1 are smaller that 0.1 arcsec. Rather than indicating that radio sources 1, 2, 3, and 5 in Table 1 are marginally resolved, the slightly higher numerical values of the integrated flux densities than the peak values are most likely caused by residual phase errors; self calibration was not possible due to the weakness of the emissions. Three radio sources (RS 1, 2, and 5) are detected at 4.9 GHz only and one (RS 3) at 8.4 GHz only. As shown in Fig. 1, only RS 3 and 4 are in the immediate vicinity of IRS 1.

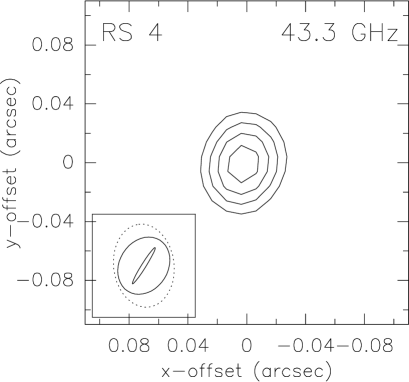
2.4.1 Radio source 4
Using JMFIT, we determine Q-band peak () and integrated () intensities of 4.49 (0.22) mJy beam-1 and 4.20 (0.36) mJy, respectively, for the C-array data and 1.43(0.10) mJy beam-1 and 1.78(0.21) mJy for the A-array data. The discrepancy between the A- and C-array fluxes is larger than our assumed error margin and is possibly due to source variability. We produced a source model, derived from a Gaussian fit to our (lower resolution) C-band data and introduced it in the A-array -database, imaged it and made a Gaussian fit to the model source flux distribution in the A-array map. We retrieved all the input flux. We therefore are certain that we are not “resolving out” any extended structure and have great confidence about the quality of our phase calibration.
JMFIT statistics yields the source properties listed in Table 2 with formal errors. The dimensions in the table should probably taken as an upper limit on the actual source size. Fig. 2 illustrates these results. The shape (elongation) and size as well as its radio luminosity and spectral index make RS 4, which is of central interest to this paper, strikingly similar to source I in the Orion-KL region (see Table 2 and discussion below).
2.5 Water results
In the water line, a -sized map was made of the channel with the strongest emission (at 27.1 km s-1). After several iterations of self calibration a 390 Jy strong feature was obtained. The phase and amplitude corrections were copied to the other velocity channels.

A spectrum at the pixel with maximum emission was made and is shown in Fig. 3. The peak emission is comparable in strength to the 330 Jy Valdettaro et al. (2001) report between 23 and 31 km s-1; the weak emission we observe outside that range is below their sensitivity limit. Their velocity of peak emission, km s-1, coincides exactly with ours, which is remarkable, since their observation was made on 2000 January 18, almost 8 years after the VLA data discussed here were taken. On 1991 January 31, Kastner et al. (1992) also detect a single feature (of 46 Jy flux density), however at = km s-1. The Effelsberg spectrum has its peak emission at 27.0 km s-1. In some sources H2O maser spectra vary significantly on timescales as short as days and it is worth noting that the “stability” of a H2O maser spectrum observed toward CRL 2136 appears unique and has to be considered when modeling the emission.
While in the VLA spectrum, all of the strong emission is redshifted relative to the systemic velocity, the Effelsberg spectrum shows redshifted (between 24.6 and 28.8 km s-1) as well as moderately strong blueshifted emission (between 16.7 and 21.7 km s-1) at our noise level of 0.8 Jy and nothing between nor outside of these velocity intervals.

In Fig. 4 we present the results of Gaussian position fitting (using the AIPS task JMFIT). Since the total spatial spread of the emission is all within a synthesized beamwidth, only a single Gaussian was fitted to each channel. Each cross presents the position and error bars of the emission in one channel. The arrows underneath the spectrum (Fig. 3) mark parts which were averaged before mapping. The emission from these velocities falls in the same general region as the stronger emission mapped individually, i.e., the ′′ ′′ ( AU) region around the variance-weighted mean position which is given in Table 1. Based on our experience with the lower-frequency data described below, we estimate that the “real” absolute position uncertainty (rather than the formal fitting error) in each coordinate is of order . To check whether other emission was present in the H2O channel maps, we used the aforementioned AIPS task SAD. We searched for any peaks with flux density above five times the rms noise level in each channel, which was between 36 and 54 mJy beam-1 for most channels except for channels around the channel with strongest emission (at 21.7 km s-1) in which it had a maximum of 220 mJy beam-1, bearing witness to the excellent dynamic range in this (snapshot) observation. No emission was found except for that shown in Fig. 4, which covers an area of of our FWHM synthesized beam width.
3 Discussion
3.1 OH and CH3OH maser emission from the CRL 2136 hot core
The molecular hot core around CRL 2136 is characterized by elevated temperatures. For example, van der Tak et al. (2000a) find a methanol rotation temperature of 143 K, which is a lower limit to the kinetic temperature of the CH3OH-emitting gas. However, the CH3OH abundance is only relative to H2, 2 to 3 orders of magnitude below the solid-state abundances and the gas-phase values found in other hot cores of similar temperature and difficult to explain, since CH3OH evaporates off grain mantles for temperatures exceeding K (Sandford & Allamandola 1993). Possibly, a compact hot core with much higher CH3OH abundance exists, but, if it has a diameter of, say, would have a much smaller filling factor in van der Tak et al.’s beam and would be “swamped” by more extended, lower methanol abundance material. Such a hot core would need to have much higher temperature than 143 K, because that value should in this case represent an “average” of the temperatures of the extended and hot core material.
Some insight may come from CH3OH masers, which can be studied at milli-arcsecond resolution. As shown by Walsh et al. (2001) and Beuther et al. (2002b), class II CH3OH masers are excellent tracers of deeply embedded massive and intermediate-mass stars, as well as of ultracompact HII regions. The 6.7 GHz class II CH3OH maser emission toward CRL 2136 found by Macleod et al. (1992) in 1991 October/November consisted of a single, narrow ( km s-1), 25 Jy strong feature at the position listed in Table 1 and is, given its error in both coordinates coincident with our radio sources 3 and 4, although an identification with RS 4 seems more likely. Caswell et al. (1995) reobserved a virtually identical spectrum in 1992/1993. A more accurate position determination and high resolution mapping of the CRL 2136 CH3OH maser, e.g. with Australia Telecope National Facility Compact Array 444http://www.atnf.csiro.au/, seem highly desirable.
Weak (1–2 Jy) OH maser emission was observed by Cohen et al. (1988) between and 23 km s-1 in the 1665 and 1667 main hyperfine transitions and the former line was mapped using the VLA by Argon et al. (2000). The latter authors’ positions are shown in the lower panel of Fig. 1. It is obvious that the OH, and by implication the class II CH3OH masers probe the hot, dense environment in the immediate vicinity of RS 4. Other proof of this is the good agreement of the velocity spread of the lines from various species studied by van der Tak et al. (2000b).
The position of one 1665 GHz LCP feature (at 20.92 km s-1) agrees to within 3 times the relative position uncertainly with that of an RCP feature at 20.42 km s-1, indicating Zeeman-spitting. The derived B-field strength is 1 mG, which is a few times smaller than “typical” values one finds in interstellar OH maser regions.
To summarize the OH and CH3OH maser data: The maser velocities suggest that they arise from the hot core surrounding IRS 1, but they are in a region further away (1000– 4000 AU) from the heating source (IRS 1), in which temperatures ( K) and densities ( cm-3) (see Menten 1997) are conducive for their excitation.
3.2 Radio source 4 and its environment
| CRL 2136-RS 4 | Orion-KL (I) | |
|---|---|---|
| (mJy) | – | |
| (mJy) | b | |
| (mJy) | c | |
| (mJy) | d | |
| (mJy) | e | f |
| (mas) | d | |
| (mas) | d | |
| major axis a (AU) | 58 | 43 |
| minor axis b (AU) | 6 | 29 |
| position angle (E of N) | d |
a and are the peak and integrated flux densities, respectively, determined with the AIPS task JMFIT. The upper limit is 3 times the rms noise. Source sizes were also determined using JMFIT and are discussed in the text.
b Menten & Reid 1995
c Felli et al. 1993
d Menten & Reid (in prep.)
e van der Tak et al. 2000b
f Plambeck et al. 1995
Although the relation of the intensity of the weak radio continuum emission detected in some high-mass protostars to their overall luminosity is at present not understood at all, it is clear that it represents a signpost for the exact position of the object and should, by means of theoretical modeling, give clues to its evolutionary state. Take the case of Orion-IRc2: Here, as shown by Menten & Reid (1995), the weak radio emission from source “I” almost certainly marks the position of the exciting object in the region, as the excitation of its surrounding SiO masers requires extreme temperatures and densities. Apart from the important signpost function, the detection of radio emission, which in the case of I is optically thick at least to a frequency of 43 GHz, can also put interesting constraints on the nature of the embedded protostar, as recently shown by Tan (2003), who proposes a jet model to explain I’s radio emission. It should be noted that at the distance, , of CRL 2136 (2 kpc), the detection of Orion source I ( pc) would require many hours of VLA time.
With regard to its low radio luminosity, rising spectrum, and likely connection with a powerful infrared source, RS 4 is similar to source I in Orion-KL (Table 2 and Figure 5). The latter source’s position in the centroid of SiO maser emission, which require high temperatures ( K) and densities ( cm-3) to be excited over the extent observed, makes it clear that it is the powering source in the region, providing the major portion of its luminosity of 555No SiO maser was found toward CRL 2136 by Kastner et al. 1992 in the 43.2 GHz transition to an rms noise level of 1 Jy. SiO maser emission has only been been detected in 3 star-forming regions, and in one of these, W51N (see Eisner et al. 2002) only in the transition. Also remarkable is that in Orion-KL the radio continuum/SiO emission is offset from the infrared source IRc 2, which represents reprocessed radiation, while the extinction toward the “real” source is so high to render it invisible even at the longest IR wavelengths accessible from the ground.
One may ask whether similar geometrical circumstances also apply to CRL 2136 and other infrared protostars. At first sight, it certainly seems peculiar that some of the most massive compact dust emission sources are even detectable at near- and mid-IR wavelengths, and, moreover, shine as strong background sources for spectroscopy throughout that wavelength range, while others, such as the intermediate-mass protostar(s) W3(OH)-TW, are completely undetectable from the ground (Wyrowski et al. 1997, 1999; Stecklum et al. 2002). For the Willner et al. sources, the CO column densities in infrared absorption (pencil beam) and submm emission (15′′ beam) differ by factors of 3 to 5, limiting the importance of geometry (van der Tak et al. 2000b).
What is the nature of the observed radio continuum emission from CRL 2136 (Fig. 5)? We derive a lower limit to the brightness temperature of 2020 K at 43.3 GHz, much higher than the dust sublimation temperature. RS 4’s 8.4 to 14.9 GHz spectral index (SI), is 1.5; inclusion of the 43.3 GHz data point yields = 1.2 and we are, thus, in all likelihood seeing optically thick(ish) free-free emission up frequencies of 14.9 GHz, which becomes optically thinner at higher frequencies.

From the Kastner et al. (1994) 150 to 667 m data we determine an SI, of 3.3, consistent with optically thin dust emission (Fig. 5). Extrapolation down to 86 GHz from the higher frequencies using this SI shows 95% of the 86 GHz flux density of 42 mJy can be accounted for by dust emission. Extrapolation of the cm-data (using = 1.2) yields 17 mJy, indicating a flattening of the radio spectrum. As Table 2 and Fig. 5 demonstrate, RS 4 and I share a number of characteristics: Both have elongated, jet-like morphology, rising radio spectra that flatten above 30 GHz, and even comparable physical dimensions.
Motivated by Orion source I’s elongated morphology, Tan (2003) models this source as a double jet, powered by accretion onto a protostar. For accretion rates above yr-1 he finds the flux densities at 30 GHz to be insensitive to the accretion rate and to grow as , while the spectrum flattens at higher frequencies and a dependence up to 86 GHz seems to require yr-1, a very high value. Maybe this model can be taken as a starting point for further studies trying to explain the radio emission from IRS 1/RS 4. Differences between RS 4 and I are the former source’s times higher lower frequency radio luminosity and the lower turnover frequency. Reynolds (1986), modeling collimated ionized stellar winds, finds that an SI of 1.2 requires recombination or acceleration in the flow.
Neufeld & Hollenbach (1996) have calculated the free-free emission emerging from an accretion shock for different protostellar masses, , and infall rates . Alas, even for the most extreme cases they considered, = 10 (solar masses) and yr-1, the 4.8 and 8.4 GHz flux densities they obtained, scaled to kpc, are more than a factor of hundred lower than the flux densities we measure at these frequencies, making this mechanism extremely unlikely.
3.3 CRL 2136’s compact water maser emission
The three most salient observational facts of the H2O maser emission from RS 4 are: First, the strongest H2O maser mission is redshifted relative to the systemic velocity of 22.8 km s-1. Second, the centroid position of the H2O emission has a formal offset of = from, and thus is within the errors coincident with RS 4, and third, all of the H2O emission is within the small rectangle of size ′′ ′′ ( AU) outlined in Fig. 1 and shown in detail in Fig. 4. It seems worth mentioning that the strongest ( Jy) emission arises from two compact regions, separated in NS direction by ′′ (= 140 AU).
Assuming, first, that the LSR velocity of the protostar is identical to that of its surrounding hot core, and, second, that either of the compact strong emission regions is spatially coincident with the continuum source, the observed redshift of the strong H2O emission means that we are observing infall of the water-containing material onto the protostar. The fact that the continuum emission is optically thick naturally explains the predominance of red-shifted H2O emission.
If the above were true, the case of CRL 2136 would be a convincing case of water maser emission emerging from inflowing circum-(proto)stellar gas. There is abundant evidence for interstellar maser emission associated with bipolar molecular outflows, both, from the frequently observed extreme velocity ranges (often tens of km s-1 around the systemic velocity or more) and from direct proper motion determinations (see, e.g., Reid & Moran 1988). For the (outflow) cases, excitation calculations place the water in the postshock regions of -shocks, where densities are a few times – cm-3, the temperature is K, and the water abundance is enhanced in the postshock chemistry (Elitzur et al. 1989).
Given the fact that H2O masers are “usually” outflow tracers par excellence we speculate, hesitantly, but excitedly, that the redshifted H2O maser emission moving onto CRL 2136 is produced in the postshock gas behind the accretion shock. Neufeld & Hollenbach (1996) consider accretion shock velocities of 30 km s-1 or higher, much smaller than the values indicated by our emission.
Given that CRL 2136 drives a massive outflow (with 50 in the outflowing gas), mapped in the CO molecule by Kastner et al. (1994), it is curious that we do not see any water emission at all that is associated with the outflow, given the ubiquity of H2O maser emission observed from outflows from stars of all masses666The poorly collimated CO outflow is along a position angle of over a ( pc) area, with the blueshifted gas SE and the redshifted NE of IRS 1. There is little correspondence with our H2O maser distribution (Fig. 4), other than that we also observe redshifted emission N of the blueshifted emission, although at 200 times smaller scale.. Most regions, placed at CRL 2136’s distance, would show copious H2O emission within several to (in Orion-KL) several tens of arcseconds from the exciting source. This H2O maser/accretion shock scenario is certainly speculative and has one obvious weakness: Given the dimensions of the continuum emission region only one, but not both of the regions with strong redshifted H2O emission regions can be coincident with the continuum. This assumes that the continuum source has the same size at 22.2 GHz, where the emission is optically thick, as at 43.3 GHz, where it is becoming optically thin. Moreover, there is the detection of blueshifted emission in the Effelsberg spectrum 1000 AU from the star, which is clearly inconsistent with a pure accretion shock scenario, necessitating the assumption of an additional outflow component. Actually, not only the blueshifted H2O masers must be outflowing, but also some of the redshifted ones, else a very high central mass is required.
Finally, we would like to mention that Fiebig (1997) modeled the water emission emission observed toward the FU Orionis star L1287 as clumps falling on the accretion disk, trying to explain the observed velocity distribution. We have not explored whether our H2O observations could be explained by a variation of his model.
3.4 Interstellar water masers not associated with bipolar outflows
It is clear from the observed wide radial velocity ranges, elongated emission distributions, and, most persuasively, measured proper motions that at least many, if not the majority of interstellar H2O masers are formed in, mostly bipolar, outflows (Reid & Moran 1988). Particularly collimated examples include W49 and W3(OH)-H2O(Gwinn et al. 1992; Alcolea et al. 1993). A model for masers with this morphology was presented by Mac Low & Elitzur (1992) and Mac Low et al. (1994).
In many cases where masers in both OH and H2O were mapped, the masers in the two species are frequently found in the same regions on a, say, 0.1 pc scale. However, on smaller scales one mostly finds distinctly different distributions for the two species. Moreover, in most cases OH maser emission covers a significantly smaller velocity range as H2O emission, indicating that it emerges from the slowly (a few km s-1) outmoving or infalling envelopes of young stars; in some cases, e.g. W3(OH), from just outside the ionization/shock front of an UCHII region (Reid et al. 1980)777While this picture for interstellar OH masers probably holds for the majority of the stronger sources, recently weak OH maser emission has also been identified offset from the UCHII/OH maser source W3(OH), whose position places it at the working surface of the H2O maser outflow that originates from a deeply embedded protostar neighboring the former region (Argon et al. 2003).
Given the completely different pumping requirements of H2O and OH masers ( cm-3/ K; Elitzur et al. 1989) and ( cm-3/ K; Cesaroni & Walmsley 1991), respectively, it is clear that both masers arise in quite different gas volumes ( and are density and kinetic temperature, respectively). The apparently contradictory result that H2O masers occur further away from their exciting sources than OH masers is explained by the fact that they arise from hot, compressed postshock material. Also, cases were OH and H2O masers appear on the same spot in the sky may be chance projections.
That the CRL 2136 maser is located so close (closer than the OH masers) to the exciting source, as well as its velocity structure, indicates that we are dealing with a maser that is not associated with an outflow, but, as discussed above, possibly with infall. This interpretation is corroborated by the absence of high-velocity H2O emission. Could a whole class of such H2O masers exist, which are clearly identified on observational grounds, but whose “distinction” from outflow-associated masers has not yet been recognized? We consider this to be entirely conceivable. Inspection of the OH and H2O maps of Forster & Caswell (1999) reveals a number of candidate sources that sometimes, although not always, are associated with weak contiunuum emission.
Another source showing a very similar relationship between H2O masers and a weak, compact, and elongated radio continuum source as CRL 2136 is AFGL 2591 (Trinidad et al. 2003), an infrared source of comparable luminosity to CRL 2136 [ (assuming kpc) compared to CRL 2136’s )]. Here the H2O masers are concentrated in a AU region.
We also mention the remarkable H2O maser distribution mapped by Torrelles et al. (2001) toward Cepheus AHW2, which to great accuracy traces part of a circular arc (of radius 62 AU), indicating spherical, episodic ejection. Recently, this arc was found to be expanding (Gallimore et al. 2003). Other regions with extremely compact H2O maser distributions (more compact than CRL 2136’s AU) are NGC 2071-IRS3 (40 AU possibly in a disk; Torrelles et al. 1998), and W75 N(B) (150 AU; Torrelles et al. 1997).
Finally, we mention that in Orion-KL, Genzel et al. (1980) identify, in addition to a high- and a low-velocity H2O outflow, the so-called “shell” masers888These masers are called “shell-type” by Genzel et al. because their velocity structure resembles that of H2O masers in evolved star circumstellar shells. These masers are “resolved out” by Genzel et al.’s and other high-resolution VLBI observations, although the latter authors give Hansen (1980) as a VLBI reference. A good VLA A-array map of the Orion H2O masers seems highly desirable!, which only occur in the immediate vicinity of IRc 2 (= source I) and have apparent maser spot sizes that are an order of magnitude larger than any other maser in the Orion region. These masers may be the archetype of the new class identified here.
4 Conclusions and outlook
Using the VLA, we have detected several weak radio continuum sources in the CRL 2136 region. One of these, RS 4, is, within the errors, coincident with IRS 1, the high-mass protostar exciting the region. Taking our 8.4, 14.9, and 43.3 GHz data and 86 GHz data from the literature, the emission, which is almost certainly free-free radiation, has a rising spectral index, of 1.2 up to 43.3 GHz, which flattens at higher frequencies. The continuum emission might be arising from a bipolar jet, as modeled by Tan (2003), and it seems highly desirable to apply his model to the region discussed here.
Water maser emission was found from a very confined region of size ′′ ′′ ( AU) with its centroid coincident with RS 4. All of the strong emission is redshifted relative to the systemic velocity by up to 4 km s-1. The strongest emission arises from a single feature (at km s-1), which appears to have been at the same velocity (to within km s-1) for a period of at least 9 years. Given the observed redshift, it is interesting to speculate that the water-containing gas giving rise to the strong emission is falling onto the central protostar and is boosted by amplification of the background continuum emission. Given the measured size of the continuum emission region ( ′′ ′′ ) this can only be true for part of the strong emission, which is arising from two compact regions 0. ′′ 08 apart. Simultaneous high ( ′′ ) resolution VLA observations of the H2O maser emission and the 22 GHz continuum emission will provide a detailed picture of the relationship between the two phenomena (reducing the cross-registration uncertainty to a few milli-arcseconds) and certainly prove or disprove the accretion shock scenario. Using the H2O maser as a phase reference (Reid & Menten 1990, 1997) will allow very high quality imaging.
The accretion shock seems a natural environment for the production of the H2O maser emission, which requires temperatures around 400 K and densities between and cm-3. Modeling efforts should explain the velocity stability of the strong maser feature. The model of free-free emission from accretion shocks by Neufeld & Hollenbach (1996) under-predicts the observed radio continuum by several orders of magnitude.
Finally, we speculate that the CRL 2136 H2O masers belong to a not yet identified class of H2O masers that are in the closest vicinity of the protostar and do not partake in outflows, but possibly are part of the infalling material. The prototype of this class are the “shell-type” masers in Orion-KL.
Acknowledgements.
We are grateful to Christian Henkel for taking the Effelsberg spectrum and to Jonathan Tan, Mark Reid, and Malcolm Walmsley for comments on the manuscript. We thank Joel Kastner for providing information on his old maser data. An anonymous referee provided valuable comments that led to a significantly improved paper. The 100-m telescope at Effelsberg is operated by the Max-Planck-Institut für Radioastronomie (MPIfR).References
- (1) Alcolea, J., Menten, K. M., Moran, J. M., & Reid, M. J. 1993, in Astrophysical masers, ed. A. Clegg & G. Nedoluha (Berlin: Springer), 225
- (2) Argon, A. L., Reid, M. J., & Menten, K. M. 2000, ApJS, 129, 159
- (3) — 2003, ApJ, 593, 925
- (4) Baars, J. W. M., Genzel, R., Pauliny-Toth, I. I. K., & Witzel, A. 1977, A&A, 61, 99
- (5) Beuther, H., Schilke, P., Menten, K. M., Motte, F., Sridharan, T. K.,& Wyrowski, F. 2002a, ApJ, 566, 945
- (6) Beuther, H., Walsh, A., Schilke, P., Sridharan, T. K., Menten, K. M., & Wyrowski 2002b, A&A, 390, 289
- (7) Caswell, J. L., Vaile, R. A., Ellingsen, S. P., Whiteoak, J. P., & Norris, R. P. 1995, MNRAS, 272, 96
- (8) Cesaroni, R., & Walmsley, C. M. 1991, A&A, 241, 537
- (9) Churchwell, E. 2002 in Hot Star Workshop III: The Earliest Stages of Massive Star Birth, ASP Conf. Proc., 267, ed. by P. A. Crowther, (San Francisco: ASP), 3
- (10) Cohen, R. J., Baart, E. E., & Jonas,J. L. 1988, MNRAS, 231, 205
- (11) Eisner, J. A., Greenhill, L. J., Herrnstein, J. R., Moran, J. M. & Menten, K. M. 2002, ApJ, 569, 334 (2002)
- (12) Elitzur, M., Hollenbach, D. J., & McKee, C. F. 1989, ApJ, 346, 983
- (13) Felli, M., Taylor, G. B., Catarzi, M., Churchwell, E., & Kurtz, S. 1993, A&AS, 101, 127
- (14) Fiebig, D. 1997, A&A, 327, 758
- (15) Forster, J. R., & Caswell, J. L. 1999, A&A, 137, 43
- (16) Gallimore, J. F., Cool, R. J., Thornley, M. D., & McMullin, J. 2003, ApJ, 586, 306
- (17) Garay, G., & Lizano, S. 1989, PASP, 111, 1049
- (18) Genzel, R., Reid, M. J., Moran, J. M., & Downes, D. 1980, ApJ, 224, 884
- (19) Gwinn, C. R., Moran, J. M., & Reid, M. J. 1992, ApJ, 393, 149
- (20) Hansen, .S. S. 1980, Ph.D. thesis, Univ. of Mass., Amherst
- (21) Garay, G., & Lizano, S. 1989, PASP, 111, 1049
- (22) Kastner, J. H., & Weintraub, D. A. 1996, ApJ, 466, L103
- (23) Kastner, J. H., Weintraub, D. A., & Aspin, C. 1992, ApJ, 389, 357
- (24) Kastner, J. H., Weintraub, D. A., Snell, R, L., Sandell, G., Aspin, C., Hughes, D. H., & Baas, F. 1994, ApJ, 425, 695
- (25) MacLeod, G. C., & Gaylard, M. J. 1992, MNRAS, 2567, 519
- (26) Mac Low, M., Elitzur, M., Stone, J. M., & Konigl, A. 1994, ApJ, 427, 914
- (27) Mac Low, M. & Elitzur, M. 1992, ApJ, 393, L33
- (28) Menten, K. M. 1997 in IAU Symp. 178: Molecules in Astrophysics – Probes & Processes, ed. E. van Dishoeck (Dordrecht: Kluwer), 163
- (29) Menten, K. M., & Reid, M. J. 1995, ApJ, 445, L157
- (30) Mitchell, G. F., Maillard, J.-P., Allen, M., Beer, R., & Belcourt, K. 1990, ApJ, 371, 342
- (31) Mitchell, G. F., Maillard, J.-P., & Hasegawa, T. I. 1991, ApJ, 371, 342
- (32) Molinari, S., Brand, J., Cesaroni, R., & Palla, F. 1996, A&A, 308, 573
- (33) — 2000, A&A, 355, 617
- (34) Molinari, S.; Brand, J.; Cesaroni, R.; Palla, F., & Palumbo, G. G. C. 1998, A&A, 336, 339
- (35) Moran,J. M. 1998,Proc. SPIE,3357, 208
- (36) Neufeld, D. A., & Hollenbach, D. J. 1996, ApJ, 471, L45
- (37) Plambeck, R. L., Wright, M. C. H., Mundy, L. G., & Looney, L. W. 1995, ApJ, 455, L189
- (38) Reid, M. J., Argon, A. L., Masson, C. R., Menten, K. M., & Moran, J. M. 1995, ApJ, 443, 238
- (39) Reid, M. J., Haschick, A. D., Burke, B. F., Moran, J. M., Johnston, K. J., & Swenson, G. W. Jr. 1980, ApJ, 1980, 239
- (40) Reid, M. J., & Moran, J. M. 1988 in Galactic and extragalactic radio astronomy (2nd edition) (Berlin and New York: Springer), 255
- (41) Reid, M. J., & Menten, K. M. 1990, ApJ, 360, L51
- (42) — 1997, ApJ, 476, 327
- (43) Reynolds, S. P. 1986, ApJ, 304, 713
- (44) Sandford, S. A. & Allamandola, L. J. 1993, ApJ, 417, 815
- (45) Sridharan, T. K., Beuther, H., Schilke, P., Menten, K. M. & Wyrowski, F. 2002, ApJ, 566, 931
- (46) Stecklum, B., Brandl, B.; Henning, Th., Pascucci, I., Hayward, T. L., & Wilson, J. C 2002, ApJ, 392, 1025
- (47) Tan, J. C. 2003 in Galactic Star Formation across the Stellar Mass Spectrum, ed. J. M. de Buizer & N. S. van der Bliek (San Francisco: ASP), 207
- (48) Torrelles, J. M., Gomez, J. F., Rodriguez, L. F., Ho, P. T. P., Curiel, S., & Vazquez, R. 1997, ApJ, 489, 744
- (49) Torrelles, J. M., Gómez, J. F., Rodríguez, L. F., Curiel, S., Anglada, G., & Ho, P. T. P. 1998, ApJ, 505, 756
- (50) Torrelles, J. M., Patel, N. A., Gómez, J. F., et al. 2001, Nature, 411, 277
- (51) Tieftrunk, A. R., Gaume, R. A., Claussen, M. J., Wilson, T. L., & Johnston, K. J. 1997, A&A, 318, 931,
- (52) Trinidad, M. A., Curiel, S., Cantó, J., D’Alessio, P., Rodríguez, L. F., Torrelles, J. M., Gómez, J., Patel, N., & Ho, P. T. P. 2003, ApJ, 589, 386
- (53) Valdettaro, et al. 2001, A&A, 368, 845
- (54) van der Tak, F. F. S., van Dishoeck, E. F., Caselli, P. 2000a, A&A, 361, 327
- (55) van der Tak, F. F. S., van Dishoeck, E. F., Evans, N. J., II, & Blake, G. A. 2000b, ApJ, 537, 283
- (56) van der Tak, F. F. S., Boonman, A. M. S., Braakman, R., & van Dishoeck, E. F. 2003, A&A, in press (astro-ph 0309138)
- (57) van Dishoeck, E. F., et al. 1998, in ASP Conf. Ser. 132, Star Formation with the Infrared Space Observatory, ed. J. L. Yun & R. Liseau (San Francisco: ASP), 54
- (58) Walsh, A., Bertoldi, F., Burton, M. G., & Nikola, T. 2001, MNRAS, 326, 36
- (59) Wilner, D. J., Reid, M. J., & Menten, K. M. 1999, ApJ, 513, 775
- (60) Willner, S. P., Gillett, F. C., Herter, T. L, et al. 1982, ApJ, 253, 174
- (61) Wood, D. O. S., & Churchwell, E. 1989, ApJS, 69, 831
- (62) Wyrowski, F., Hofner, P., Schilke, P., Walmsley, C. M., Wilner, D. J., & Wink, J. E. 1997, A&A, 320, L17
- (63) Wyrowski, F., Schilke, P., Walmsley, C. M., & Menten, Karl M. 1999, ApJ, 514, L43