The impact of spheroid stars for Macho microlensing surveys of the Andromeda Galaxy
Abstract
The Andromeda Galaxy (M31) is an important test case for a number of microlensing surveys looking for massive compact halo objects (Machos). A long-standing theoretical prediction is that the high inclination of the M31 disk should induce an asymmetry in the spatial distribution of M31 Macho events, whilst the distribution of variable stars and microlensing events in the M31 disk should be symmetric. We examine the role of stars in the M31 visible spheroid as both lenses and sources to microlensing events. We compute microlensing event number density maps and estimate pixel-lensing rates and event durations for three-component models of M31 which are consistent with the observed rotation curve, surface brightness profile and dynamical mass estimates. Three extreme models are considered: a massive spheroid model; a massive disk model; and a massive Macho halo model. An important consequence of the spheroid is that, even if Machos are absent in M31, an asymmetric spatial signature is still generally expected from stellar lensing alone. The lensing of disk sources by spheroid stars produces an asymmetry of the same sign as that of Machos, whilst lensing by disk stars against spheroid sources produces an asymmetry of opposite sign. The relative mass-to-light ratio of the spheroid and disk populations controls which of these signatures dominates the overall stellar spatial distribution. We find that the inclusion of the spheroid weakens the M31 Macho spatial asymmetry by about over a disk-only asymmetry for the models considered. We also find for our models that Machos dominate over most of the far disk provided they contribute at least of the halo dark matter density. This is a conservative limit since many stellar events are too short to be detected by present surveys. The presence of the spheroid also has beneficial consequences for M31 lensing surveys. The stellar spatial asymmetry is likely to be important in distinguishing between a spheroidal Macho halo or a highly flattened halo or dark matter dominated disk, since spatial asymmetries of opposing signs are expected in these cases.
keywords:
M31: halo – lensing – dark matter1 Introduction
In recent years the Andromeda Galaxy (M31) has become a key target for microlensing experiments which are trying to detect massive compact halo objects, or Machos (Aurière et al. 2001; Crotts et al. 2001; Riffeser et al. 2001). There are two reasons for this. The first is the development of new techniques which allow microlensing to be detected reliably against unresolved stellar fields, enabling microlensing searches to be directed toward more distant galaxies. The second reason is that the evidence gathered by the first generation of microlensing experiments towards the Magellanic Clouds remains inconclusive regarding the existence of Machos (Alcock et al. 2000; Lasserre et al. 2000; Afonso et al. 2003). This is largely because the contribution of the Magellanic Clouds themselves to the observed microlensing rate is highly uncertain.
The favourably high inclination of the M31 disk presents a very promising diagnostic for the current experiments to establish the presence or absence of Machos. Crotts (1992) noted that if M31 Machos have a spheroidal distribution the inclined disk should induce a spatial asymmetry in the distribution of M31 Macho microlensing events, with more events being seen towards the far disk which lies behind a larger fraction of the halo column density. By contrast, foreground Milky Way Machos, stellar microlensing events in the M31 disk, and variable stars mistaken for microlensing, are expected to be symmetrically distributed. The near-far asymmetry prediction therefore provides, in principle, a clean and simple way to distinguish M31 Machos from other populations. Several theoretical studies have exploited this to establish how Macho or galactic model parameters could be measured by the M31 microlensing surveys (Gyuk & Crotts 2000; Kerins et al. 2001; Baltz, Gyuk & Crotts 2003; Kerins et al. 2003).
The visible spheroid of M31 has the potential to complicate this simple picture. Despite superficial similarities between our own Galaxy and M31, their visible spheroid populations appear to be different in two key respects. Firstly, several studies indicate that, as well as comprising metal-poor stars, the M31 spheroid contains a dominant metal-rich population (Holland, Fahlman & Richer 1996; Durrell, Harris & Pritchet 2001; Bellazzini et al. 2003), in contrast to the exclusively metal-poor Galactic spheroid. Secondly, the M31 spheroid has a much higher luminosity density than that of our own Galaxy in relative terms (Reitzel, Guhathakurta & Gould, 1998). These two features may have a common link. Ferguson et al. (2002) have reported the existence of significant stellar substructure in the outer regions of M31. Substructure is evident both as coherent stellar density enhancements and as metallicity variations. The alignment of a stellar stream to the location of the satellite galaxy M32 indicates that this galaxy may be the origin of some of this substructure. Ferguson et al. (2002) suggest that M32 may have once been a much larger galaxy and that its material has been stripped to pollute and beef-up the M31 spheroid.
Whatever is the origin of the M31 spheroid, its impact on the expected microlensing signature must be assessed. Kerins et al. (2003) have already noted that the low surface brightness stellar streams are unlikely to have a significant impact for microlensing studies. The same cannot be assumed for the M31 spheroid. Its shape and density means that it has the potential to induce an asymmetry similar to that for M31 Machos, making the task of identifying a Macho population more difficult. Its stars may also act as sources to microlensing events arising from other lens populations, modifying their spatial distribution.
In this study we investigate the likely effect of the spheroid population on the spatial microlensing signature towards M31. Section 2 provides analytical arguments for asymmetry from stellar lenses. In section 3 we present a set of extreme but simple three-component galactic models for M31 which are likely to bracket realistic models. We compute microlensing event number density maps and discuss microlensing rates for these models in Section 4 and discuss the effect of the spheroid on Macho searches in Section 5.
2 Asymmetry from stellar lenses
The predicted near-far asymmetry due to M31 Machos is expected to occur because of the larger halo column density lying in front of the far disk compared to that in front of the near disk (Crotts, 1992). We may therefore anticipate a similar signature due to M31 spheroid stars acting as lenses against disk sources. However, in this case there is also a reverse asymmetry due to lenses in the disk microlensing background spheroid stars. Which of these two asymmetry signatures might we expect to dominate the spatial signature of stellar lensing events? We can answer this question by considering the number density of stellar lensing events in the two components. The event number density along a given line of sight scales with lens (source) distance () as
| (1) |
where () is the lens (source) mass density, is the mass-to-light ratio of the source population and is the mean pairwise velocity of lenses and sources. Equation (1) is proportional to the rate of microlensing for sources at , multiplied by the source number density.
For a fixed source luminosity density the number of sources depends upon the typical source luminosity . However, the expected number of pixel-lensing events turns out to be independent of source luminosity to first order. The faintest detectable pixel-lensing events require a minimum source magnification in order to be seen against the local surface brightness flux. In pixel lensing the large bulk of observed events involve highly magnified sources, for which and is the largest impact parameter between lens and source which still provides a detectable event. Since the pixel-lensing rate per source it follows that . So, even though the number of potential sources for a fixed surface brightness, the total number of pixel-lensing events does not depend on to first order.
For lines of sight passing through the major axis of M31 the disk stars are, to a good approximation, at a fixed distance from the observer. So, in the case of spheroid lenses and disk sources we have , where is the disk column density and is the Dirac delta function, is the lens density distribution and is the source star mass-to-light ratio. The event number density for spheroid lenses and disk sources for lines of sight passing through the M31 major axis is therefore
| (2) |
In the case of disk lenses and spheroid sources we have , and , implying an event number density
| (3) |
In both equation (2) and (3) above we have dropped the factor since the symmetry between the two lens populations we are considering permits us to treat it as a constant. Given the spatial symmetry of the disk and spheroid populations for lines of sight passing through the M31 major axis we can compare directly the rate contribution for spheroid lenses at to the contribution for sources at :
| (4) | |||||
This simple formula tells us that the direction of asymmetry for stellar lenses is controlled by the mass-to-light ratio of the disk and spheroid populations. If for the spheroid exceeds that for the disk then one expects spheroid lenses to dominate number counts on the major axis, and so the overall stellar asymmetry should be in the same direction as that of M31 Machos, i.e. more events towards the far disk. If the disk has a larger then disk lenses should dominate and we can expect the stellar asymmetry to run counter to that of M31 Machos.
3 Extreme models of Andromeda
| Model | Component | Mass | |||||||
| Massive halo | halo | 191 | 0.25 | 155 | 2 | – | – | – | 1 |
| spheroid | 4.4 | 4.5 | 40 | 1 | 9 | – | – | 0.6 | |
| disk | 3.2 | 0.24 | 40 | – | 4.5 | 6 | 0.3 | – | |
| Massive spheroid | halo | 89 | 0.01 | 85 | 10 | – | – | – | 1 |
| spheroid | 8 | 2.5 | 40 | 1.5 | 14 | – | – | 0.6 | |
| disk | 11 | 0.6 | 40 | – | 18 | 7 | 0.3 | – | |
| Massive disk | halo | 79 | 0.01 | 110 | 8 | – | – | – | 1 |
| spheroid | 4.4 | 4.5 | 40 | 1 | 9 | – | – | 0.6 | |
| disk | 19 | 1.4 | 40 | – | 26 | 6 | 0.3 | – | |
| Reference | halo | 123 | 0.065 | 100 | 4 | – | – | – | 1 |
| spheroid | 4.4 | 4.5 | 40 | 1 | 9 | – | – | 0.6 | |
| disk | 5.3 | 0.35 | 40 | – | 8 | 6.4 | 0.3 | – |
In assessing the likely contribution of the visible spheroid population we choose to set up three extreme models which are likely to bracket realistic models. We are not trying to present the models as likely descriptions of the M31 structure, rather we wish to ensure that the real signature lies somewhere within the range of results we find for our extreme models. Each of our models comprises three components: a visible spheroid, a disk population, and a dark halo. We do not include any nuclear bulge component mainly because the bulge region is unlikely to be useful to experiments wishing to measure any near-far spatial asymmetry arising from Machos, but also because not including it allows us to test the widest possible mass range for the other components.
Constraints on possible models come from the M31 surface brightness profile, the rotation curve and from dynamical mass estimates, so we ensure that our models satisfy at least these constraints. We also ensure that the -band values of the visible populations in our models is not lower than considered reasonable for those populations, though we do not impose any upper bound on .
For our halo we assume a simple cored near-isothermal sphere, with a density falling off with radius as
| (5) |
where is the central density and is the core radius. The disk is assumed to have a sech-squared distribution:
| (6) |
where are cylindrical coordinates, the disk scale length and the scale height. Finally, we model the spheroid by a flattened power law:
| (7) |
with the ratio of minor to major axes and the power law index. Reitzel, Guhathakurta & Gould (1998) find that and provide a good fit to their number counts of RGB stars at a projected distance kpc from the M31 centre, together with number counts from Holland, Fahlman & Richer (1996) in fields at and 10.8 kpc. However, a single power law does not provide a good global description of the M31 spheroid, which is better fit by a de Vaucouleurs profile (Pritchet & van den Bergh, 1994). However, as we shall see, this simple parameterisation reproduces the surface brightness distribution remarkably well in the inner galaxy. The main effect for microlensing calculations in using a single power law rather than a de Vaucouleurs profile is to increase the spatial dispersion of spheroid stars along the line of sight and so increase their contribution to the microlensing rate. For such a steep profile this is a small effect and, in any case, provides for a worst-case assessment of the impact of spheroid stars for Macho microlensing surveys.
The parameters of the galactic components are listed in Table 1 for the three extreme models. The massive halo model assumes an extreme total M31 mass of around , consistent with traditional estimates, whilst the other two models assume a total mass closer to , in line with recent determinations (Evans & Wilkinson 2000; Guhathakurta, Reitzel & Grebel 2000). The values for the disk and spheroid in the massive halo model are close to minimal and do not allow much room for non-luminous matter. By contrast in the massive spheroid model the disk and spheroid have larger values. This model possesses a halo with a large core radius and a disk with a slightly larger scale length in order to increase the spheroid contribution. In the massive disk and spheroid models the high disk assumes a dark matter dominated disk, something which is known not to be the case for the Milky Way disk (Crézé, Chereul, Bienaymé & Pichon, 1998). The disk and spheroid values are comparable for the massive spheroid model, whilst the spheroid is higher than that of the disk for the massive halo model and lower for the massive disk model. We have also included a reference model in Table 1. This model employs a less extreme set of parameters and therefore can be considered a more likely candidate model than the extreme models.

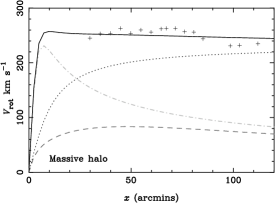
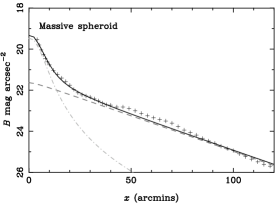
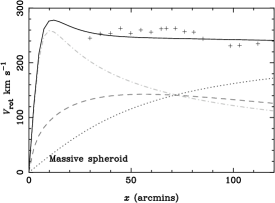
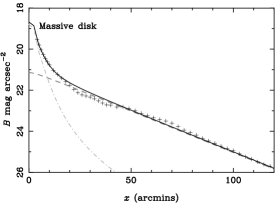
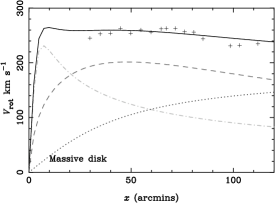
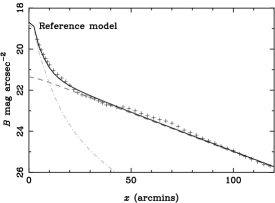
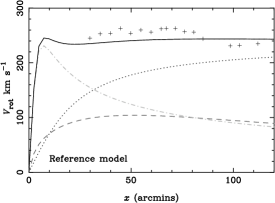
The resulting surface brightness profiles and rotation curves of the models are plotted in Figure 1. The left-hand figures show the predicted surface brightness distribution for the models, including the individual contributions of the spheroid and disk. Also plotted on these figures are the radially-averaged measurements of Walterbos & Kennicutt (1987). All models provide a remarkably good fit to the data. The right-hand plots show the rotation curve contributions for the spheroid, disk and halo, along with the overall profile. Rotation curve data, taken from Kent (1989), are also displayed. Whilst there are differences in the rotation curves of the models, they provide reasonable fits to the data given their simplicity.
We must emphasize that the assumed spheroid density law in equation (7) is unlikely to provide an accurate description towards the inner galaxy, despite the good agreement with the surface brightness profile in Figure (1). However, this is not particularly a problem for our study of the distribution of microlensing events in the outer regions. Reitzel, Guhathakurta & Gould (1998) found that the spheroid luminosity density in M31 is about ten times that of the Milky Way at a location equivalent to the Solar position in the Milky Way. For the spheroid model in the massive halo and disk models, which employs a standard spheroid value, we set the mass density normalisation to be consistent with this ratio. For the massive spheroid model the mass density is twice as large due to the larger assumed .
It should be stressed that the assumed form of the populations, especially that of the halo, plays a crucial role, along with the rotation curve and surface brightness distribution, in determining the relative masses of the components within each model. For example, in the massive halo model there is some leeway in the allowed ratio of spheroid to disk mass which would still produce acceptable profiles. Where this is the case we have tended to maximise the spheroid contribution. However, if we were to allow for dark halo distributions with density profiles which could be steeper or shallower than then obviously an even greater range of spheroid and disk mass ratios would be permissible. Our conclusions must therefore be viewed within the context of our model assumptions.
4 Microlensing event maps
Whilst our three-component models satisfy the observed rotation curve and surface brightness profile, we must remain aware of the limitations of their simplicity. Widrow, Perrett & Suyu (2003) have undertaken a detailed investigation of a number of self-consistent three-component bulge-disk-halo models of M31 employing a range of additional constraints including the inner velocity dispersion, bulge and disk , dynamical mass estimates, disk stability and cosmological considerations. Such analyses are especially important in constraining the expected rate of microlensing. However, we can probe the relative contributions of each population within our models by instead considering the optical depth, , a quantity which depends only upon the density distribution of lenses and sources. In this sense it is a more robust quantity than the event rate which depends additionally upon the lens and source velocity distributions as well as the lens mass function. Physically, is the number of ongoing microlensing events per source star at any instant in time. So, we can easily compute the instantaneous event number density as a function of position by multiplying by the number density of sources.
4.1 Pixel lensing event density and asymmetry
Pixel lensing differs from conventional microlensing in that the source stars are mostly unresolved, so microlensing events are seen only as small enhancements of the local surface brightness flux. The spatial distribution of pixel lensing events therefore depends upon the source luminosity function and the background surface brightness distribution, in addition to the usual parameters of classical microlensing. Specifically, a sufficiently high event magnification requires that the impact parameter, , in units of the Einstein radius be less than some threshold, , where depends upon the unlensed source flux and the background surface brightness at the event location. The number of microlensing events which are detectable at some sky position will therefore depend upon the quantity
| (8) |
where is the source luminosity function. Since the optical depth of events with impact parameter less than scales as , we define the pixel-lensing optical depth to be
| (9) |
This quantity is the number of ongoing events with at a given location.
We compute over a grid of sky positions on the M31 disk for each of the models in Table 1, and for each combination of lens and source population. The luminosity function of M31 stars is known only for the brightest stars so, to calculate , we make -band calculations taking M31 sources to have a Solar neighbourhood luminosity function for (Bahcall & Soneira 1980; Wielen, Jahreiss & Krüger 1987) and use the M31 luminosity function determined by Holland, Fahlman & Richer (1996) for . Whether a microlensing-induced flux enhancement is detectable depends upon experimental sensitivity, so is implicitly an experiment-specific quantity. We base our computations loosely on the POINT-AGAPE survey (Aurière et al., 2001) by computing flux changes within a square pixel array (a “super-pixel”) with a field of view. The radially-averaged surface brightness measurements of Walterbos & Kennicutt (1987) are used to compute the M31 surface brightness within the super-pixel. We assume that typically of a randomly-positioned point source PSF is contained within the super-pixel and that the survey is sensitive to super-pixel flux variations exceeding . In addition to the M31 surface brightness, we assume a sky background in of 19.5 mag/arcsec2, which conservatively allows for a lunar sky background contribution.
| No. of events ( arcmin2) | Asymmetry (far disk/near disk) | ||||||||
|---|---|---|---|---|---|---|---|---|---|
| Model | Halo | Spheroid | Disk | Overall | Stellar | Halo | Halo-to-disk | Overall | |
| Massive halo | 1.27 | 0.12 | 0.07 | 1.46 | 0.12/0.07 (1.67) | 1.01/0.26 (3.92) | 0.83/0.16 (5.24) | 1.13/0.33 (3.43) | |
| Massive spheroid | 0.70 | 0.30 | 0.27 | 1.27 | 0.29/0.28 (1.02) | 0.51/0.19 (2.75) | 0.37/0.09 (3.87) | 0.80/0.47 (1.72) | |
| Massive disk | 0.51 | 0.12 | 0.41 | 1.04 | 0.21/0.32 (0.68) | 0.38/0.13 (3.07) | 0.32/0.08 (3.77) | 0.60/0.44 (1.36) | |
| Reference | 1.08 | 0.11 | 0.11 | 1.31 | 0.12/0.10 (1.22) | 0.85/0.23 (3.60) | 0.69/0.14 (4.80) | 0.97/0.34 (2.89) | |
Table 2 displays the total number of ongoing events over a central arcmin2 region of M31, within which current surveys are looking for Machos. We have assumed for this Table that the M31 halo is full of Machos; for a partial Macho halo the number of halo events scales linearly with halo fraction. Since we are interested in the effect of stellar lenses on the spatially extended Macho population we have defined an 8 arcmin radius exclusion zone, counting only events outside this region. Since the inner region may be dominated by stellar lensing, surveys are likely to define such masks as a simple way of minimising the impact of the stellar lens contribution, so making their results less sensitive to the precise details of the inner galactic structure. The left-hand columns of the Table shows the number of ongoing events for each population, together with the cumulative total. The massive halo model provides the largest number of events overall, thanks to the substantially more massive halo assumed for this model. For all three extreme models M31 Machos provide the largest contribution of any individual lens population. However, whilst M31 Machos contribute almost of the event density for the massive halo model, they provide only around half of the events for the massive spheroid and disk models. In the far disk, beyond the region considered, the relative contribution of M31 Machos is significantly larger but the number of available sources is few and these regions are not being targeted by current surveys.
The disk shows a factor of 6 variation in the expected number of events between the three extreme models, whilst for the halo and spheroid the variation is just over a factor of 2. The variation in the overall number of events is rather less, at around . As we shall discuss in Section 4.2, the number of events computed from does not necessarily reflect the relative contributions one might observe in the event rate, since the rate also depends upon the event durations which are sensitive to the lens and source velocity distributions, as well as the lens mass function. Differences in these distributions between the lens populations will therefore mean differences between the relative contribution to the rate and the contribution to .
The right-hand columns of Table 2 show the asymmetry in the number of ongoing events against the far disk to those against the near disk. The numbers for the halo population again assume a halo full of Machos. The signature of asymmetry is the key diagnostic for the identification of Machos, but as Table 2 shows, one may also see an asymmetry in spatial distribution of stellar events. In the massive halo model the ratio of far-disk to near-disk events is 3.9 for M31 Machos and 1.7 for stellar lenses. Stellar lenses in this model therefore have a spatial asymmetry which is weaker but in the same direction as that of M31 Machos. For the massive disk model the stellar asymmetry is reversed, with only of stellar events occurring on the far side of the disk. This is because the disk in this model has a very high and so disk lensing against spheroid sources dominates the number of stellar events. In the massive spheroid model the of the spheroid and disk components are comparable and the distribution of stellar events is close to symmetric. These results bear out the analytic prediction of Section 2 that the presence and direction of spatial asymmetry due to stellar lenses is dictated by the ratio of values in the spheroid and disk populations. Clearly, unless there is fine tuning in the spheroid and disk , one should expect some asymmetry in the spatial distribution of stellar lenses. However, this asymmetry should be weaker than that due to M31 Machos if Machos contribute significantly to the dark matter.
The column labelled “Halo-to-disk” in Table 2 shows the asymmetry of M31 Machos against disk sources alone, ignoring the effect of spheroid sources. Comparison with the adjacent column labelled “Halo”, which includes both disk and spheroid sources, indicates that the presence of the spheroid sources dilutes the M31 Macho asymmetry by for the three extreme models. This result is largely insensitive to the very different mass normalisations assumed for the three extreme models.
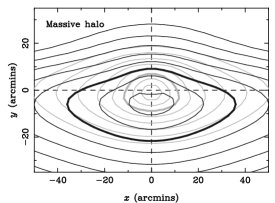
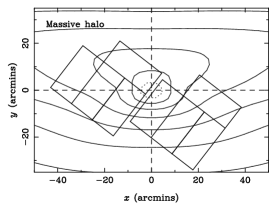
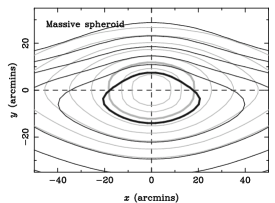
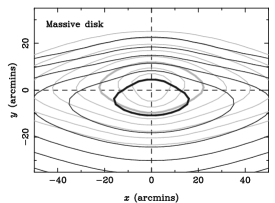
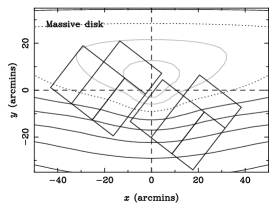
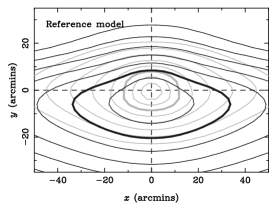

In Figure 2 the left-hand panels display contours of event number density, that is multiplied by source number density, for both M31 Macho and stellar lensing events over a central area covering arcmin2. A full Macho halo is assumed. The and axes are orientated along the major and minor axes of M31, respectively, with positive pointing towards the near side of the disk. The dark contours show the event density of M31 Machos, with the thick contour indicating a density of events/arcmin2. The density increases towards the M31 centre by a factor of 2 for each successive contour. The near-far asymmetry signature of the M31 Macho population is strongest for the massive halo model (top) but is clear for all three extreme models. The different mass normalisations of each component in the three extreme models have a clear impact on the number of M31 Machos, as evidenced by the relative positions of the thick contours.
The stellar lens distribution is shown by the light grey contours in the left-hand panels of Figure 2. Again, the thick contour indicates an event density of events/arcmin2 and contour spacing is the same as for the Macho distribution. As expected, the contours for the massive disk model are substantially flattened compared to those for the massive spheroid model. The stellar asymmetry for the massive halo and massive disk models is clearly evident. In the massive halo model the M31 Macho distribution is clearly more extended than that of the stellar lenses, however for the massive spheroid and disk models the stellar contribution remains substantial out to large distances from the M31 major axis.
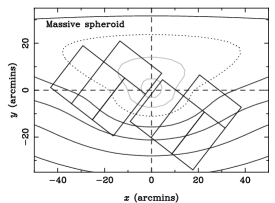
The relative importance of the stellar and Macho contributions to the number of ongoing events varies considerably across the three extreme models, as indicated by the right-hand panels of Figure 2. The light grey contours show the region where stellar lensing dominates, whilst darker contours indicate areas where M31 Machos provide the dominant contribution, assuming a full Macho halo. The locus of positions where the stellar and M31 Macho event number densities are equal is shown by the dotted line. Inside the dotted line the ratio of stellar-to-Macho event densities doubles as one progresses towards the M31 centre, whilst outside the dotted line the stellar-to-Macho event ratio halves for each contour level going outwards. The positions of the INT fields surveyed by the POINT-AGAPE and MEGA teams are also indicated for comparison (Aurière et al. 2001; Crotts et al. 2001). In the inner regions the event density is dominated by M31 Machos only for the massive halo model (top). In the massive spheroid model (middle panel) stellar lenses dominate within the central arcmins and also over a large area of the near disk between arcmins and arcmins. For the massive disk model stellar events provide the bulk of the near-disk events over almost the whole region considered. However, even for these extreme models Machos dominate the far disk event numbers for the case of a full Macho halo. For a halo with only a halo fraction the dotted contour is shifted outward by one contour level and for a halo fraction it is shifted outward by two levels.
From this we can estimate how small the M31 Macho halo fraction would have to be for the POINT-AGAPE/MEGA INT fields to be dominated everywhere by stellar rather than Macho lensing events. For the massive halo model Machos should dominate at least part of these survey fields provided their halo fraction exceeds . For the massive disk model we require a halo fraction above and for the massive spheroid model the Macho fraction must be at least . More generally, at least half of the far-disk region considered must be dominated by Machos if the M31 Macho halo fraction exceeds about . Interestingly, though stellar lenses dominate the largest fraction of the near disk in the massive disk model, their density drops off faster in the far disk than in the massive spheroid model, which is why the spheroid model requires a larger Macho halo fraction.
The event density distribution for the reference model is also shown in Figure 2. The distribution for this model is intermediate to those of the massive halo and spheroid models. The event density is dominated by Machos for this model outside of the innner 5 arcmins, assuming a full Macho halo, and dominates both the near and far disk. In this respect, the massive disk model may be regarded as the most extreme and unlikely of our three extreme models.
4.2 Event rates and timescales in pixel lensing
The pixel-lensing optical depth, , can be related to pixel-lensing timescales and rates in much the same way as the analogous observables in classical microlensing. We can define the pixel-lensing rate as (Kerins et al., 2001), where is the classical microlensing rate. Whilst in classical microlensing the characteristic event duration is given by the Einstein Radius crossing time, , in pixel lensing is generally not measurable because of a near-degeneracy in the light-curve between the event timescale, magnification and source luminosity (Gould, 1996). Instead the usual timescale observable in pixel lensing is the full-width half-maximum duration of the event. This can attain a maximum given by
| (10) | |||||
where is the lens mass, is the lens transverse velocity relative to the line of sight and . With these definitions we have
| (11) |
where is the average timescale and over-lines on other quantities also denote averages. Equation (11) relies on the fact that , so on average for fixed .
| Lens/Source | /kpc | /km s-1 | /days | /year | |
|---|---|---|---|---|---|
| halo/disk | 10 | 300 | 6 | (1.24,0.56,0.50) | (63,29,25) |
| halo/spheroid | 10 | 290 | 7 | (0.28,0.25,0.11) | (17,15,7) |
| spheroid/disk | 1 | 240 | 2 | (0.12,0.25,0.12) | (15,29,15) |
| spheroid/spheroid | 2 | 240 | 4 | (0.03,0.12,0.03) | (3,14,3) |
| disk/disk | 1 | 60 | 10 | (0.03,0.08,0.19) | (1,3,8) |
| disk/spheroid | 1 | 240 | 2 | (0.05,0.26,0.30) | (7,30,36) |
| TOTAL | – | – | – | (1.75,1.52,1.25) | (106,121,94) |
We can estimate the typical duration of pixel-lensing events from very general considerations of the various lens and source components. Though details of the lens and source velocity distributions can vary even for distribution functions with similar density profiles, the event duration represents a line-of-sight statistical average, and so is a reasonably robust quantity. Furthermore, the duration depends not just on the lens and source distribution functions but also on the lens mass function and source luminosity function. The timescale distribution is therefore rather broad and variations in the lens or source velocity distribution make a relatively modest contribution to this width.
The underlying depends upon the lens mass , relative transverse velocity and lens–source separation . Additionally, depends upon the impact parameter , where depends upon the source luminosity and background surface brightness. For our computations of in the previous subsection, over most of the area considered. On average we should find , so we adopt this value for all estimates. The typical mass of stellar lenses depends on their mass function . In the Solar neighbourhood for and below (Gould, Bahcall & Flynn, 1997). The lensing rate per unit lens mass is , and therefore the mean lens mass for stars between and is in the Solar neighbourhood. In the absence of detailed knowledge of the M31 stellar mass function we adopt for M31 stars. This also corresponds to the mass scale for Machos favoured by the results of the MACHO microlensing survey of the LMC (Alcock et al., 2000).
The relative transverse velocity varies according to lens and source population. If lens and source velocities can be described by a combination of rotational and random motions then we can expect the characteristic velocity to be , where subscript “l” and “s” denote lens and source velocities, respectively, “sys” denotes systematic motions due to rotation and “ran” represents the random velocity component. Table 3 lists characteristic values for for each combination of lens and source population. The numbers assume that Machos have 2-D random velocities of 235 km s-1, comparable to the disk rotation speed. We also assume disk and spheroid 2-D random velocities of 45 and 170 km s-1, respectively, and a spheroid rotational component of 30 km s-1. The contribution of rotational motions to will depend upon where events occur against the inclined M31 disk but, on average over the disk, the transverse component is about of the total rotational motion. Table 3 also indicates typical values for the lens–source separation .
Estimates for the typical and are computed from these representative values of , and , together with an assumed impact parameter . Based on these numbers, for disk lenses we can expect events/yr for the massive halo model, or up to six times this number in the case of the massive disk model. For spheroid lenses we can expect events/yr from the massive halo and disk models ranging up to 43 events/yr for the massive spheroid model. The expected number of M31 Machos ranges from events/yr for the massive disk model up to events/yr for the massive halo model.
The ratio of halo:spheroid:disk event rates is 1:0.2:0.1 for the massive halo model, 1:1:0.75 for the massive spheroid model and 1:0.6:1.4 for the massive disk model. These numbers indicate that in the massive disk and spheroid models stellar events are expected to dominate the overall rate. This is because the disk and spheroid in these models are effectively repositories of large amounts of dark matter in their own right. For the massive halo model, which employs more conventional values for the disk and spheroid , Machos out-number stellar events by more than 3:1, with Machos becoming increasingly dominant in the far disk.
An important caveat to these estimates is that they assume a detection efficiency for events of all timescales, something which is not the case for any real experiment. Sampling efficiency in particular is likely to have a large impact on the detected number of stellar events, which for the most part have typical durations of just a few days. Current experiments are unlikely to have good detection efficiency for events with durations below days. Given that the distribution is expected to be very broad, and the fact that we estimate days for most stellar events, we can expect that many more stellar events will escape detection, as compared to Machos with . This may mean that, even for the massive disk and spheroid models above, Machos still dominate the rate of detected events. Additionally, finite source size effects are not taken into account in these estimates, but are likely to be more important for stellar lenses than for Machos, due to the smaller lens–source separation. When is sufficiently small that the Einstein radius has a comparable angular size to the source star one expects differential magnification across the face of the source which may make stellar lens events harder to detect. Relative rates may also be affected by the orientation of Macho orbits. The Macho velocities in Table 3 assume an isotropic velocity distribution, whereas Machos on radial orbits are expected to produce a larger event rate, and an enhanced near-far asymmetry (Kerins et al., 2003).
Perhaps surprisingly, the total number of events predicted for the three models is similar. The ratio of the total event rates for the massive halo, spheroid and disk models is 1:1.1:0.9, respectively, slightly different from the 1:0.9:0.7 ratio for the total numbers of ongoing events computed from . The difference is due mainly to the fact that stellar lenses typically have smaller durations, so models with larger stellar lens contributions show an increase in the rate relative to their optical depth contribution. Overall the total number of events is a remarkably robust quantity given the large differences between the models.
5 Discussion
One of the key differences between M31 and our own Galaxy is that M31 possesses a more massive and luminous stellar spheroid. We have assessed the consequence of this for pixel-lensing experiments which are targeting M31. These experiments are hoping to confirm the existence of massive compact halo objects (Machos) by detecting an excess of events towards the far side of the M31 disk. The near-far spatial asymmetry expected for a spheroidal distribution of M31 Machos is regarded as a crucial test of the Macho hypothesis.
In this study we have shown that the presence of a massive stellar spheroid can induce asymmetry in the spatial distribution of stellar lenses. Analytical predictions, confirmed by more detailed model calculations, show that stellar lenses in the disk and spheroid are asymmetrically distributed if the spheroid and disk mass-to-light ratios differ. A higher spheroid should result in a stellar lens asymmetry in the same direction as that of Machos (i.e. an excess of far-disk events), whilst a higher disk results in an asymmetry of opposite sign to the Macho asymmetry (i.e. an excess of near-disk events). A positive consequence of this is that two competing dark matter scenarios, one in which one has a spheroidal dark Macho halo and one in which the dark lenses occupy a massive disk or highly flattened halo, should be distinguishable by the fact that they predict spatial asymmetries of opposite sign.
We have constructed three extreme models of M31, each comprising disk, spheroid and Macho halo populations. The massive halo model assumes conventional values for the spheroid and disk whilst the massive spheroid and disk models assume high values consistent with dark matter dominated stellar populations. By defining the pixel-lensing optical depth we have computed the number of ongoing events for each population and have constructed microlensing maps over a region of M31 currently being monitored by a number of survey teams. Whilst Machos make up of the events in the massive halo model, stellar lenses provide at least half of the signal for the other two models, even for a full Macho halo. However, even for these extreme stellar models, M31 Machos should dominate over most of the far disk if their halo fraction is around or larger.
We find for all three models that the inclusion of the spheroid dilutes the Macho near-far asymmetry signature by about over the disk-only asymmetry values. The overall asymmetry varies from 1.4 and 1.7 for the massive disk and spheroid models to 3.4 for the massive halo model. Kerins et al. (2003) argue that asymmetries weaker than a factor of 2 will be difficult to detect with current surveys, so if the M31 disk and spheroid is strongly dark matter dominated (in contrast to our own Galaxy) they could conceivably mask the asymmetry signature due to Machos. However, from general considerations of the likely Macho and stellar lens velocities we argue that many stellar lenses have durations too short to be detected by the survey teams. If Machos have a mass of around , as favoured by the MACHO LMC survey (Alcock et al., 2000) then the overall asymmetry of detected events is likely to be significantly larger than these estimates because the longer duration Macho events are easier to detect. Estimates of the expected event rates indicate that the total number of pixel-lensing events is remarkably insensitive to the relative mass normalisation of the halo, spheroid and disk components, though, again, there is likely to be a strong bias towards the detection of stellar-mass Machos over stellar lenses because of the short duration of stellar lensing events.
In summary, the presence of the spheroid complicates matters for pixel-lensing surveys of M31 and cannot be ignored. A positive detection of near-far asymmetry cannot, by itself, be taken as a confirmation of the Macho scenario since a stellar spheroid will produce a similar result if its is larger than that of the disk. In this case an analysis of the spatial extent is likely to be able to distinguish Machos from spheroid lenses, as spheroid lenses should be more strongly concentrated toward the M31 centre. The spheroid also has beneficial consequences for the microlensing survey teams. Candidate samples may be dominated by Machos, or by lenses in a highly flattened halo or disk, or they may instead be hoplessly contaminated by variable stars mistaken for microlensing. In the absence of a spheroid it might prove very difficult to distinguish between the latter two cases. The presence of the spheroid provides an all-important third signature with which one may be able to distinguish between all three scenarios. In the Macho case one expects a near-far asymmetry. In the case of a highly flattened lens population one expects a far-near asymmetry (i.e. an asymmetry of opposite sign to that of Machos) due to the presence of the spheroid. Finally, if the candidates are mostly variable stars their distribution should be symmetric.
References
- Afonso et al. (2003) Afonso C. et al., 2003, A&A, 400, 951
- Alcock et al. (2000) Alcock C. et al., 2000, ApJ, 542, 281
- Aurière et al. (2001) Aurière M. et al., 2001, ApJ, 553, L137
- Bahcall & Soneira (1980) Bahcall J., Soneira R., 1980, ApJS, 44, 73
- Baltz, Gyuk & Crotts (2003) Baltz E., Gyuk G., Crotts A., 2003, ApJ, 582, 30
- Bellazzini et al. (2003) Bellazzini M. et al., 2003, A&A, 405, 867
- Crézé, Chereul, Bienaymé & Pichon (1998) Crézé M., Chereul E., Bienaymé O., Pichon C., 1998, A&A, 329, 920
- Crotts (1992) Crotts A., 1992, ApJ, 399, L43
- Crotts et al. (2001) Crotts A. et al., 2001, in Menzies J.W., Sackett P.D., eds., ASP Conference Series Vol. 239, Microlensing 2000: A New Era of Microlensing Astrophysics. Astron. Soc. Pac., San Francisco, p.318
- Durrell, Harris & Pritchet (2001) Durrell P, Harris W., Pritchet C., 2001, AJ, 121, 2557
- Evans & Wilkinson (2000) Evans N.W., Wilkinson M., 2000, MNRAS, 316, 929
- Ferguson et al. (2002) Ferguson A. et al., 2002, AJ, 124, 1452
- Gould (1996) Gould A., 1996, ApJ, 470, 201
- Gould, Bahcall & Flynn (1997) Gould A., Bahcall J.N., Flynn C., 1997, ApJ, 482, 913
- Guhathakurta, Reitzel & Grebel (2000) Guhathakurta P., Reitzel D., Grebel E., 2000, in Discoveries and Research Prospects from 8- to 10-Meter-Class Telescopes, ed Bergeron J., Proc. SPIE Vol 4005, p168
- Gyuk & Crotts (2000) Gyuk G., Crotts A., 2000, ApJ, 535, 621
- Holland, Fahlman & Richer (1996) Holland S., Fahlman G., Richer H., 1996, AJ, 112, 1035
- Kent (1989) Kent S.M., 1989, AJ, 97, 1614
- Kerins et al. (2001) Kerins E. et al., 2001, MNRAS, 323, 13
- Kerins et al. (2003) Kerins E. et al., 2003, ApJ, in press
- Lasserre et al. (2000) Lasserre T. et al., 2000, A&A, 355, L39
- Pritchet & van den Bergh (1994) Pritchet C.J., van den Bergh S., 1994, AJ, 107, 1730
- Reitzel, Guhathakurta & Gould (1998) Reitzel D., Guhathakurta P., Gould A., 1998, AJ, 116, 707
- Riffeser et al. (2001) Riffeser A. et al., 2001, A&A, 379, 362
- Walterbos & Kennicutt (1987) Walterbos R., Kennicutt R., 1987, A&AS, 69, 311
- Widrow, Perrett & Suyu (2003) Widrow L., Perrett K., Suyu S., 2003, ApJ, 588, 311
- Wielen, Jahreiss & Krüger (1987) Wielen R., Jahreiss H., Krüger R., 1987, in The Nearby Stars and the Stellar Luminsoity Function, Proc IAU Colloq 76, eds A.G. Davis Philip, A.R. Upgren, L. Davis Press: Schenectady, New York, p163