What X-rays tell us about dark matter halos
Abstract
We present a detailed non-spherical modeling of dark matter halos on the basis of a careful analysis of state-of-the art N-body simulations. The fitting formula presented here form a complete and accurate description of the triaxial density profiles of halos in Cold Dark Matter(CDM) models. This modeling allows us to quantitatively discuss implications for shape observations of galactic and cluster halos. The predictions of the concordance CDM model are confronted with the shape observations from the Milky Way to X-ray clusters.
Shanghai Astronomical Observatory, the Partner Group of MPI für Astrophysik, Nandan Road 80, Shanghai 200030, China
1. Introduction


It is well known that dark matter halos are not spherical as predicted by current theories of structure formation (V. Springel, this volume, for a review). The shape of halos depends on the nature of dark matter and cosmological parameters in theory, and can be measured through a wide range of observations from the kinematics of satellites and debris in galaxies to the hot gas distribution of galaxy clusters. In this talk, I will first present an accurate model for the shape of dark halos in Cold Dark Matter (CDM) dominated models, and then discuss its implications for and confrontations with observed shapes of galactic and cluster halos.
2. Modeling the non-spherical density profiles of dark matter halos
We use two sets of state-of-the art simulations for the current purpose. The first is a set of cosmological N-body simulations with particles in a Mpc box (Jing & Suto 2002), and the other is a set of high-resolution halo simulation runs (Jing & Suto 2000).
To model the shape of dark matter halos, we first find the iso-density surfaces. This begins with a computation for the local density at each particle’s position. We adopt the smoothing kernel widely employed in the Smoothed Particle Hydrodynamics (SPH, Hernquist & Katz 1989). Thirty two nearest neighbor particles are used to compute the local density. The left panel of Figure 1 shows a typical example of the halo isodensity surfaces. This plot clearly suggests that the isodensity surfaces can be approximated as triaxial ellipsoids.
The isodensity ellipsoids at different radii are well aligned, and the axial ratios of the ellipsoids are nearly constant. These facts suggest that the internal density distribution within a halo can be approximated by a sequence of the concentric ellipsoids of a constant axis ratio. To show this to be an improved description over the conventional spherical description, we compute the quadrupole of the particle distribution within a spherical shell () or an ellipsoidal shell (). If the spherical (triaxial) model is exact, vanishes, thus a more accurate halo density profile should yield a smaller quadrupole. The ratio of these two quantities is plotted in the right panel of Figure 1. It clearly shows that the triaxial model works much better than the conventional spherical model.
We found that the matter density within the isodensity surfaces changes with the major axis in a way similar to that of the spherical model. The density profile can be approximately described by the NFW-like profiles, though the concentration parameter is different from the spherical model. In Jing & Suto (2002), we have given a recipe, based on our analysis of the simulations, for predicting the triaxial density profile for a halo in a general CDM cosmogony if the halo mass and halo shape (i.e. the axial ratios) are known.
The mass distribution of CDM halos is well described by the Press-Schechter formula (or its modified form) for theories of formation. Thus, in order to predict the density profiles for a sample of CDM halos, we need to quantify the distribution function of the axial ratios and at a given mass, where , , and are the minor, middle, and major axes respectively. The function can be written as
| (1) | |||||
| (2) |
The probability function and the conditional probability have been measured for halos in our SCDM and CDM simulations at different epochs. An example is given in Figure 2. Jing & Suto (2002) have found accurate universal functions to describe these two probability functions. The shapes depend both on the halo mass (through the ratio of the halo mass to the non-linear mass ) and on the cosmological parameters, and the distribution of the shapes is very broad. This means that in order to test the shape prediction of CDM models definitely, one generally needs a large sample of objects, e.g. galaxies or clusters of galaxies. As a reference, it would be interesting to have a look at typical values of halo shapes. For the concordance CDM model of a fluctuation amplitude , the typical values of the axial ratios and are 0.7 and 0.8 for Milky Way halos and 0.45 and 0.65 for clusters of galaxies. The galactic halos at redshift are expected to have and , much more eccentric than their counterpart at .
t


3. Comparison with the observations
From the kinematics within galaxies or from the X-ray observations of clusters, one may measure the potential of their dark halos. For the triaxial model in the last section, Lee & Suto (2003) presented a calculation for the distribution of iso-potential surfaces. Using the eccentricity , the ratio of the halo potential eccentricity to the halo density eccentricity at radius is a function of (Lee & Suto 2003; the left panel of Figure 3), where is a scale radius of the major axis in the generalized NFW form (Jing & Suto 2002). The potential becomes rounder at an outer radius, because the halo mass is concentrated in the central region. For a galactic halo of Milky Way mass, the axial ratio of the potential is 0.85 at the central region and is larger than 0.9 at the virial radius. These values are well consistent with the potential shape measured for the Milky Way (Sackett, P., Sellwood, J., this volume).
t

X-ray morphology of clusters can be computed from the potential under the hydrostatic equilibrium assumption, or can be measured directly from hydro/N-body simulations. Flores et al. (in preparation) have carried out a comparison of the cluster ellipticity between the concordance CDM model and an Einstein X-ray cluster sample. The distribution of the model clusters is completely consistent with that of the observed clusters, though larger samples both of simulation clusters and of observed clusters are badly needed for an accurate assessment. Flores et al. also noted that the shape distribution found in their work is well consistent with Jing & Suto (2002). In a recent work of Plionis (2002), a significant evolution is found of the cluster X-ray shapes, as higher-redshift clusters are more elongated than the local clusters. Floor et al. (2003) found it difficult to explain this ellipticity evolution within the concordance CDM model. I would like to point out, however, the comparison between the model and the observation carried out by Floor et al. might not be proper, because they used individual cluster simulations in their study. The “clusters” they identified at high redshift must be smaller than the clusters at , while in the observation of Plionis (2002) clusters at high redshift are much more massive than those at . With the triaxial model of Jing & Suto (2002), it is not difficult to explain the redshift dependence of the cluster ellipticity found by Plionis (2002), at least qualitatively, because the high redshift clusters in the observation are more massive.
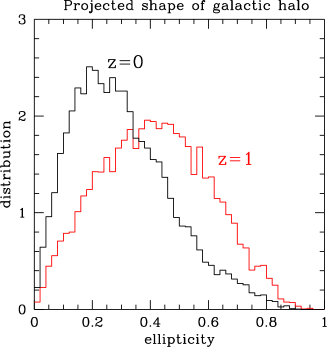
It is promising to probe the halo shapes directly with the weak lensing effect. The weak lensing measures the projected mass distribution (Schneider, P., this volume; Gavazzi et al. 2003). We have measured the shapes for the projected halo mass distribution in the simulations. The right panel of Figure 3 shows the distribution of the projected ellipticity for galactic halos (mass about ) in our simulations. The halos have a mean ellipticity or axial ratio at redshift , and or at . Recently, Hoekstra et al. (2003) have tentatively measured the shape of galactic halos through weak galaxy-galaxy lensing, and found for galactic halos at . Their results are in good agreement with our theoretical predictions, though it is important to note that they used a weighting procedure to measure the halo shapes that must be properly modeled in future comparisons between the observation and the theoretical predictions.
In addition, we have compared the shape distribution of rich clusters in the Standard Cold Dark Matter (SCDM; and ) and in the concordance CDM ( and ), and found their difference is not dramatic. One needs a large sample of local massive clusters (say a few thousand) to distinguish these two models definitely. This conclusion is in good agreement with an early study of Jing et al. (1995) on this subject.
4. Conclusions
We have presented a triaxial modeling of the dark matter halo density profiles on the basis of the combined analysis of the high-resolution halo simulations (12 halos with particles within their virial radius) and the large cosmological simulations (5 realizations with particles in a Mpc boxsize). In particular, we found that the universal density profile discovered by NFW in the spherical model can be also generalized to our triaxial model description. Our triaxial density profile is specified by the concentration parameter and the scaling radius (or the virial radius in the triaxial modeling) as well as the axis ratios and .
We have obtained accurate fitting formulae for those parameters which are of practical importance in exploring the theoretical and observational consequences of our triaxial model. Because the page limit of the proceedings, we could not have typed in these formulae. We refer the interested reader to the journal paper of Jing & Suto (2002) for the fitting formulae. As Springel summarized in his talk (this volume), the shape distribution of dark halos is now well determined in CDM models.
The model predictions are compared with various observations of halo shapes around galaxies or clusters of galaxies. While a good agreement is found between the concordance model prediction and the available observations, a large sample of galactic and cluster halos is needed to definitely test the prediction of the concordance model or to distinguish among theories of different dark matter, because the shape distribution of halos are generally very broad. It is also important to point out that iso-potential surfaces are much rounder than the iso-density surfaces, especially at halo outer part .
Acknowledgments.
I would like to thank the collaborator Yasushi Suto for his important contribution to the work, and Joel Primack for communicating their result on the shape distribution of x-ray clusters before publication. The work was supported in part by by NKBRSF (G19990754) and by National Science Foiundation of China.
References
Dubinski, J., 1994, ApJ, 431, 617
Floor, S., Melott, A., Motl, P., 2003, astroph/0307539
Flores, R., Bullock, J., Kravtsov, A., Primack, J., in prep.
Gavazzi, R., Fort, B., Mellier, Y., Pelló, R., & Dantel-Fort, M. 2003, A&A, 403, 11
Hernquist, L. & Katz, N. 1989, ApJS,70,419
Hoekstra, H., Yee, H.K.G., Gladders, M.D. 2003, ApJ, submitted, astroph/0306515
Jing, Y. P., Mo, H. J., Borner, G., & Fang, L. Z. 1995, MNRAS, 276, 417
Jing, Y. P., & Suto, Y. 2000, ApJ, 529, L69
Jing, Y. P., & Suto, Y. 2002, ApJ, 574, 538
Lee, J. & Suto, Y. 2003, ApJ, 585, 151
Plionis, M. 2002, ApJ, 572, L67