Quantitative Morphology of Galaxies in the Core of the Coma Cluster
Abstract
We present a quantitative morphological analysis of 187 galaxies in a region covering the central 0.28 square degrees of the Coma cluster. Structural parameters from the best-fitting Sérsic bulge plus, where appropriate, exponential disc model, are tabulated here. This sample is complete down to a magnitude of =17 mag. By examining the Edwards et al. (2002) compilation of galaxy redshifts in the direction of Coma, we find that 163 of the 187 galaxies are Coma cluster members, and the rest are foreground and background objects. For the Coma cluster members, we have studied differences in the structural and kinematic properties between early- and late-type galaxies, and between the dwarf and giant galaxies. Analysis of the elliptical galaxies reveals correlations among the structural parameters similar to those previously found in the Virgo and Fornax clusters. Comparing the structural properties of the Coma cluster disc galaxies with disc galaxies in the field, we find evidence for an environmental dependence: the scale lengths of the disc galaxies in Coma are 30% smaller. A kinematical analysis shows marginal differences between the velocity distributions of ellipticals with Sérsic index (dwarfs) and those with (giants); the dwarf galaxies having a greater (cluster) velocity dispersion. Finally, our analysis of all 421 background galaxies in the catalog of Edwards et al. reveals a non-uniform distribution in redshift with contrasts in density , characterized by a void extending from to km s-1, and two dense and extended structures centred at and km s-1.
1 Introduction
The properties of galaxies can vary depending on whether they reside in dense galaxy clusters or the field. The most remarkable example of this is the morphology–density relation (Dressler 1980) in which the proportion of elliptical galaxies increases toward the cores of rich clusters. The morphology of galaxies in clusters has been based, mostly, on a visual classification scheme. However, visual classification is only the first step in the characterization and description of galaxies. It is necessary to conduct a quantitative morphological analysis of galaxies in clusters to answer basic questions like: Are the properties of spiral galaxy discs, such as their scale-lengths, affected by the enviroment? Such a study is also required to make a detailed comparison with, and therefore test, current theoretical predictions (e.g. Moore et al. 1999; Gnedin 2003).
The proximity and richness of the Coma cluster has made it one of the most studied galaxy clusters. Since Godwin, Metcalfe, & Peach (1983) published the first wide-field galaxy catalog using photographic photometry, many other surveys have been conducted both in the central parts of this cluster (e.g., Jorgensen & Franx 1994; Karachentsev et al. 1995; Bernstein et al. 1996; Lobo et al. 1997; Secker & Harris 1997; Trentham 1998) and covering larger areas (e.g., Kashikawa et al. 1995; Terlevich, Caldwell & Bower 2001; Beijersbergen et al. 2002). A recent survey combining wide field photometry and spectroscopy has been presented in Komiyama et al. (2002) and Mobasher et al. (2001). There are numerous morphological studies of galaxies within the Coma cluster, both in the optical (e.g., Rood & Baum 1967; Dressler 1980; Lucey et al. 1991; Jorgensen & Franx 1994; Andreon et al. 1996; Andreon, Davoust, & Poulain 1997; Gerbal et al. 1997; Kashikawa et al. 1998; Mehlert et al. 2000; and Komiyama et al. 2002) and in the near-infrared (e.g., Pahre 1999; Mobasher et al. 1999; Khosroshahi et al. 2000).
In this paper we present the morphology and structural parameters of galaxies in the central region of the Coma cluster (0.28 square degrees). We wish to stress that our analysis uses for the first time velocity data to establish cluster membership. Furthermore, and importantly, we do not a priori assume to know what the distribution of light is in elliptical galaxies or the bulges of spiral galaxies. That is, rather than force the model on these systems, we use Sérsic’s (1968) model in an effort to measure the distribution/concentration of light. A detailed analysis of the relation between galaxy light concentration and galaxy environment was addressed in a previous paper (Trujillo et al. 2002a, hereafter T02A). One of our present objectives is to study the various correlations among the structural parameters, and to search for possible differences according to morphological type or local conditions within the cluster. A study of a rich and nearby cluster like Coma is also very useful for establishing a local reference for studies of clusters at intermediate and high redshifts.
Section 2 describes the observations and the compilation of redshifts. The method to determine the quantitative morphology of galaxies is outlined in Section 3. In Section 4 we explore the relationships between the structural parameters and also with the environment. Section 5 summarizes the main results of the paper.
2 The sample and observations
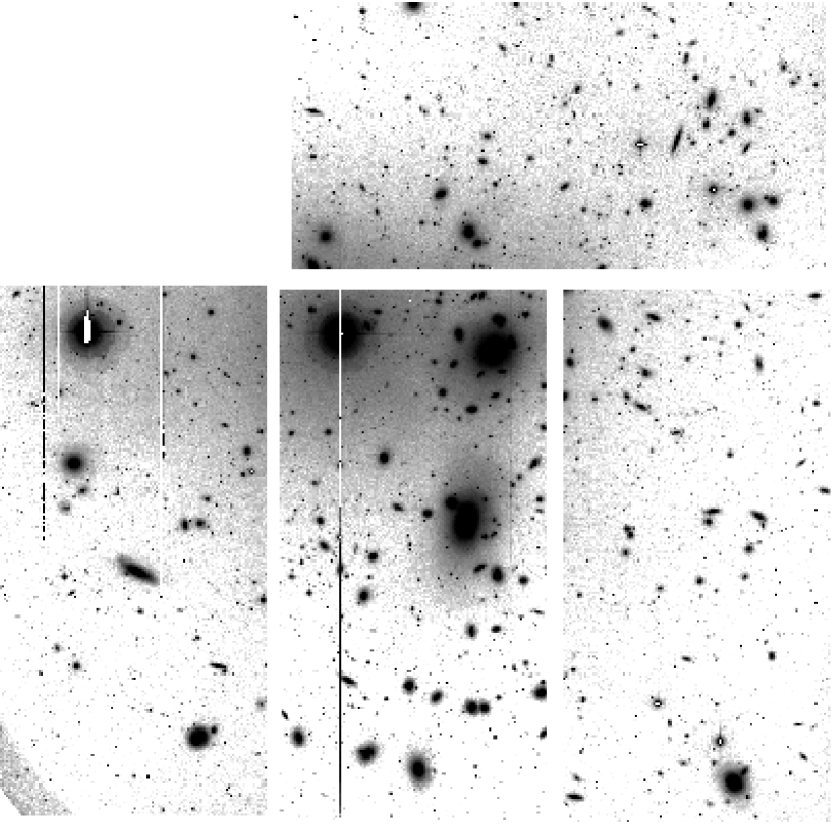
We have performed a quantitative morphological analysis of galaxies in the Coma cluster using a deep image taken in April 2000 with the Wide Field Camera (WFC) at the 2.5 m Isaac Newton Telescope (INT) at the Roque de los Muchachos Observatory. The observations are described in detail in Marín-Franch & Aparicio (2002). Here, we outline the more relevant facts. The image was taken through a Sloan -band filter, with a total exposure time of 3900 s (13300 s). The observations covered the inner 0.28 square degrees of the central part of the cluster (see Fig. 1). Conditions were photometric. We performed a standard data reduction, comprising subtraction of bias, flat field corrections and co-addition of individual exposures. Each chip was calibrated using standard Landolt stars (Landolt 1992). The seeing in the final (combined) image, measured using bright, unsaturated stars, was 1.1 arcsec. The limiting magnitude for these observations was 23.5 mag. The four frames in Fig. 1 correspond to the four (2k 4k) CCDs (with a scale of 0.333 arcsecconds pixel-1) of the WFC. The position of the CCDs in the Camera produces gaps of to arcseconds on the sky.
The magnitudes and colors given in Table 1 (see next Section), were taken from the catalog of Godwin et al. (1983). The recessional velocities are from the compilation by Edwards et al. (2002). These catalogs cover a region of 2.65 square degrees centred on the Coma cluster and largely overlap our observed region. The compilation by Edwards et al. comprises 1174 galaxy redshifts of Coma members, and foreground and background objects. The mean velocity of the Coma cluster is km s-1, and its velocity dispersion is km s-1. Our criterion for membership is the same as the one used by Edwards et al.: Coma members are those objects with velocities in the range km s-1. This range corresponds to a cut on the velocity distribution of the Coma cluster galaxies. With this criterion, the number of Coma members in the above velocity catalog is 745. The sample analyzed in this paper has been selected by magnitude, and includes only six galaxies with unknown redshifts (see next sections), so incompleteness effects are negligible. We select for our structural analysis (see next section) the 187 galaxies with mag.
3 Quantitative morphology
To quantify the properties of each galactic structural component (bulge and disc) we use a parametric model to describe the observed radial profiles. Elliptical galaxies and the bulges of spiral galaxies are modeled with a Sérsic law; discs are described by an exponential profile. The effects of atmospheric blurring on Sérsic profiles (Trujillo et al. 2001b, 2001c) have been taken into account using the algorithm described in Trujillo et al. (2001a; hereafter T01A) and Aguerri & Trujillo (2002). In the case of optical ground based observations, the PSF is dominated by atmospheric blurring and can be approximated by a Gaussian or Moffat function. For the observations presented here, we determined the PSF from the radial profile of bright unsaturated stars in the image; it was found to be well described by a Moffat function with and FWHM=.
The Sérsic (1968) profile can be written as
| (1) |
This law is a generalization of the de Vaucouleurs (1959) profile and has been used widely in recent years as a good description of the profiles of dwarf and giant ellipticals and the bulges of spiral galaxies (see, for example, Caon, Capaccioli, & D’Onofrio 1993; Andredakis, Peletier, & Balcells 1995; Graham & Colless 1997; Balcells et al. 2003). The parameters of the model are the central intensity , the effective radius , and the Sérsic index . The quantity is defined so that the effective radius encloses half of the total luminosity (i.e., is the solution of , where and are the Gamma function and the incomplete Gamma function respectively). The relation between the central intensity and the intensity at the effective radius is given by . Discs were modeled with an exponential profile, such that
| (2) |
where the parameters are the scale length and the central intensity .
We assume projected elliptical symmetry for the bulge and disc, with the ellipticities ( and respectively), in general, different for each component. The observed ellipticity at small radii is of course smaller than the true ellipticity because the seeing tends to make the isophotes rounder. This effect is particularly important for the numerous dwarf galaxies and spiral galaxy bulges with effective radii as small as 2-3 arcseconds. Our algorithm takes this effect into account, and the intrinsic ellipticities for the bulge and the disc are determined simultaneously with the other structural parameters.
We tried to use the minimum number of components (i.e. parameters), so we proceeded as follows. Every galaxy’s major-axis surface brightness and ellipticity profile, generated using the iraf task ELLIPSE, were simultaneously fitted with a two component model (bulge plus disc). The total flux of both components is computed by using the Sérsic analytical expressions extrapolated to infinity. For those objects in which we obtained a bulge-to-total luminosity ratio , we checked if it was possible to obtain a good fit (i.e., with a reduced chi-square value as small or smaller than in the two component case) with just a bulge component. When that was the case, we considered the object to be an elliptical galaxy
Using Monte Carlo simulations we have determined the uncertainty in the computed parameters. Details of how these simulations are constructed can be found in T01A and in Aguerri & Trujillo (2002). We created 150 artificial galaxies with structural parameters randomly distributed in the following intervals:
-
•
bulge–only structures: 13 mag mag, 1, , and (the lower limit of is due to the physical restrictions pointed out by Trujillo et al. 2001b).
-
•
bulge+disc structures: mag mag, , , , , , and .
A variety of starting parameters were used to ensure that our fits did not get trapped in local minima. From these simulations we find that the bulge and disc parameters (we include here the intrinsic ellipticity of each component) can be determined with an accuracy of % for galaxies with . Our structural analysis was therefore carried out only on the 187 galaxies brighter than mag; the results are presented in Table 1. Of these 187 galaxies, 163 have recessional velocities between 4,000 and 10,000 km s-1; for 32 of these, the parameters could not be measured with sufficient accuracy for various reasons, such as proximity to bright stars, uncertain deblending, bad columns of the detector, etc. These galaxies are flagged with a negative sign preceding their ratio. This group also includes galaxies which are irregular or peculiar. Also, because the structure of cD galaxies (NGC 4874 and NGC 4889) is poorly understood, these galaxies will also be excluded. The analysis presented in the following sections will be restricted to the 129 regular galaxies belonging to Coma and having reliable parameters.
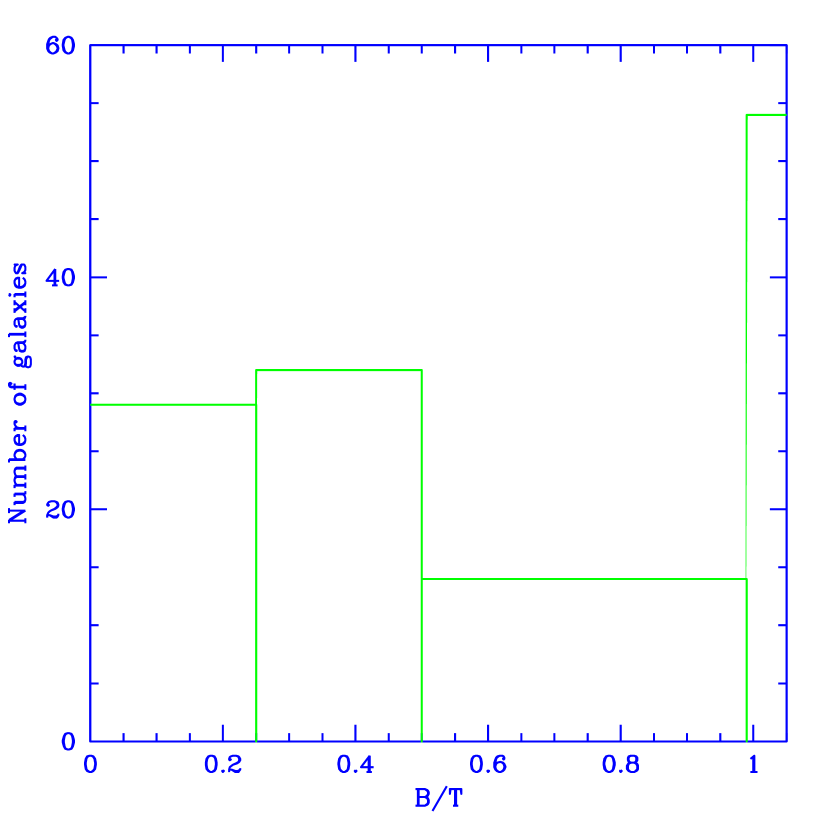
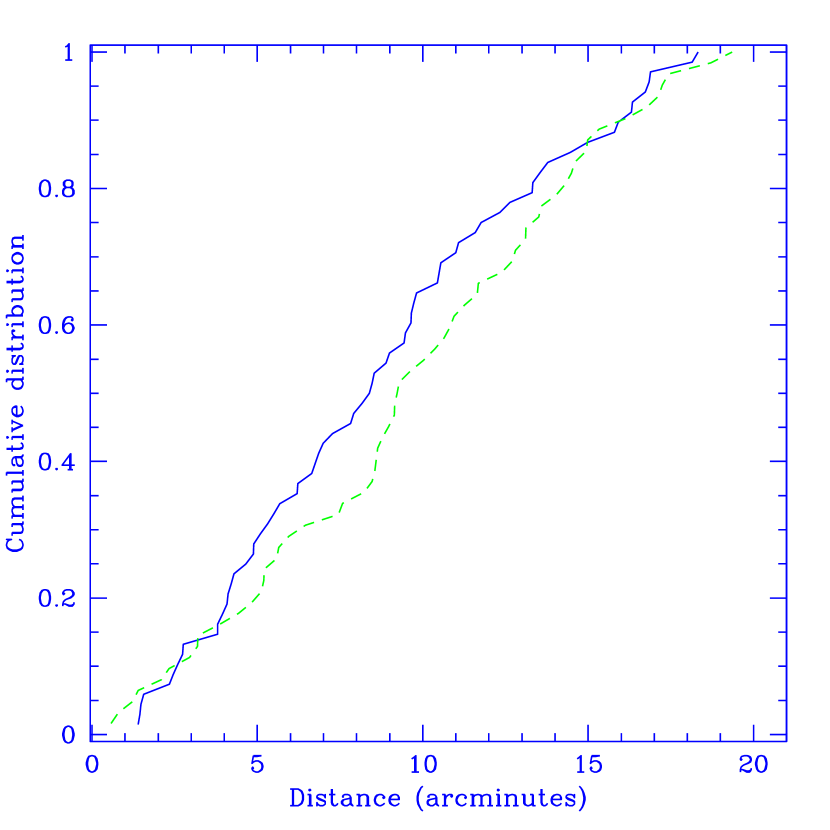
Following the notation and taxonomy discussed in T01A, we have differentiated the galaxies according to the bulge-to-total luminosity ratio (). We will consider the value as the separation between early (E/S0) and late (S) type galaxies. According to this criterion, 61 galaxies were classified as late-type, and 68 galaxies as early-type. In the early-type group, 14 objects show evidence of discs, while 54 are pure ellipticals. In the text we will often refer to objects that have been modeled with only a bulge component as elliptical galaxies. This does not necesarily imply some specific internal kinematics for these objects. Figure 2 shows a histogram of the values. Figure 3 shows the cumulative distribution of early- and late-types as a function of the distance to the cluster center. Although the figure seems to indicate some evidence for the early-type galaxies to be distributed closer to the center than late-types, a Kolmogorov-Smirnov test shows that this is not statistically significant (similar results were obtained considering the value as the separation between early- and late-type galaxies). A more detailed analysis of this point is presented below.
In Figure 4 we compare the -band magnitudes quoted in the GMP catalog with the galaxy magnitudes derived from our (Sloan- passband) structural parameters. Although the agreement is very good, there is a mag zero-point offset such that our estimates are fainter. This may be due to an offset in the relative calibration or to the existence of a small color term between sloan- and the -band magnitudes. There is, however, no significant magnitude-dependent bias in our estimation of the magnitudes.
3.1 Comparison with previous morphological studies of Coma
Although many studies in the past have been devoted to a morphological analysis of galaxies in the Coma cluster (see references in Section 1), the comparison between the structural parameters derived for individual galaxies from different papers is not straightforward and is often only of a limited nature. Some of the previous studies provide no tables of parameters but present only statistical results (e.g., Gerbal et al. 1997), or the analysis is purely qualitative, or they derive the structural parameters in a model independent way (e.g. Andreon 1996). In our sample we have 54 galaxies in common with Dressler (1980). If we compare the morphological types derived there with those inferred from our ratio, we find good agreement. In a few cases, we classified objects as S0 or spiral galaxies that were classified as pure E by Dressler. This is likely explained as a consequence of the different sensitivities of the two studies (the faint discs we found in some of our objects were not detected by Dressler). For only four galaxies classified by Dressler as S0, and as pure E by us, can the results be considered discrepant. However, this level of discrepancy (% ) is in agreement with the differences expected among classifications by different authors (see Lahav et al. 1995; Andreon & Davoust 1997).
Graham & Guzmán (2003) have analysed a sample of 15 dwarf elliptical galaxies in the Coma cluster imaged with the Hubble Space Telescope, finding that all but two of them have a central point-like component. In principle, ignoring the presence of this central component could affect the determination of the structural parameters of bulges and discs (Balcells et al. 2003). We have checked whether this could be the case for our sample. We have seven objects in common with Graham & Guzmán (2003). Although in our model we have not accounted for a central source, and we used major-axis light-profiles while Graham & Guzmán used geometric-mean light-profiles, the parameters obtained for the galaxies in common are in good agreement. For instance, the typical deviation between estimates of the Sérsic indices is . Only in one case (GMP 3292) the two analyses give significantly different values. Therefore, at least for the dwarf ellipticals in Coma, the presence of nuclear components may not have a large effect on our estimation of their structural parameters.
4 Results and Discussion
4.1 Early-type galaxies
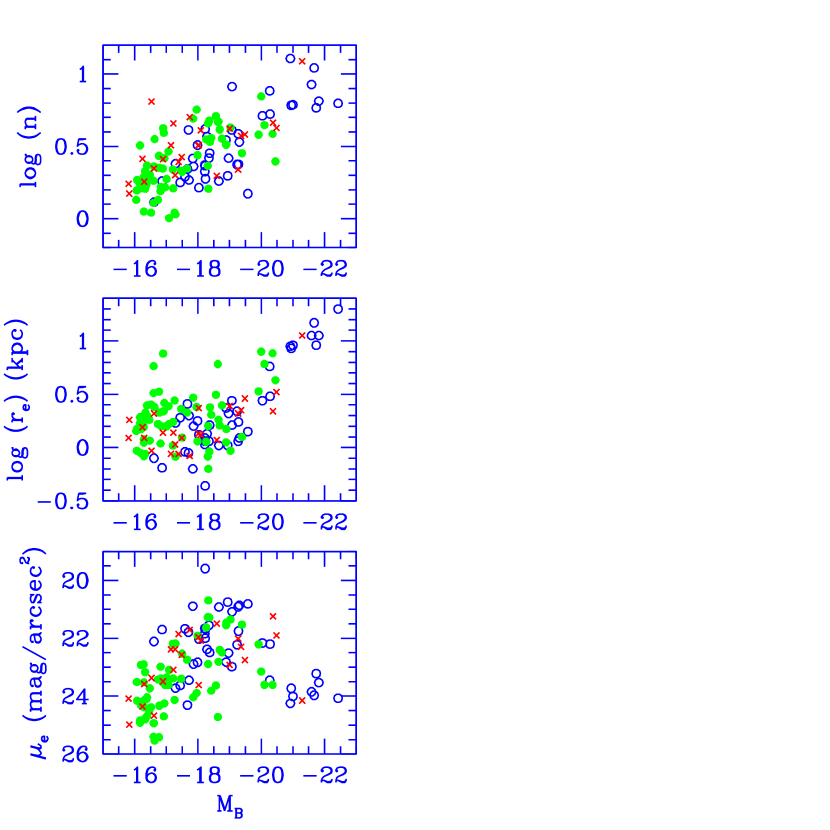
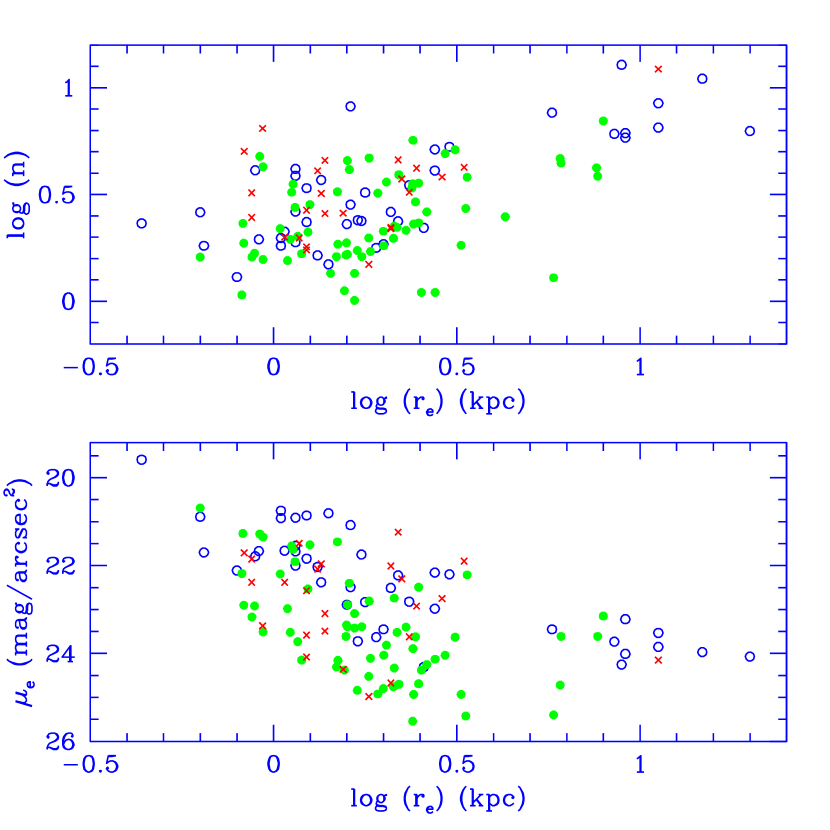
Caon et al. (1993) and D’Onofrio, Capaccioli, & Caon (1994) reported the existence of a correlation between the Sérsic index and the model-independent total luminosity of elliptical galaxiess in the Virgo and Fornax clusters. This correlation has been shown to hold also for the bulges of spirals (Andredakis, Peletier, & Balcells 1995; Graham 2001; Balcells et al. 2003; MacArthur, Courteau, & Holtzman 2003), and also extends to the dwarf elliptical regime (Young & Currie 1994, 1995; Binggeli & Jerjen 1998, Graham & Guzmán 2003). The correlation is such that more luminous bulges tend to have larger values of , their light distributions are more centrally concentrated. . In this section we analyse this and other possible correlations existing among the structural parameters of the galaxies in our sample, and compare the results with previous studies. The study by Caon et al. was conducted in the -band; to make a proper comparison we have converted our surface brightness values obtained in the -band using the color given in Table 1.
Figure 5 shows the relation between the model-independent -band magnitudes from Godwin et al. (1983; we assume ), and the three Sérsic parameters we obtained for the early-type galaxies in our sample. We also plot the data for the galaxies analysed by Caon et al. and D’Onofrio et al. in the Virgo and Fornax clusters. The distributions of the structural parameters of elliptical galaxies in the three clusters are similar, although there are more low-luminosity dwarf ellipticals from Coma delineating the lower arm of this forked distribution (see Graham & Guzmán 2003).
Another way to show the correlations between the three Sérsic parameters is presented in Figure 6. Galaxies from the three clusters exhibit similar values and relations between the parameters. The correlation between the Sérsic index and luminosity (Figure 5) is clear and holds for both the giants and dwarfs. The rough correlation found between and is similar to the one found by Caon et al. (1993) (see also Young & Currie 1995 and Graham et al. 1996). For the spiral galaxies a similar correlation also exists between the bulge index and the bulge-to-total luminosity ratio (Andredakis et al. 1995, Graham et al. 2001; Balcells et al. 2003). Trujillo et al. (2002b) have interpreted this as a consequence of the relation between and the luminosity of the bulges. The main difference between the galaxies in the three clusters is a group of bright galaxies in Virgo which are absent in the core of Coma and the Fornax sample. Objects with similar magnitudes in Coma are the two cD galaxies NGC 4874 and NGC 4889, which have been excluded in this analysis.
For the other two parameters (surface brightness and effective radius) one can distinguish two different regimes, with a transition region at close to the usual limit adopted to separate dwarf and ordinary ellipticals. Traditionally, they have been considered as two separate families of objects, although the exact separation in magnitude between each class is somewhat arbitrary. Edwards et al. (2002) considered dwarf galaxies as objects with mag. This corresponds to M mag. The point here is whether the relation between structural parameters and, therefore, the origin of giants and dwarfs is different and justifies this distinction. Graham & Guzmán (2003) argued that the continuity between , and central bulge surface brightness, with luminosity demonstrates that dwarfs and ordinary ellipticals do not constitute two separate families of objects. They explained the apparently different relations between and luminosity (and and ) for the high- and low-luminosity ellipticals as an expected consequence of the above linear trends.
4.2 Disc galaxies
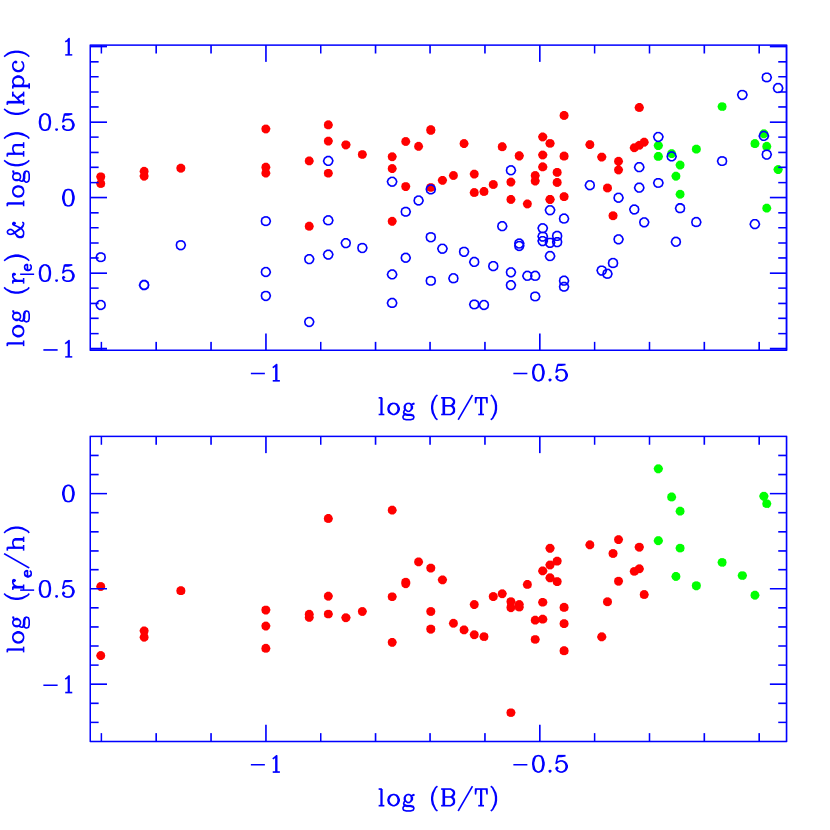
We have characterized the sizes of bulges and discs using the effective radius , and scale length , respectively. Figure 7 shows the relative sizes of bulges and discs for our sample of 14 S0 and 61 spiral galaxies. From these plots we see how the ratio is constant for galaxies with (most of the spirals), with typical values in the range 0.15–0.30. For galaxies with this ratio increases to 0.6 and higher. Three early-type spiral galaxies have values
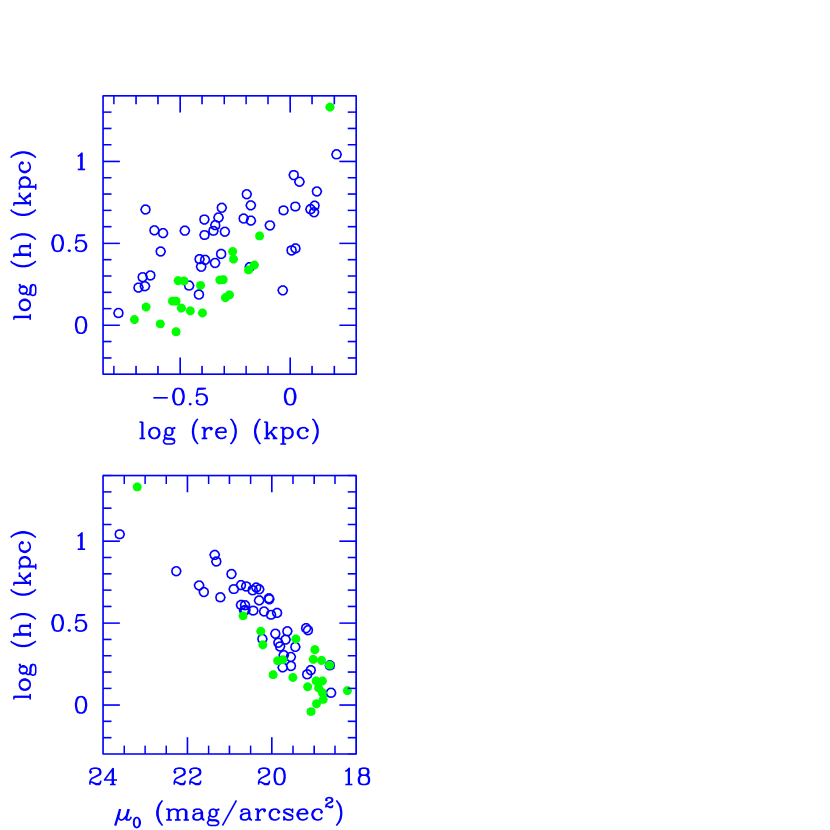
These values are somewhat larger than those obtained for spiral galaxies in the field (Graham 2001, 2003; MacArthur et al. 2003). To better understand the meaning of these results, we have compared the properties of the discs in the field with those in the core of Coma. Disc galaxies brighter than mag are not present in our sample. On the other hand, Graham’s sample is not complete for galaxies fainter than mag, thus we use the common range mag mag. The comparison is presented in Figure 8.
We obtained mean values of =0.24 for Coma and 0.17 for Graham’s sample. A Kolmogorov-Smirnov test rejects the hypothesis that the two distributions are the same at %. Applying Student’s t-test, the mean values of in both distributions are different at the 99.9 % level (assuming the two distributions have unequal variances). The larger average value of for galaxies in the denser environment of the Coma cluster is compatible with the idea that the discs of spiral galaxies in the center of clusters are smaller than the discs of field galaxies with similar magnitudes and bulges. In fact, if we assume that the sizes of the bulges are less affected by the enviroment than the size of the disc, we can estimate that the discs of the galaxies in the center of the cluster have 30% smaller scale-lengths. Aguerri et al. (2003) have found similar results from a study of the morphology of galaxies in a larger region of the Coma cluster. The reduction in the sizes of the discs is in agreement with what is expected in high density enviroments. In these enviroments tidal forces play a crucial role truncating and heating the infalling disc galaxies (Moore et al. 1999, Gnedin 2003). This could also be explained if the suppression of star formation, as has been proposed by Balogh, Navarro, & Morris (2000), is more effective in the outer parts of the (cluster) spiral galaxies. As expected, due to the smaller values of but similar luminosities, we find that in the plane (Figure 8) cluster disc galaxies tend to have brighter central surface brightnesses.
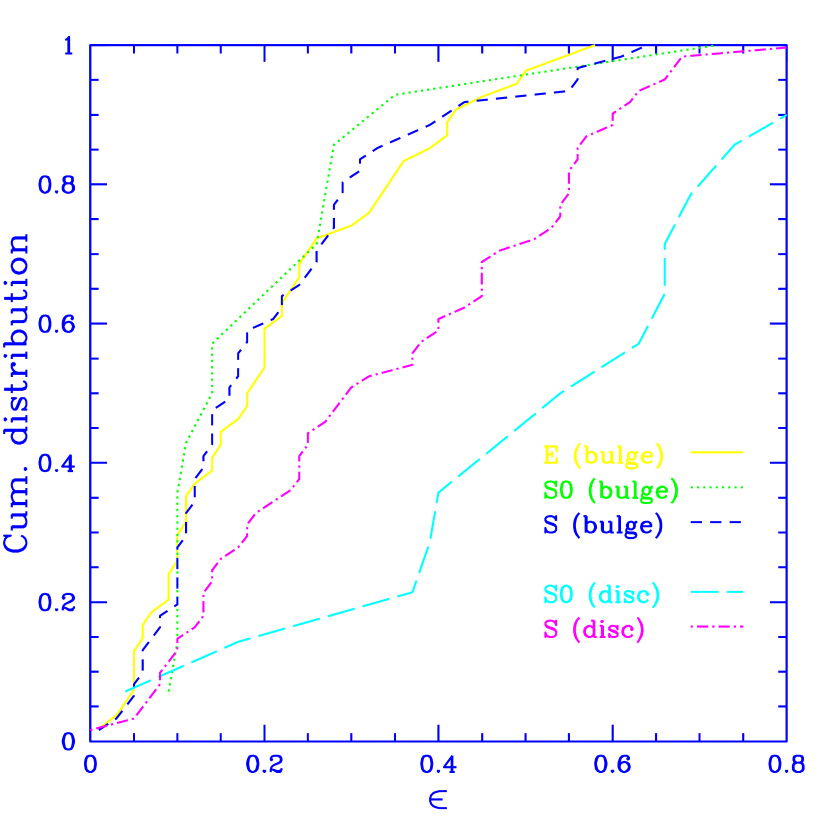
4.3 Ellipticities
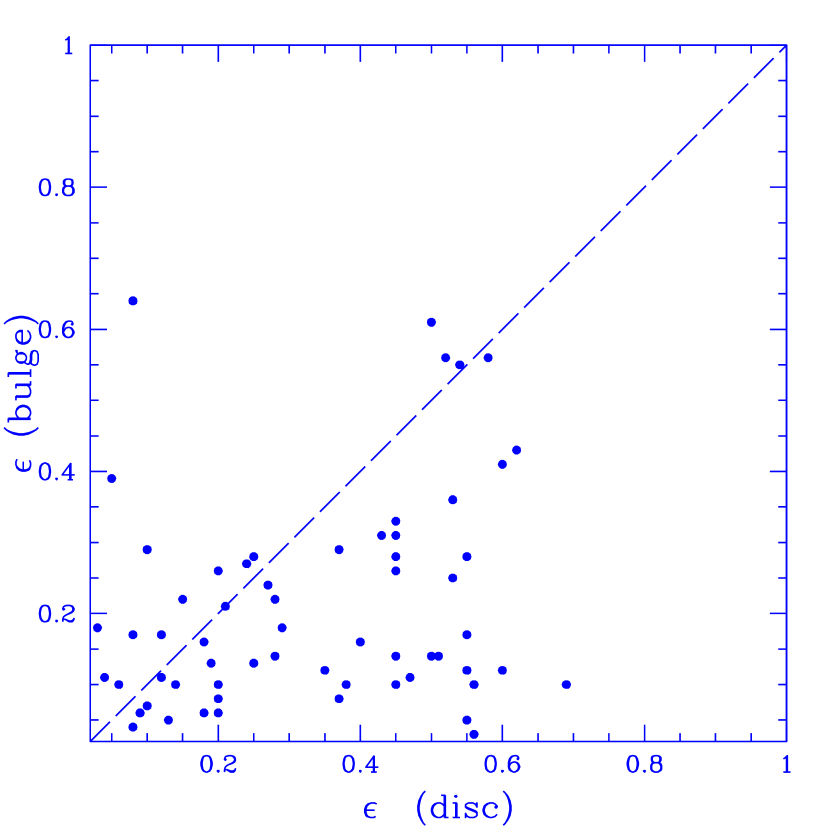
Figure 9 shows the seeing-corrected, projected ellipticities for the bulges and discs of the galaxies in our sample that have these two component. The ellipticity for a thin disc is related to the inclination angle, , by: . Clearly the ellipticity of discs tends to be higher than those of bulges. Figure 10 shows the cumulative distributions of ellipticities for the different morphological types. Table 2 shows the number of early- and late-type galaxies, together with the mean and standard deviation of the projected ellipticities. The main results are that bulges of all morphological types have ellipticities with a similar distribution, and that the discs of S0s seem to have a slightly different distribution than the late-type galaxies (a Kolmogorov–Smirnov test rejects both distributions being the same at the 86 % confidence level). However, it may simply be a result of small number statistics. This needs to be investigated with a larger sample of S0 galaxies.
Jorgensen & Franx (1994) measured the ellipticities of a volume-limited sample of galaxies in the Coma cluster. However, they simply measured the global ellipticity of the galaxies without disentangling the disc and bulge components. They concluded that S0 galaxies tend to have larger ellipticities than pure ellipticals, and argued that this indicates that some of the faint face-on S0 galaxies were misclassified as E types. On the basis of our own results (Table 2), the differences in ellipticity found by those authors could indeed be due to the differences in ellipticity between the two structural components (bulges and discs).
4.4 Line-of-sight velocity distributions
4.4.1 Coma elliptical galaxies
Studying the velocity distributions of the different morphological types in Coma allows one to test models of the origin and evolution of these types. Previous dynamical analyses of groups and clusters have been conducted by many teams. For instance, Zabludoff & Franx (1993) have analyzed six rich clusters of galaxies; Schindler, Binggeli, & Bohringer (1999) and Conselice, Gallagher, & Wyse (2001) have explored the Virgo cluster; Held & Mould (1997) and Drinkwater, Gregg, & Colless (2001) studied the Fornax cluster; Colless & Dunn (1996) the Coma cluster; and Cote et al. (1997) studied the Centaurus A group. In general, all these works show that late-type galaxies and dwarf ellipticals have broader velocity distributions as compared with giant ellipticals. This has been interpreted as evidence that spiral and dE galaxies are infalling into a virialized core dominated by giant ellipticals.
The Coma cluster is not a simple relaxed cluster: a close examination of its central parts reveals the presence of two groups of galaxies (Fitchett & Webster 1987; Baier, Fritze & Tiersch 1990) dominated by the cD galaxies NGC 4874 and NGC 4889. The analysis of radial velocities by Colless & Dunn (1996) found these two concentrations to be dynamically different entities. A third group, dominated by the galaxy NGC 4839, is located 40′ to the SW of the cluster. Burns et al. (1994) claimed that the group had already been disrupted after its first passage through the cluster, while Colless & Dunn (1996) suggested that this group is falling into Coma along the Great Wall. The Coma cluster is one the brightest extragalactic X-ray sources observed by ROSAT (White et al. 1993), ASCA (Watanabe et al. 1999), and XMM (Briel et al. 2001). In the X-rays images, the cluster appears elongated along the line connecting NGC 4874 and NGC 4889, and numerous lumps and individual sources are visible. Based on these observations, Neumann et al. (2001) discussed the morphology of the NGC 4839 group and concluded that the group is falling into Coma for the first time, in agreement with the scenario proposed by Colless & Dunn (1996). Gurzadyan & Mazure (2001) analysed the substructure of the Coma cluster using an S-tree method and also concluded that three subgroups exist. Furthermore, a study of the small scale structure conducted by Conselice & Gallagher (1998) discovered three additional aggregates, two of them equidistant between NGC 4874 and NGC 4889, and the other near the giant elliptical NGC 4860.
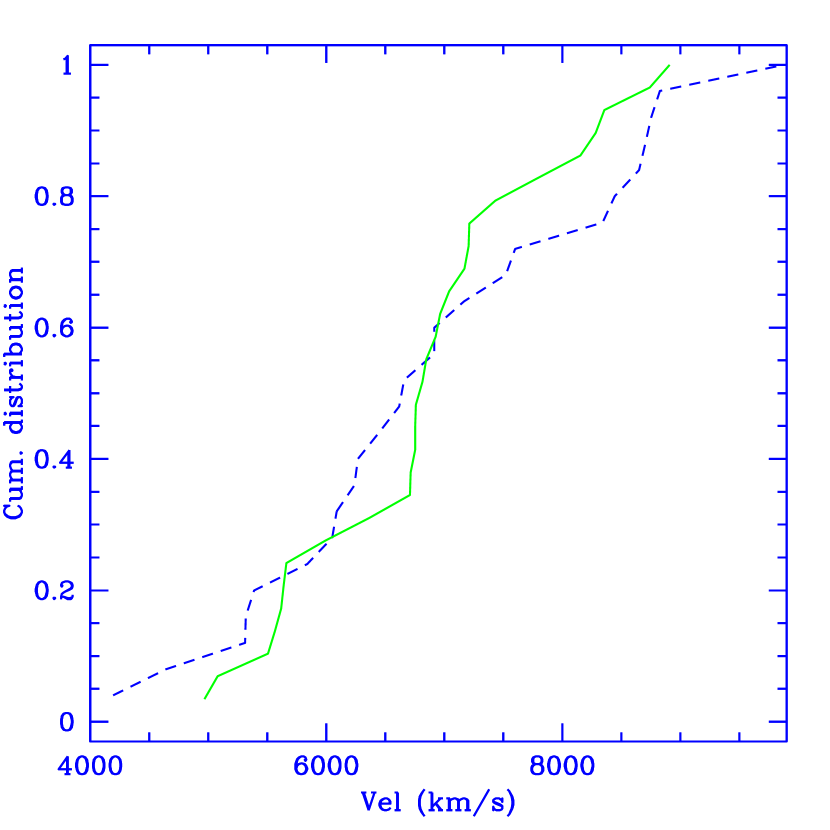
Edwards et al. (2002) have conducted a detailed kinematical study of Coma. Analyzing differences in velocity between the giant and dwarf galaxies (based on whether they are brighter or fainter than mag), they found that the giants follow a non-Gaussian distribution in velocity, while the distribution of the dwarfs is compatible with a Gaussian. While we use the same compilation of redshifts, our quantitative morphological analysis allows us to study the motions of the galaxies as a function of their structural parameters. The velocity distributions for ellipticals with (dwarfs) and (giants) are shown in Fig. 12. Both distributions are symmetric with respect to the systemic velocity of the cluster. The distribution for galaxies with is narrower and shows a larger number of galaxies with velocities close to the cluster systemic velocity. This could indicate a concentration of galaxies with in the central parts of the cluster, in agreement with previous findings that dwarf galaxies are less concentrated than bright galaxies in Coma (Quintana 1979). Similar results have been found for the Fornax cluster (e.g., Caldwell 1987; Drinkwater et al. 2001), the cluster AC118 at (Andreon 2002), and for a sample of other clusters between and (Adami et al. 2001). Table 3 summarizes this analysis showing the mean velocity (and dispersion) obtained for the different types of galaxies discussed above.
A Kolmogorov–Smirnov test applied to the velocity distributions of E galaxies with and shows some evidence (70% of confidence level) for the two distributions being different. Table 3 shows that the ratio between cluster velocity dispersion for these galaxies is . Edwards et al. also found a slightly larger dispersion for dwarf than for giant galaxies (1096 45 and 30 km s-1 respectively) in Coma.
If the central 0.28 square degrees of the Coma cluster were fully relaxed, by dynamical relaxation (Binney & Tremaine, 1987), this should correspond to mass ratios between the two groups of galaxies . Assuming a similar mass-to-light ratio for all the ellipticals, this would imply a mean difference in magnitude between both groups , which is smaller than the actual difference (2.4 mag). For instance, Edwards et al. have performed Monte Carlo simulation of the velocities in a cluster fully relaxed, finding that the ratio between the velocity dispersion for dwarfs and giants should be . Edwards et al. argued that the differences in velocity between the two groups of ellipticals are the result of the merging of subclusters which were partially relaxed. In the particular case of the Coma cluster, this could be supported also by the large scale distribution of the groups associated to NGC 4874 and NGC 4889 respectively.
4.4.2 Background galaxies
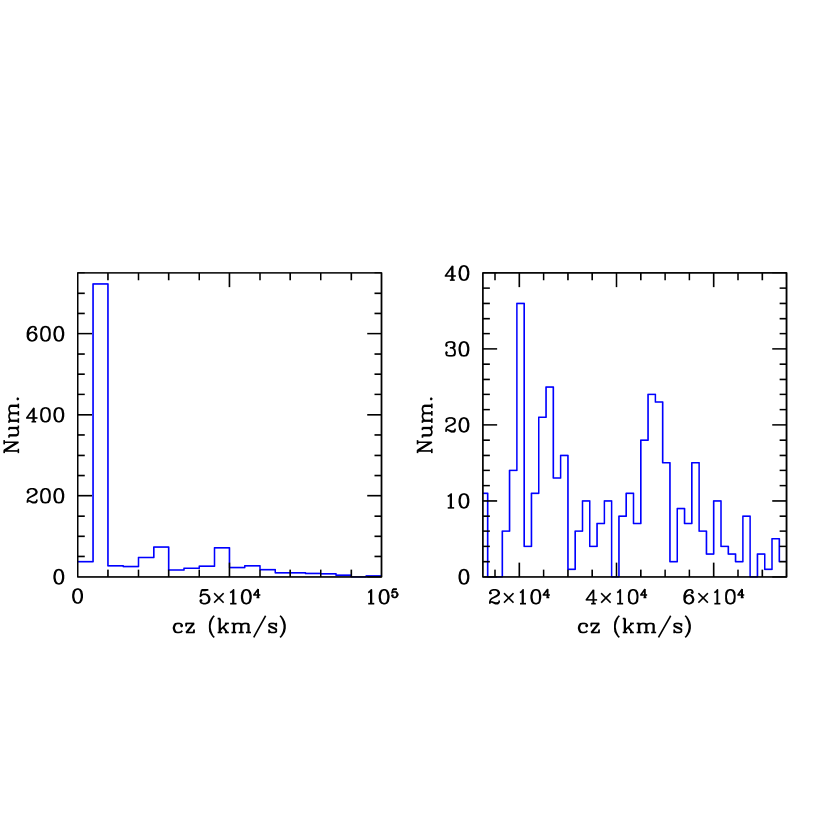
In the compilation of redshifts by Edwards et al. (2002) there are 745 Coma members; the rest are 421 background and 15 foreground objects. Figure 11 shows a histogram with the distribution of redshifts in this catalog. The diagram on the left is dominated by a big bump at km s-1, which corresponds to the Coma cluster. There are two other concentrations at higher redshift, peaked at and km s-1; these can be seen in more detail in the diagram on the right of Figure 11. The contrast in galaxy density between these structures and the average density distribution is . Figure 11 also shows a low density region from 10,000 km s-1 to 20,000 km s-1 that has been discussed in Lindner et al. (1995).
As the limiting magnitude of the sample with measured redshifts is unclear, it is not possible to make a comparison with the values reported by Arnouts et al. (1997) for the expected density of galaxies in the field. The range of velocities in both of the high-density structures beyond Coma are too high for those expected from a typical cluster; however, both structures show evidence of substructure within them. The closer concentration can be split into two substructures, one at and the other at km s-1, both having velocity dispersion km s-1. Although it is difficult to appreciate in the figure, we tentatively identify in the more distant concentration of galaxies two overlapping structures at and km s-1, with dispersions of and km s-1 respectively. It is interesting to note that both structures seem to extend over the full spatial region ( square degrees) of the velocity catalog without a clear spatial concentration; they subtend angles much larger than those expected for a cluster at these redshifts. For instance, a typical cluster with size of 1 Mpc would subtend an angle of arcminutes at km s-1. The three dimensional structure of the background galaxies therefore resembles large, low density regions (voids) separated by thin walls.
5 Summary
-
1.
We have determined the morphological types and structural parameters of 187 galaxies in the central part of the Coma cluster (0.28 square degrees). The analysis extends down to mag. The results of our quantitative-based ( ratio) galaxy type determinations are in good agreement with previous subjective classifications.
-
2.
We have shown various correlations between the surface brightness, effective radius, luminosity, and the Sérsic shape index for ellipticals and the bulges of spirals. All results are in agreement with past studies of elliptical galaxies in the Virgo and the Fornax cluster. The strongest correlation that between the Sérsic index, , and luminosity.
-
3.
The bulges of all morphological types show a similar distribution of projected ellipticities, while there is marginal evidence that the discs of S0 and spirals have different projected-ellipticity distributions.
-
4.
We have not found bright spiral galaxies ( mag) in the core of Coma. In the magnitude interval , the scale length of the discs of Coma spiral galaxies are 30% smaller than for field galaxies. This may be evidence of environment-driven evolution.
References
- (1) Adami, C., Mazure, A., Ulmer, M. P., & Savine, C. 2001, A&A, 371, 11
- (2) Aguerri, J. A. L., & Trujillo, I., 2002, MNRAS, 333, 633
- (3) Aguerri, J. A. L., Iglesias-Páramo, J., Vílchez, J. M. & Muñoz-Tuñón, C., 2003, in preparation
- (4) Andredakis, Y. C., Peletier, R. F., & Balcells, M. 1995, MNRAS, 275, 874 1995
- (5) Andreon, S. 1996, A&A, 314, 763
- (6) Andreon, S., Davoust, E., & Poulain, T. 1997, A&AS, 126, 67
- (7) Andreon, S., Davoust, E., Michard, R., Nieto, J.-L., & Poulain, T. 1995, A&AS, 116, 429
- (8) Andreon, S., & Davoust, E. 1997, A&A, 319, 747
- (9) Arnouts, S., de Lapparent, V., Mathez, G., Mazure, A., Mellier, Y., Bertin, E. & Kruszewski, A. 1997
- (10) Baier, F. W., Fritze, K., & Tiersch, H. 1990, AN, 311, 89
- (11) Balcells, M., Graham, A. W., Domínguez-Palmero, L., & Peletier, R. F. 2003, ApJ, 582L, 79
- (12) Balogh, M. L., Navarro, J. F., & Morris, S. L. 2000, ApJ, 540, 113
- (13) Beijersbergen, M., Hoekstra, H., van Dokkum, P. G., & van der Hulst, T. 2002, MNRAS, 329, 385
- (14) Bernstein, G. M., Nichol, R. C., Tyson, J. A., Ulmer, M. P., & Wittmann, D. 1995, AJ, 110, 1507
- (15) Binggeli, B., & Jerjen, H. 1998, A&A, 333, 17
- (16) Binney, J. & Tremaine, S. 1987, Galactic Dynamics (Princeton: Princeton Univ. Press)
- (17) Briel, U. G. 2001 et al. 2001, A&A, 365, L60
- (18) Burns, J. O., Roettiger, K., Ledlow, M., & Klypin, A. 1994, ApJ, 427, L87
- (19) Caldwell, N. 1987, AJ, 94, 1116
- (20) Caon, N., Capaccioli, M., & D’Onofrio, M. 1993, MNRAS, 265, 1013
- (21) Castander, F. J. et al. 2001, AJ, 121, 5
- (22) Cellone, S. A., Forte, J. C., & Geisler, D. 1994, AJSS, 93, 397
- (23) Colless, M., & Dunn, A. M. 1996, ApJ, 458, 435
- (24) Conselice, C. J., & Gallagher, J. S. III 1998, MNRAS, 297, 34
- (25) Conselice, C. J., Gallagher, J. S. III, & Wyse, R. F. G. 2001, ApJ, 559, 791
- (26) Cote, S., Freeman, K. C., Carignan, C., & Quinn, P. J. 1997, AJ, 114, 1313
- (27) de Jong, R. S. 1996, A&AS, 118, 557
- (28) D’Onofrio, M., Capaccioli, M., & Caon, N. 1994, MNRAS, 271, 523
- (29) Dressler, A. 1980, ApJSS, 42, 565
- (30) Drinkwater, M. J., Gregg, M. J., & Colless, M. 2001, ApJ, 548, L39
- (31) Edwards, S. A., Colless, M., Bridges, T. J., Carter, D., Mobasher, B., & Poggianti, B. M. 2002, ApJ, 567, 178
- (32) Fitchett, M., & Webster, R. 1987, ApJ, 317, 653
- (33) Gallagher, J. S., Conselice, C. J., & Wise, R. F. G. 2001, in ”Dwarf Galaxies and their environment”. Edited by Klaas S. De Boer, Ralf-Juergen Dettmar, and Uli Klein. ISBN 3826592646, p. 213
- (34) Gavazzi, G., Zibetti, S., Boselli, A., Franzetti, P., Scodeggio, M., & Martocchi, S. 2001, A&A, 372, 29
- (35) Gerbal, D., Lima-Neto, G. B., Marquez, I., & Verhagen, H. 1997, MNRAS, 285, L41
- (36) Gnedin, O., 2003, ApJ, in press
- (37) Godwin, J. G., Metcalfe, N., & Peach, J. V. 1983, MNRAS, 202, 113
- (38) Graham, A. W. 2001, AJ, 121, 820
- (39) Graham, A. W. 2003, AJ, 125, 3398
- (40) Graham, A.W., & Colless, M.M. 1997, MNRAS, 287, 221
- (41) Graham, A., Guzmán, R. 2003, AJ, 125, 2936
- (42) Graham, A., Lauer, T. R., Colless, M., & Postman, M. 1996, ApJ, 465, 534
- (43) Gurzadyan, V. G., & Mazure, A. 2001, New astronomy, 6, 43
- (44) Held, V. E., & Mould, J. R. 1994, AJ, 107, 1307
- (45) Jorgensen, I., & Franx, M. 1994, ApJ, 433, 553
- (46) Karachentsev, I. D., Karachentsev, V. E., Richter, G. M., & Vennik, J. A. 1995, A&A, 296, 643
- (47) Kashikawa, N. et al. 1998, ApJ, 500, 750
- (48) Kashikawa, N., Shimasaku, K., Yagi, M., Yasuda, N., Doi, M., & Okamura, S. 1995, ApJ, 452, L99
- (49) Khosroshahi, H. G., Wadadekar, Y., Kembhavi, A., & Mobasher, B. 2000, ApJ, 531, L103
- (50) Komiyama, Y. et al. 2002, ApJS, 138, 265
- (51) Lahav, O., et al. 1995, Sci, 267, 859
- (52) Lindner, U., Einasto, J., Einasto, M., Freudling, W., Fricke, K., & Tago, E. 1995, A&A, 301, 329
- (53) Lobo, C., Biviano, A., Durret, F., Gerbal, D., Le Fevre, O., Mazure, A., & Slezak, E. 1997, A&ASS, 122, 409
- (54) Lucey, J. R., Guzmán, R., Carter, D., & Terlevich, R. J. 1991, MNRAS, 253, 584
- (55) MacArthur, L.,A. Courteau, S., & Holtzman, J. A. 2003, ApJ, 582, 689
- (56) Marín-Franch, A., & Aparicio, A. 2002, ApJ, 568, L74
- (57) Mehlert, D., Saglia, R. P¿, Bender, R., & Wegner, G. 2000, A&AS, 141, 449
- (58) Mobasher, B. et al. 2001, ApJS, 137, 279
- (59) Mobasher, B., Guzmán, R., Aragon-Salamanca, A., & Zepf, S. 1999, MNRAS, 304, 225
- (60) Moore, B., Lake, G., Quinn, T., & Stadel, J., 1999, MNRAS, 304, 465
- (61) Neumann, D. M. et al. 2001, AA, 365, L74
- (62) Pahre, M. 1999, ApJSS, 124, 127
- (63) Quintana, H. 1979, AJ, 84, 15
- (64) Rood, H. J., & Baum, W. A. 1967, AJ, 72, 398
- (65) Schindler, S., Binggeli, B., & Bohringer, H. 1999, A&A, 343, 420
- (66) Secker, J. Harris, W. E. 1997, PASP, 109, 1364
- (67) Sérsic, J. L. 1968, Atlas de galaxias australes, Córdoba, Argentina: Observatorio Astronómico
- (68) Terlevich, A. I., Caldwell, N., & Bower, R. G. 2001, MNRAS, 326, 1547
- (69) Trentham, N. 1998, MNRAS, 293, 71
- (70) Trujillo, I., Aguerri, J. A. L., Gutiérrez, C. M., & Cepa, J. 2001a, AJ, 122, 38 (T01A)
- (71) Trujillo, I., Aguerri, J. A. L., Cepa, J., & Gutiérrez, C. M. 2001c, MNRAS, 328, 977
- (72) Trujillo, I., Aguerri, J. A. L., Cepa, J., & Gutiérrez, C. M. 2001b, MNRAS, 321, 269
- (73) Trujillo, I., Aguerri, J. A. L., Gutiérrez, C. M., Caon, N. & Cepa, J. 2002a, ApJ, 573, L9 (T02A)
- (74) Trujillo, I., Asensio Ramos, A., Rubino-Martin, J. A., Graham, A. W., Aguerri, J. A. L., Cepa, J., & Gutierrez, C. M. 2002b, MNRAS, 333, 510
- (75) White, S., Briel, U. G., & Henry, J. P. 1993, MNRAS, 261, L8
- (76) Watanabe, M., Yamashita, K., Furuzawa, A., Kunieda, H., Tawara, Y., & Honda, H. 1999, ApJ, 527, 80
- (77) Young, C. K., & Currie, M. J. 1994, MNRAS, 268, L11
- (78) Young, C. K., & Currie, M. J. 1995, MNRAS, 273, 1141
- (79) Zabludoff, A. I., & Franx, M. 1993, AJ, 106, 1314
| GMP | B | B-R | v | X | Y | n | h | B/T | ||||||
| 2347 | D098 | 15.85 | 1.91 | 6848 | 16.90 | -4.27 | 18.04 | 0.70 | 1.29 | 0.11 | 18.82 | 4.22 | 0.47 | 0.17 |
| 2374 | N4911 D082 | 13.91 | 1.67 | 7987 | 16.15 | -10.85 | 18.63 | 1.10 | 2.24 | 0.08 | 19.37 | 9.25 | 0.44 | -0.11 |
| 2376 | 18.23 | 1.77 | 6049 | 16.15 | -4.36 | 23.16 | 6.70 | 1.83 | 0.45 | 1.00 | ||||
| 2385 | 17.62 | 1.82 | 7040 | 5.90 | -7.74 | 20.37 | 2.15 | 2.19 | 0.25 | 1.00 | ||||
| 2390 | IC4051 D143 | 14.47 | 1.82 | 4968 | 5.82 | 2.19 | 21.79 | 15.80 | 3.86 | 0.36 | 1.00 | |||
| 2393 | D062 | 16.51 | 1.90 | 8302 | 5.75 | -11.25 | 20.99 | 3.28 | 4.56 | 0.27 | 21.04 | 7.53 | 0.74 | 0.68 |
| 2399 | 18.78 | 9.99 | 5837 | 5.68 | -0.15 | 22.09 | 2.95 | 1.35 | 0.32 | 1.00 | ||||
| 2408 | 18.49 | 1.73 | 5.46 | -8.72 | 22.97 | 3.15 | 0.83 | 0.45 | 23.71 | 7.90 | 0.61 | 0.43 | ||
| 2417 | N4908 D167 | 14.91 | 1.87 | 8742 | 5.17 | 4.34 | 20.34 | 6.96 | 3.81 | 0.34 | 1.00 | |||
| 2421 | 17.98 | 1.90 | 8150 | 5.10 | -13.68 | 22.01 | 1.83 | 1.17 | 0.25 | 20.96 | 4.18 | 0.53 | 0.19 | |
| 2440 | IC4045 D168 | 15.17 | 1.85 | 6899 | 4.54 | 7.18 | 21.05 | 1.83 | 1.68 | 0.30 | -1.00 | |||
| 2441 | N4907 D205 | 14.65 | 1.74 | 5773 | 4.51 | 11.23 | 19.71 | 2.01 | 3.20 | 0.11 | 19.35 | 8.86 | 0.06 | -0.10 |
| 2457 | D117 | 16.56 | 1.88 | 8604 | 4.27 | -2.94 | 18.48 | 0.66 | 1.28 | 0.29 | 18.95 | 3.10 | 0.46 | -0.16 |
| 2478 | 18.09 | 1.86 | 8752 | 3.84 | -8.13 | 21.56 | 3.43 | 1.35 | 0.41 | 1.00 | ||||
| 2489 | D191 | 16.69 | 1.77 | 6582 | 3.65 | 7.78 | 18.02 | 0.66 | 0.79 | 0.28 | 18.48 | 2.74 | 0.55 | 0.20 |
| 2510 | D116 | 16.13 | 1.90 | 8353 | 3.24 | -0.47 | 19.11 | 1.44 | 2.31 | 0.15 | 19.92 | 4.51 | 0.30 | -0.41 |
| 2516 | IC4042 D144 | 15.34 | 1.86 | 6354 | 3.19 | 0.03 | 19.84 | 3.68 | 3.62 | 0.16 | 23.19 | 51.89 | 0.18 | 0.28 |
| 2519 | 18.68 | 1.72 | 6216 | 3.21 | 8.72 | 22.15 | 1.24 | 1.76 | 0.21 | 22.44 | 5.55 | 0.21 | 0.14 | |
| 2529 | 18.63 | 1.87 | 8826 | 2.89 | 4.45 | 21.05 | 1.83 | 1.68 | 0.10 | 1.00 | ||||
| 2531 | 17.63 | 1.70 | 18442 | 2.89 | -4.55 | 22.77 | 0.96 | 11.43 | 0.31 | 20.14 | 3.53 | 0.23 | -0.03 | |
| 2535 | IC4041 D145 | 15.93 | 1.90 | 7059 | 2.82 | 1.54 | 19.32 | 1.65 | 1.87 | 0.20 | 19.39 | 4.61 | 0.49 | -0.35 |
| 2541 | N4906 D118 | 15.44 | 1.98 | 7497 | 2.54 | -2.82 | 19.55 | 2.59 | 2.84 | 0.20 | 19.86 | 4.58 | 0.04 | 0.52 |
| 2559 | IC4040 D169 | 15.44 | 9.99 | 7801 | 2.08 | 5.25 | 23.00 | 3.49 | 2.41 | 0.12 | 18.68 | 4.72 | 0.83 | 0.13 |
| 2584 | D192 | 16.14 | 1.79 | 5465 | 1.63 | 10.52 | 20.28 | 1.10 | 5.90 | 0.05 | 18.63 | 4.91 | 0.68 | 0.12 |
| 2585 | 18.44 | 1.73 | 6914 | 1.62 | -1.69 | 22.31 | 4.12 | 1.82 | 0.41 | 1.00 | ||||
| 2591 | D051 | 18.50 | 1.86 | 8356 | 1.41 | -2.17 | 22.94 | 4.11 | 2.13 | 0.09 | 1.00 | |||
| 2603 | 17.36 | 1.80 | 8152 | 1.17 | -8.81 | 21.60 | 4.74 | 2.15 | 0.50 | 1.00 | ||||
| 2615 | D063 | 16.97 | 1.90 | 6679 | 0.99 | -12.29 | 19.30 | 0.90 | 1.02 | 0.24 | 19.74 | 3.46 | 0.33 | -0.18 |
| 2619 | 18.38 | 1.71 | 6279 | 0.97 | 17.10 | 22.16 | 1.19 | 1.04 | 0.27 | 21.21 | 3.85 | 0.24 | 0.07 | |
| 2633 | 18.48 | 1.75 | -359 | 0.48 | 11.37 | 20.78 | 0.63 | 2.38 | 0.37 | 20.37 | 2.30 | 0.34 | 0.12 | |
| 2651 | D147 | 16.19 | 1.85 | 7700 | 0.07 | 0.08 | 19.44 | 1.42 | 2.33 | 0.39 | 19.82 | 5.53 | 0.54 | -0.26 |
| 2654 | D119 | 16.38 | 1.90 | 6984 | 9.98 | -0.90 | 17.90 | 0.73 | 1.79 | 0.08 | 19.86 | 4.12 | 0.37 | 0.41 |
| 2692 | 18.20 | 1.78 | 7962 | 9.28 | -2.66 | 23.76 | 4.94 | 3.55 | 0.14 | 20.89 | 3.66 | 0.66 | 0.52 | |
| 2711 | 18.90 | 9.99 | 19792 | 8.90 | 14.20 | 19.49 | 0.60 | 1.96 | 0.21 | 1.00 | ||||
| 2727 | IC4026 D170 | 15.73 | 1.77 | 8161 | 8.69 | 4.56 | 18.52 | 1.10 | 1.76 | 0.15 | 19.43 | 4.20 | 0.20 | -0.29 |
| 2728 | 18.15 | 1.73 | 7965 | 8.70 | 16.57 | 20.21 | 0.38 | 1.52 | 0.10 | 19.53 | 2.69 | 0.56 | 0.05 | |
| 2736 | 18.21 | 1.76 | 4869 | 8.59 | -4.34 | 19.84 | 0.63 | 0.62 | 0.28 | 20.37 | 2.19 | 0.25 | 0.17 | |
| 2753 | 18.10 | 1.86 | 7767 | 8.26 | -7.65 | 21.40 | 2.33 | 0.90 | 0.22 | 22.06 | 4.45 | 0.23 | 0.48 | |
| 2777 | 18.21 | 1.71 | 6202 | 7.97 | 2.30 | 19.17 | 0.74 | 2.64 | 0.06 | -1.00 | ||||
| 2778 | 16.69 | 1.81 | 5122 | 7.95 | -2.03 | 20.43 | 1.08 | 1.25 | 0.38 | 19.27 | 2.86 | 0.05 | -0.06 | |
| 2783 | 17.37 | 1.83 | 5318 | 7.90 | -9.33 | 23.13 | 8.44 | 2.64 | 0.08 | -1.00 | ||||
| 2784 | 18.36 | 1.81 | 7838 | 7.90 | 7.57 | 21.38 | 1.64 | 0.97 | 0.13 | 22.05 | 4.54 | 0.19 | 0.33 | |
| 2787 | 18.46 | 1.65 | 9873 | 7.85 | 5.30 | 22.46 | 3.79 | 1.71 | 0.15 | 1.00 | ||||
| 2795 | N4895 D206 | 14.38 | 9.99 | 8469 | 7.76 | 13.89 | 20.19 | 8.84 | 2.49 | 0.10 | 21.20 | 23.80 | 0.69 | 0.74 |
| 2799 | 18.70 | 9.99 | 6136 | 7.70 | 1.00 | 21.27 | 1.39 | 1.73 | 0.07 | -1.00 | ||||
| 2800 | 18.38 | 9.99 | 7015 | 7.70 | -11.19 | 22.77 | 1.78 | 1.80 | 0.05 | 22.37 | 5.19 | 0.13 | 0.18 | |
| 2815 | N4894 D122 | 15.87 | 1.74 | 4636 | 7.45 | -0.20 | 17.96 | 0.73 | 1.52 | 0.12 | 19.15 | 4.25 | 0.60 | 0.31 |
| 2839 | IC4021 D172 | 16.01 | 1.75 | 5724 | 7.06 | 4.22 | 17.37 | 0.69 | 1.56 | 0.22 | 18.94 | 2.73 | 0.10 | 0.35 |
| 2852 | 17.80 | 1.79 | 7405 | 6.81 | -6.22 | 21.00 | 0.88 | 1.49 | 0.29 | 20.78 | 3.04 | 0.24 | 0.13 | |
| 2856 | 18.23 | 1.57 | 8134 | 6.77 | 4.94 | 23.83 | 11.98 | 1.29 | 0.72 | 18.96 | 1.63 | 0.92 | 0.82 | |
| 2861 | D173 | 16.26 | 1.85 | 7511 | 6.65 | 6.27 | 18.88 | 1.42 | 2.20 | 0.12 | 20.21 | 4.81 | 0.28 | 0.49 |
| 2866 | D064 | 16.90 | 1.79 | 7030 | 6.59 | -11.34 | 20.69 | 1.84 | 2.61 | 0.11 | 21.49 | 4.71 | 0.05 | 0.47 |
| 2895 | 18.64 | 2.04 | 26236 | 6.05 | -0.77 | 21.78 | 0.69 | 0.83 | 0.28 | 20.17 | 2.10 | 0.56 | 0.06 | |
| 2897 | D099 | 16.98 | 1.53 | 9889 | 6.00 | -6.42 | 21.67 | 2.03 | 5.37 | 0.64 | 19.89 | 2.48 | 0.08 | 0.17 |
| 2910 | D100 | 16.25 | 1.41 | 5136 | 5.78 | -6.28 | 20.58 | 3.54 | 1.82 | 0.30 | -1.00 | |||
| 2912 | N4895A D207 | 16.07 | 1.80 | 6752 | 5.82 | 11.97 | 20.69 | 5.13 | 3.58 | 0.35 | 1.00 | |||
| 2914 | 17.18 | 1.81 | 7436 | 5.74 | 11.34 | 20.27 | 0.97 | 1.35 | 0.06 | 20.55 | 4.03 | 0.14 | 0.15 | |
| 2921 | N4889 D148 | 12.62 | 1.91 | 6508 | 5.57 | 0.35 | 19.17 | 2.62 | 1.88 | 0.34 | 1.00 | |||
| 2922 | IC4012 D174 | 15.93 | 1.86 | 7207 | 5.57 | 6.46 | 19.60 | 3.08 | 3.26 | 0.20 | 1.00 | |||
| 2923 | 17.65 | 9.99 | 8664 | 5.57 | -11.86 | 21.40 | 2.87 | 0.97 | 0.43 | 22.17 | 7.12 | 0.62 | 0.48 | |
| 2929 | 18.66 | 1.90 | 6266 | 5.45 | -0.77 | 22.94 | 3.49 | 1.73 | 0.05 | 1.00 | ||||
| 2940 | IC4011 D150 | 16.08 | 1.82 | 7244 | 5.21 | 2.00 | 17.21 | 0.42 | 1.32 | 0.06 | 18.78 | 2.31 | 0.09 | 0.24 |
| 2943 | 17.66 | 9.99 | 13298 | 5.18 | 16.84 | 24.98 | 0.81 | 67.60 | 0.17 | 21.45 | 5.48 | 0.12 | 0.01 | |
| 2945 | D065 | 16.15 | 1.77 | 6150 | 5.14 | -11.73 | 19.27 | 1.20 | 1.46 | 0.17 | 19.74 | 4.73 | 0.55 | 0.29 |
| 2956 | D084 | 16.20 | 1.98 | 6566 | 5.02 | -9.79 | 22.74 | 12.49 | 4.67 | 0.10 | 19.63 | 3.61 | 0.63 | 0.86 |
| 2960 | 16.78 | 1.74 | 5827 | 5.00 | 3.22 | 20.03 | 0.99 | 2.05 | 0.14 | 19.73 | 3.78 | 0.63 | 0.24 | |
| 2975 | N4886 D151 | 14.83 | 1.76 | 6363 | 4.78 | 1.01 | 21.39 | 16.37 | 7.00 | 0.05 | 1.00 | |||
| 2976 | 18.14 | 1.94 | 6693 | 4.75 | 11.09 | 23.06 | 6.04 | 1.36 | 0.45 | -1.00 | ||||
| 2985 | 17.87 | 1.65 | 5317 | 4.63 | -0.37 | 21.96 | 3.25 | 1.65 | 0.33 | 1.00 | ||||
| 2989 | 17.05 | 9.99 | 7675 | 4.48 | 16.17 | 18.42 | 0.57 | 1.70 | 0.18 | 20.75 | 3.81 | 0.29 | 0.35 | |
| 3012 | 17.49 | 1.83 | 8033 | 4.13 | -14.41 | 22.29 | 2.20 | 1.65 | 0.14 | 21.18 | 5.41 | 0.51 | 0.20 | |
| 3017 | 17.91 | 1.65 | 6965 | 4.01 | -1.52 | 23.05 | 4.53 | 3.92 | 0.15 | 1.00 | ||||
| 3034 | 18.06 | 1.70 | 5994 | 3.69 | -1.82 | 23.72 | 6.90 | 2.72 | 0.10 | 1.00 | ||||
| 3055 | N4881 D217 | 14.73 | 1.87 | 6757 | 3.32 | 16.56 | 21.74 | 12.55 | 4.44 | 0.05 | 1.00 | |||
| 3068 | D123 | 16.47 | 1.93 | 7716 | 3.07 | -2.43 | 19.22 | 0.80 | 1.83 | 0.29 | 19.44 | 3.89 | 0.45 | -0.14 |
| 3071 | 17.17 | 1.18 | 8909 | 2.95 | -13.46 | 21.56 | 4.40 | 2.22 | 0.10 | 21.60 | 0.55 | 0.69 | 1.00 | |
| 3073 | N4883 D175 | 15.43 | 1.89 | 8130 | 2.93 | 3.83 | 18.45 | 1.24 | 1.45 | 0.13 | 18.98 | 4.16 | 0.25 | 0.27 |
| 3084 | D193 | 16.43 | 1.82 | 7538 | 2.73 | 9.45 | 17.59 | 0.51 | 0.75 | 0.13 | 18.76 | 2.25 | 0.15 | -0.21 |
| 3092 | D085 | 17.55 | 1.59 | 8094 | 2.66 | -10.49 | 19.95 | 0.79 | 2.15 | 0.04 | 19.90 | 1.87 | 0.12 | 0.33 |
| 3098 | 18.63 | 1.74 | 6618 | 2.46 | -0.02 | 22.57 | 3.06 | 1.62 | 0.09 | 1.00 | ||||
| 3113 | 17.82 | 1.81 | 7601 | 1.99 | 7.66 | 21.54 | 3.26 | 1.88 | 0.24 | 1.00 | ||||
| 3121 | 17.34 | 1.76 | 7418 | 1.93 | 6.16 | 20.38 | 0.55 | 0.92 | 0.07 | 20.36 | 3.12 | 0.10 | 0.06 | |
| 3126 | 17.55 | 1.82 | 7906 | 1.81 | -8.27 | 20.17 | 0.52 | 3.12 | 0.61 | 19.46 | 2.73 | 0.60 | 0.06 | |
| 3129 | 17.94 | 1.71 | 6815 | 1.67 | 10.41 | 21.81 | 4.48 | 2.22 | 0.54 | 1.00 | ||||
| 3133 | 17.23 | 1.92 | 9770 | 1.62 | -2.76 | 19.30 | 1.01 | 0.80 | 0.24 | 19.87 | 2.57 | 0.27 | 0.32 | |
| 3146 | 18.54 | 1.58 | 5312 | 1.29 | 0.72 | 22.80 | 3.22 | 1.12 | 0.09 | 1.00 | ||||
| 3154 | 18.64 | 1.68 | 1.12 | 7.63 | 21.60 | 2.11 | 1.31 | 0.19 | 1.00 | |||||
| 3160 | 18.88 | 9.99 | 9546 | 0.98 | 5.03 | 23.32 | 1.15 | 1.26 | 0.03 | 22.34 | 4.69 | 0.56 | 0.10 | |
| 3166 | 18.37 | 1.79 | 8443 | 0.92 | 1.27 | 22.73 | 3.75 | 1.98 | 0.22 | 1.00 | ||||
| 3170 | IC3998 D152 | 15.70 | 1.90 | 9399 | 0.88 | 0.19 | 19.33 | 1.62 | 3.09 | 0.27 | 19.71 | 4.89 | 0.25 | -0.32 |
| 3172 | 18.69 | 1.83 | 27401 | 0.86 | 18.25 | 21.35 | 1.67 | 4.86 | 0.11 | 1.00 | ||||
| 3178 | D101 | 16.18 | 1.84 | 7991 | 0.73 | -6.81 | 20.97 | 3.76 | 4.69 | 0.10 | 20.38 | 4.25 | 0.66 | 0.82 |
| 3192 | 18.17 | 1.49 | 5959 | 0.48 | -14.02 | 21.67 | 0.83 | 1.28 | 0.01 | 21.80 | 4.11 | 0.15 | 0.10 | |
| 3196 | 18.35 | 1.82 | 6847 | 0.41 | -4.86 | 21.91 | 2.40 | 2.02 | 0.18 | 1.00 | ||||
| 3204 | 18.54 | 1.88 | 8340 | 0.32 | 12.33 | 21.02 | 1.71 | 1.87 | 0.11 | 1.00 | ||||
| 3205 | 17.61 | 1.83 | 6237 | 0.31 | -6.19 | 21.56 | 3.59 | 1.62 | 0.30 | 1.00 | ||||
| 3206 | D126 | 16.36 | 1.79 | 6869 | 0.31 | -0.74 | 19.88 | 0.90 | 3.64 | 0.14 | 18.80 | 2.67 | 0.45 | 0.18 |
| 3213 | D153 | 16.14 | 1.83 | 6752 | 0.21 | 1.43 | 20.57 | 3.32 | 4.14 | 0.06 | 1.00 | |||
| 3222 | D125 | 16.47 | 1.75 | 6925 | -0.11 | -2.76 | 19.53 | 1.89 | 4.77 | 0.12 | 1.00 | |||
| 3225 | 18.33 | 1.70 | 16911 | -0.13 | -6.71 | 19.97 | 0.82 | 0.95 | 0.20 | 20.31 | 2.59 | 0.60 | 0.34 | |
| 3245 | 18.42 | 2.18 | 29670 | -0.42 | 12.87 | 20.55 | 1.68 | 3.20 | 0.33 | 24.44 | 15.61 | 0.20 | 0.53 | |
| 3248 | 18.75 | 1.78 | 7519 | -0.43 | 10.43 | 22.38 | 3.09 | 1.85 | 0.11 | 1.00 | ||||
| 3254 | D127 | 16.57 | 1.84 | 7549 | -0.56 | -0.15 | 19.56 | 1.09 | 3.41 | 0.26 | 19.97 | 3.14 | 0.45 | 0.44 |
| 3258 | 18.61 | 1.68 | 32977 | -0.56 | 12.52 | 18.01 | 0.36 | 1.87 | 0.83 | 19.51 | 1.37 | 0.34 | 0.15 | |
| 3262 | D102 | 16.77 | 1.82 | 3690 | -0.64 | -6.96 | 21.79 | 5.25 | 3.55 | 0.32 | -1.00 | |||
| 3269 | D128 | 16.12 | 1.75 | 7860 | -0.69 | -1.01 | 18.07 | 0.60 | 1.79 | 0.28 | 18.95 | 2.77 | 0.57 | 0.31 |
| 3291 | D154 | 16.41 | 1.78 | 6927 | -0.98 | 0.99 | 22.03 | 4.19 | 3.62 | 0.26 | 20.80 | 4.37 | 0.39 | 0.55 |
| 3292 | 17.70 | 1.85 | 4890 | -1.05 | 1.82 | 19.90 | 0.47 | 1.17 | 0.06 | 19.94 | 2.02 | 0.18 | 0.12 | |
| 3296 | N4875 D104 | 15.88 | 1.96 | 8005 | -1.08 | -3.80 | 18.55 | 1.12 | 2.32 | 0.13 | 19.34 | 3.21 | 0.21 | -0.43 |
| 3298 | 17.26 | 1.79 | 6833 | -1.11 | -11.63 | 21.30 | 1.60 | 1.48 | 0.41 | 21.19 | 6.86 | 0.55 | 0.13 | |
| 3302 | 17.33 | 1.68 | 5617 | -1.13 | 11.71 | 20.85 | 2.56 | 2.11 | 0.24 | 1.00 | ||||
| 3312 | 18.68 | 1.78 | 7293 | -1.27 | 2.88 | 20.92 | 1.29 | 1.73 | 0.09 | -1.00 | ||||
| 3313 | 17.53 | 1.83 | 6262 | -1.29 | -8.69 | 19.70 | 1.30 | 2.07 | 0.07 | -1.00 | ||||
| 3329 | N4874 D129 | 12.78 | 9.99 | 7166 | -1.56 | -0.68 | 19.86 | 8.02 | 1.25 | 0.15 | 1.00 | |||
| 3336 | 18.47 | 9.99 | 13278 | -1.57 | -3.88 | 21.49 | 1.60 | 2.15 | 0.14 | 1.00 | ||||
| 3339 | 17.54 | 1.78 | 6279 | -1.66 | -6.43 | 20.40 | 1.69 | 1.07 | 0.11 | 22.49 | 5.14 | 0.17 | 0.61 | |
| 3340 | 18.54 | 1.93 | 4193 | -1.68 | -2.16 | 22.22 | 2.46 | 1.67 | 0.19 | 1.00 | ||||
| 3367 | N4873 D155 | 15.15 | 1.91 | 5834 | -2.20 | 0.78 | 17.85 | 0.77 | 1.67 | 0.14 | 18.80 | 3.69 | 0.24 | 0.22 |
| 3383 | 18.50 | 1.86 | 4640 | -2.41 | -6.56 | 21.31 | 1.80 | 1.61 | 0.11 | 1.00 | ||||
| 3387 | 18.22 | 1.70 | 7433 | -2.45 | 7.79 | 23.23 | 4.97 | 2.30 | 0.14 | 1.00 | ||||
| 3390 | D176 | 15.89 | 1.75 | 6892 | -2.49 | 4.56 | 17.83 | 0.79 | 1.09 | 0.31 | 18.21 | 2.74 | 0.54 | 0.26 |
| 3392 | 18.07 | 1.44 | -2.62 | -0.97 | 23.09 | 6.78 | 1.49 | 0.26 | 1.00 | |||||
| 3400 | IC3973 D103 | 15.32 | 1.88 | 4722 | -2.65 | -5.19 | 17.80 | 1.02 | 1.92 | 0.10 | 19.34 | 3.79 | 0.41 | -0.54 |
| 3403 | D087 | 16.87 | 1.79 | 7790 | -2.70 | -10.75 | 22.10 | 4.95 | 5.68 | 0.07 | 1.00 | |||
| 3406 | 18.76 | 1.76 | 7166 | -2.76 | 3.01 | 21.75 | 1.93 | 1.57 | 0.17 | 1.00 | ||||
| 3414 | N4871 D131 | 14.89 | 1.90 | 6788 | -2.82 | -0.86 | 18.60 | 1.26 | 2.59 | 0.10 | 19.43 | 5.75 | 0.40 | 0.32 |
| 3423 | IC3976 D088 | 15.80 | 1.95 | 6819 | -2.97 | -7.23 | 19.40 | 1.93 | 4.27 | 0.09 | 19.25 | 3.73 | 0.40 | 0.57 |
| 3433 | D177 | 16.56 | 1.79 | 5542 | -3.09 | 4.19 | 18.68 | 0.84 | 1.40 | 0.31 | 19.07 | 2.52 | 0.43 | 0.30 |
| 3439 | D178 | 16.72 | 1.81 | 5641 | -3.15 | 6.89 | 20.81 | 1.37 | 4.81 | 0.10 | 19.97 | 2.65 | 0.14 | 0.33 |
| 3448 | 18.39 | 2.28 | 29731 | -3.27 | 15.57 | 20.16 | 1.02 | 5.75 | 0.20 | -1.00 | ||||
| 3463 | 18.09 | 1.87 | 6552 | -3.44 | -11.13 | 21.80 | 0.95 | 2.01 | 0.56 | 19.79 | 2.92 | 0.67 | 0.05 | |
| 3471 | D156 | 16.45 | 9.99 | 6708 | -3.57 | 1.67 | 21.40 | 4.92 | 3.40 | 0.22 | 1.00 | |||
| 3475 | 17.21 | 1.70 | 7977 | -3.63 | 19.01 | 17.89 | 0.38 | 2.12 | 0.10 | 18.96 | 2.14 | 0.38 | 0.25 | |
| 3481 | 17.69 | 1.68 | 7718 | -3.72 | 12.98 | 18.92 | 0.63 | 1.69 | 0.10 | 20.55 | 2.33 | 0.06 | 0.42 | |
| 3482 | 18.66 | 1.85 | -3.74 | 6.65 | 26.09 | 39.45 | 3.94 | 0.06 | 1.00 | |||||
| 3484 | D157 | 16.26 | 1.81 | 6119 | -3.80 | 0.17 | 21.82 | 6.45 | 5.12 | 0.10 | 21.40 | 6.66 | 0.47 | 0.81 |
| 3486 | 17.73 | 1.82 | 7840 | -3.86 | -2.17 | 19.71 | 0.87 | 1.36 | 0.17 | 21.23 | 4.52 | 0.08 | 0.23 | |
| 3487 | D132 | 16.63 | 1.88 | 7675 | -3.85 | -0.16 | 19.62 | 1.47 | 2.47 | 0.10 | 20.68 | 7.08 | 0.45 | 0.35 |
| 3489 | 17.93 | 9.99 | 5506 | -3.91 | 1.57 | 24.57 | 15.69 | 4.22 | 0.20 | 1.00 | ||||
| 3493 | D067 | 16.50 | 1.94 | 6033 | -3.97 | -13.91 | 18.75 | 1.30 | 1.61 | 0.28 | 19.77 | 3.54 | 0.54 | 0.56 |
| 3565 | 18.44 | 1.84 | 7171 | -5.09 | 0.18 | 22.85 | 5.13 | 2.33 | 0.39 | 1.00 | ||||
| 3567 | 18.71 | 1.77 | -5.10 | -0.15 | 22.41 | 3.48 | 1.74 | 0.37 | 1.00 | |||||
| 3615 | 18.82 | 2.22 | 6317 | -5.86 | 0.95 | 20.78 | 0.70 | 3.64 | 0.26 | 20.21 | 1.70 | 0.25 | -0.26 | |
| 3639 | N4867 D133 | 15.44 | 1.83 | 4805 | -6.12 | 0.02 | 21.52 | 9.11 | 6.13 | 0.28 | -1.00 | |||
| 3645 | 18.64 | 1.86 | 6417 | -6.23 | -4.50 | 20.50 | 1.25 | 1.64 | 0.08 | -1.00 | ||||
| 3656 | D180 | 15.53 | 1.77 | 7815 | -6.33 | 6.36 | 19.31 | 1.09 | 2.52 | 0.11 | 20.26 | 5.60 | 0.07 | 0.20 |
| 3660 | IC3963 D068 | 15.76 | 1.87 | 6853 | -6.49 | -11.76 | 19.45 | 1.55 | 2.65 | 0.11 | 19.96 | 5.64 | 0.35 | -0.33 |
| 3664 | N4864 D159 | 14.70 | 9.99 | 6812 | -6.61 | 0.38 | 19.93 | 4.97 | 2.36 | 0.10 | -1.00 | |||
| 3681 | 18.01 | 1.73 | 6913 | -6.89 | 2.32 | 21.25 | 2.25 | 1.55 | 0.05 | 1.00 | ||||
| 3706 | 17.61 | 1.85 | 6891 | -7.33 | -6.19 | 19.53 | 1.16 | 3.38 | 0.13 | -1.00 | ||||
| 3707 | 17.76 | 1.82 | 7212 | -7.34 | 4.22 | 21.80 | 5.03 | 2.92 | 0.58 | 1.00 | ||||
| 3719 | 18.29 | 1.91 | 7812 | -7.45 | -4.38 | 21.27 | 1.11 | 2.83 | 0.17 | 21.11 | 2.51 | 0.17 | 0.34 | |
| 3730 | IC3959 D069 | 15.27 | 1.94 | 7044 | -7.66 | -11.18 | 19.48 | 3.24 | 2.29 | 0.13 | -1.00 | |||
| 3733 | IC3960 D109 | 15.85 | 1.89 | 6600 | -7.70 | -6.93 | 17.65 | 0.75 | 1.16 | 0.18 | 18.89 | 2.97 | 0.13 | 0.28 |
| 3739 | IC3957 D070 | 15.88 | 1.87 | 6352 | -7.85 | -12.11 | 22.55 | 9.58 | 9.59 | 0.09 | -1.00 | |||
| 3750 | 18.08 | 1.91 | 6267 | -7.99 | -11.88 | 20.04 | 1.27 | 1.24 | 0.39 | 21.82 | 4.72 | 0.00 | 0.32 | |
| 3761 | IC3955 D160 | 15.57 | 1.88 | 7664 | -8.11 | 1.57 | 18.43 | 0.99 | 1.73 | 0.05 | 19.43 | 4.94 | 0.29 | -0.24 |
| 3780 | 17.89 | 1.85 | 5080 | -8.37 | 4.79 | 22.40 | 5.40 | 2.62 | 0.49 | 1.00 | ||||
| 3782 | D108 | 16.55 | 1.85 | 6426 | -8.43 | -3.57 | 19.45 | 1.22 | 3.31 | 0.16 | 19.50 | 3.53 | 0.32 | 0.34 |
| 3794 | D134 | 17.37 | 1.98 | 6956 | -8.53 | -0.68 | 18.82 | 0.82 | 2.05 | 0.26 | 19.21 | 1.69 | 0.13 | 0.43 |
| 3851 | D135 | 16.98 | 1.86 | 8283 | -9.43 | -0.18 | 22.18 | 6.06 | 4.92 | 0.23 | 1.00 | |||
| 3855 | 18.05 | 1.79 | 5564 | -9.57 | -2.16 | 22.54 | 4.40 | 2.25 | 0.20 | 1.00 | ||||
| 3882 | D071 | 16.97 | 1.85 | 6893 | -10.00 | -11.10 | 20.70 | 2.71 | 1.72 | 0.56 | 20.34 | 5.04 | 0.66 | 0.39 |
| 3895 | 17.74 | 1.72 | 8651 | -10.21 | -8.91 | 21.37 | 3.43 | 1.01 | 0.26 | 1.00 | ||||
| 3914 | D136 | 16.57 | 1.81 | 5661 | -10.49 | -0.35 | 19.82 | 2.33 | 3.54 | 0.14 | 1.00 | |||
| 3925 | 18.00 | 2.00 | 6448 | -10.72 | -10.48 | 21.39 | 3.28 | 1.66 | 0.04 | 1.00 | ||||
| 3943 | 16.93 | 1.88 | 5507 | -11.01 | -9.42 | 19.86 | 1.28 | 1.33 | 0.29 | 19.69 | 3.63 | 0.37 | 0.21 | |
| 3958 | IC3947 D072 | 15.94 | 1.91 | 5655 | -11.22 | -11.12 | 19.64 | 2.31 | 3.24 | 0.35 | 19.08 | 2.86 | 0.37 | 0.57 |
| 3972 | D181 | 16.52 | 1.87 | 6046 | -11.46 | 6.81 | 19.40 | 1.70 | 2.32 | 0.14 | 20.51 | 5.80 | 0.84 | 0.78 |
| 3973 | 18.66 | 1.86 | 6715 | -11.49 | 1.50 | 23.06 | 3.97 | 3.21 | 0.18 | 1.00 | ||||
| 3982 | 19.40 | 2.46 | 45675 | -11.62 | 5.01 | 20.56 | 1.15 | 3.39 | 0.18 | 1.00 | ||||
| 3993 | 19.02 | 2.36 | 47234 | -11.80 | -3.58 | 22.18 | 2.49 | 5.72 | 0.28 | 1.00 | ||||
| 3997 | IC3946 D091 | 15.28 | 1.95 | 5879 | -11.96 | -9.60 | 17.81 | 1.30 | 1.32 | 0.36 | 19.02 | 4.96 | 0.30 | 0.29 |
| 4003 | 18.60 | 1.81 | 7074 | -12.05 | 2.89 | 20.32 | 0.49 | 0.52 | 0.08 | 21.13 | 3.18 | 0.40 | 0.10 | |
| 4024 | 17.97 | 2.39 | 47492 | -12.43 | -4.12 | 22.13 | 1.03 | 8.65 | 0.19 | 19.62 | 2.32 | 0.22 | 0.09 | |
| 4035 | 18.49 | 1.82 | 6657 | -12.67 | -12.99 | 22.94 | 4.38 | 1.97 | 0.06 | 1.00 | ||||
| 4060 | 17.57 | 1.31 | 8703 | -13.32 | -12.59 | 22.82 | 5.69 | 1.10 | 0.20 | 1.00 | ||||
| 4063 | 19.32 | 2.38 | 47692 | -13.45 | -2.89 | 21.19 | 1.38 | 4.07 | 0.10 | 1.00 | ||||
| 4081 | 18.91 | 2.15 | 50090 | -13.71 | -3.00 | 24.95 | 9.46 | 12.19 | 0.70 | 20.48 | 1.21 | 0.32 | 0.73 | |
| 4083 | 17.82 | 1.91 | 6178 | -13.70 | -8.60 | 21.12 | 2.49 | 1.65 | 0.55 | 21.14 | 4.34 | 0.54 | 0.44 | |
| 4103 | 17.74 | 1.76 | 6017 | -14.10 | -0.99 | 21.11 | 0.64 | 15.95 | 0.43 | 19.58 | 2.69 | 0.56 | -0.11 | |
| 4118 | 18.31 | 1.56 | 5387 | -14.31 | -8.88 | 22.82 | 5.22 | 1.10 | 0.42 | 1.00 | ||||
| 4129 | 18.54 | 1.92 | 6088 | -14.60 | -7.26 | 21.60 | 2.29 | 1.95 | 0.03 | 1.00 | ||||
| 4141 | 18.71 | 1.73 | -14.74 | -5.85 | 23.46 | 7.50 | 1.24 | 0.40 | -1.00 | |||||
| 4175 | 18.65 | 1.85 | 4628 | -15.26 | -8.02 | 20.16 | 0.87 | 0.92 | 0.33 | 21.12 | 3.21 | 0.45 | 0.28 | |
| 4200 | D182 | 16.84 | 1.72 | 5638 | -15.63 | 4.75 | 20.19 | 2.36 | 2.75 | 0.01 | 1.00 | |||
| 4205 | 19.45 | 2.60 | 62822 | -15.72 | -7.05 | 20.92 | 1.57 | 3.59 | 0.41 | 1.00 |
| B/T | num | Bulge | Disc | ||
|---|---|---|---|---|---|
| 1 | 54 | 0.21 | 0.14 | ||
| 0.5-1 | 14 | 0.21 | 0.16 | 0.53 | 0.24 |
| 61 | 0.21 | 0.15 | 0.34 | 0.20 |
| Type | Number | ||
| All | 162 | 6900 | 1182 |
| (B/T0.5) | 61 | 6994 | 1137 |
| (B/T0.5) | 68 | 6904 | 1183 |
| E (B/T=1) | 54 | 6864 | 1234 |
| E () | 15 | 6871 | 1129 |
| E () | 39 | 6862 | 1273 |
| E | 29 | 6825 | 1035 |
| E | 25 | 6910 | 1430 |
| S0 (0.5B/T1 ) | 14 | 7057 | 942 |