parentequation\setcounterparentequation0
Cosmological Simulations of Elliptical Galaxy Formation in and Cosmologies.
Abstract
We present the results of a series of gas dynamical cosmological simulations of the formation of individual massive field galaxies in the standard concordance and in a cosmology each with =0.3 and =0.7. Two high resolution simulations ( gas and dark matter particles) have been performed and investigated in detail. The gas component was represented by Smooth Particle Hydrodynamics (SPH) and a simple star formation algorithm was applied. The galaxies form in an initial burst of star formation followed by accretion of small satellites. They do not experience a major merger. The simulated galaxies are old ( 10 ) hot stellar systems with masses of . Baryonic matter dominates the mass in the luminous part of the galaxies up to effective radii. The projected properties of the galaxies have been investigated in detail: The galaxy is a slowly rotating () spheroidal stellar system (E2) with predominantly disky isophotes. The line-of-sight velocity distributions (LOSVDs) deviate from Gaussian shape and is anticorrelated with . The corresponding galaxy is more elongated (E3 - E4) and rotates faster (). The anisotropy parameter is close to unity indicating isotropic velocity dispersions. There is no clear indication for isophotal deviations from elliptical shape and the projected LOSVDs do not show correlated higher order deviations from Gaussian shape. Within the uncertainties of both galaxies follow the Fundamental Plane. We conclude that the properties of the two galaxies simulated in the and cosmology are in good agreement with observations of intermediate mass elliptical or S0 galaxies. Our conclusion differs from Meza et al. (2003), who find, from a similar simulation, a much more concentrated galaxy than is generally observed. The differences in our findings may either be the result of differences in the star formation algorithms or due to the different merger history of the galaxies.
keywords:
1 Introduction
The concordance paradigm (a cold dark matter cosmology with the addition of a cosmological constant) appears to provide an excellent fit to astronomical observations on scales large compared to the sizes of individual galaxies (?; ?). However there are some indications that the standard model may have too much power on small scales to be consistent with observations. For example, ?) show that numerical simulations predict a larger number of Galactic satellites than observed, though ?) argue that this problem can be solved by the suppression of dwarf galaxy formation in a photoionized inter-galactic medium. A second problem relates to the steep cusps found in the centres of simulated dark matter halos (see ?; ?; ?), which appear to be inconsistent with the dark matter distributions inferred in dwarf galaxies (see e.g. ?). It is not yet clear whether this discrepancy requires a revision of the model. For example, ?) argues that low mass haloes in the CDM model may have less cuspy profiles than higher mass haloes, though this result is disputed by ?).
It is also not yet clear whether the properties of real galaxies can be explained by the model. Does the concordance model produce galaxies of the right masses and sizes at the right epochs? In fact there are some indications from galaxy formation that the concordance model may have too much small scale power. For example, it has proved difficult to make realistic disk galaxies in numerical simulations of the CDM model incorporating gas dynamics. In most simulations, the disk systems that form are smaller, denser and have much lower angular momenta than real disk systems (see ?, ?; ?, ?; ?). More acceptable fits to real disk systems can be found if heuristic prescriptions modelling stellar feedback are included in the simulations (?, ?,?, ?). However, even in these simulations, the disk systems typically contain denser and more massive bulges than the vast majority of real disk galaxies.
Most of the previous work on the formation of individual galaxies from cosmological initial conditions has focused on the formation of disk galaxies. The formation of individual elliptical galaxies has not been investigated as extensively. This seems surprising as giant elliptical galaxies are the oldest and most massive stellar systems in the Universe and probably contribute over 50% of the total stellar mass if we include the stars in the bulges of S0, Sa and Sb spirals. Although their internal kinematics can be very complex the major component of the stellar population in ellipticals is old and homogeneous. They are therefore good probes of galaxy assembly, star formation and metal enrichment in the early universe (see e.g. ?). Furthermore, the giant ellipticals follow simple scaling relations, the Fundamental Plane being the most important (see e.g. ?). These simple scaling relations should arise naturally from the correct cosmological model.
Despite their complex kinematics, it has become evident over the last 15 years that observed giant ellipticals show detailed photometric and kinematic properties that correlate with their luminosity. Massive giant ellipticals are slowly rotating, flattened by anisotropic velocity dispersions and show predominantly boxy isophotes. Lower mass giant ellipticals have disky isophotes and are flattened by rotation (?). These low mass ellipticals most likely contain weak disk components (?). The fact that boxy ellipticals, in contrast to disky ellipticals, show strong radio and X-ray emission (?) and have flat density cores (?) might indicate that they formed either by a different process or in a different environment.
How and when giant ellipticals have formed is still poorly understood. According to the “merger hypothesis” early type galaxies formed by mergers of disk galaxies. Idealised models of binary mergers of disk galaxies (with and without gas and star formation) and multiple mergers have been investigated in great detail by several authors (e.g. ???????). Those simulations – the recent ones with high numerical resolution – are useful in understanding detailed internal processes e.g. gas inflow to the centre (?). They are also capable of explaining the origin of fine structure in individual ellipticals. For example, a large study of collisionless disk mergers by ?) showed that binary disk mergers can successfully reproduce global kinematic and photometric properties of low and intermediate mass giant ellipticals. The formation of faint embedded disks that are observed in these galaxies can be explained if gas was present in progenitor galaxies (???).
Despite these successes, binary merger simulations suffer from certain limitations. In particular they use approximate equilibrium models of present day spiral galaxies as progenitors rather than self-consistently calculating the properties of the progenitors “ab initio” from realistic cosmological initial conditions. This is a serious limitation, since it is unlikely that the high redshift progenitors of ellipticals really resembled present day spirals. Added to the model uncertainties there are also a large number of degrees of freedom in the initial conditions, e.g. the geometries of the orbits, halo profiles, bulge masses, bulge rotation, gas content, gas distribution, disk sizes etc. are all adjustable parameters. Although there have been attempts to survey e.g. different halo profiles (?) or disk spin orientations (?), these parameter surveys are evidently incomplete. In addition, questions regarding a self consistent evolution of stellar populations are extremely difficult to address. Specifically current generation ellipticals are far too red, metal rich and old to have formed via mergers of systems similar to current epoch spirals. Merger simulations have therefore failed, so far, to explain the origin of global scaling relations like the color-magnitude relation or, more generally, the fundamental plane. They have, however, proved very useful in developing an understanding of the detailed internal merger dynamics.
The best way to overcome these problems is via high resolution simulations of individual elliptical galaxies from realistic cosmological initial conditions. The initial conditions are constrained by the cosmological model alone and the subsequent evolution is governed solely by the numerical resolution and accuracy of the physics that is implemented in the simulation. Once a sufficient number of individual ellipticals over the whole mass spectrum have been simulated, it should be possible (if the cosmological model is correct) to explain the origin of the global scaling relations and the detailed properties of individual galaxies at different luminosities.
A first attempt in this direction has been made by ?. These authors followed the formation of a single spheroidal galaxy in a cosmology. The kinematic properties of their galaxy resembled a rotationally supported giant elliptical. However, the effective radius of the simulated galaxy was a factor of 10 smaller than for observed ellipticals at the same brightness. This galaxy is therefore much too compact to be consistent with observations.
Does this result imply a problem in forming elliptical systems in the model? Two lines of investigation are suggested. First, the cosmological model adopted may be correct but the physical treatment may be inaccurate. Specifically, feedback from some early star formation into the shallow potential wells in the small halos existent at those times, may so efficiently blow out other gas as to reduce early star formation effectively (?, ?, ? and Nagamine, Cen and Ostriker (in preparation) are also exploring this possibility). The inclusion of stellar feedback would reduce the number of low mass galaxies, but not the number of low mass halos. It would also significantly reduce the stellar density in the centres of systems, but would not reduce the dark matter density by very much 111A small reduction would occur since concentration of baryonic material forces a moderate increase of the central dark matter density by purely gravitational processes over what would have been the case without efficient baryonic cooling..
If, however, it is not obvious that the discrepancy found by ? can be cured by a better treatment of the physics. If the evidence for low dark matter densities in the centres of galaxies is taken seriously (?), then we may want to consider a more radical solution.
An alternative is to reduce the small scale power in the dark matter density fluctuations. This can be achieved in various ways. First, the spectral index, , could be sufficiently small so that after normalization to the WMAP amplitude, and extrapolation to the small wavelengths relevant to galaxy formation, the amplitude is low enough to significantly reduce early star formation. The WMAP analysis (?) combined with 2dFRGS and supernova data in fact indicated that may be as small as , and this may alleviate some of the purported difficulties of the concordance model. We will return to this possibility in later work. However, there are significant limits on the value of the spectral index , since information on the cluster length scale , which is intermediate between the WMAP scale and the galaxy formation scale seems to require a relatively high normalization (?). This would not permit a constant solution with much less than . Furthermore, the high optical depth for electron scattering becomes very difficult to achieve with a low spectral index (?; ?).
Another possibility is to achieve low power on small scales by some form of cut–off in the power spectrum. An example of this is the Warm Dark Matter model, where a finite but quite small initial “thermal” velocity dispersion sharply truncates the power above some wave number scale, . ?) show that
| (1) | |||||
where the warm dark matter particle has mass, and the density in WDM is represented by , at . The additional velocity dispersions are distributed as
| (0a) |
with
| (0b) |
?) used the abundance of small column density lines in the Lyman alpha forest to limit . Other work suggests similar limits of , hence, in this paper, we will investigate WDM with .
One may ask at this point if the WMAP observations of a high optical depth to the surface of last scattering, , rule out WDM? The answer is ambiguous. An examination of Fig. 5 of ?) indicates for , may be at level and as small as at the level. Further would is needed (but see ? for a counter argument) to set a limit on based on WMAP. Detailed work in progress by Ricotti & Ostriker (2003) indicates that, if other parameters are held constant, a WDM model with leads to only a 10% reduction in .
In this paper we aim to investigate formation and evolution of intermediate mass giant galaxies in the model, and to quantify the effect of reducing the power at small scales by studying a model. The paper is organised as follows: Section 2, summarizes the simulation code and describes how and initial conditions were generated . The results of two high resolution simulations in the and universe and a comparison of their global properties with a set of low resolution simulations are described in Section 3. In Section 4 we compare the internal properties of the two high resolution simulations in detail with observations of giant elliptical galaxies. Section 5 contains a summary and our conclusions.
2 Initial conditions and simulations
We performed two sets of cosmological simulations using and initial conditions: 5 simulations with gas and dark matter particles and 1 simulation with gas and dark matter particles. The lower resolution simulations were used to investigate the differences in the global properties of the stellar systems formed in each cosmology. The higher resolution simulations were used to investigate the internal properties of the simulated galaxies.
2.1 Power Spectra & Cosmological Parameters
The initial conditions of the and simulations assumed scale-invariant adiabatic fluctuations. The post-recombination power spectrum for both cosmologies is based on the parameterisation of ?) with =0.2 and the transfer function
| (0a) |
where
| (0b) |
with units of h and
| (0c) |
The power spectrum of the dark matter fluctuations in the cosmology is given by
| (1) |
The WDM spectrum is truncated at small scales as described by ?) through an additional factor in the transfer function of the CDM spectrum such that
| (2) |
with given by Equation 1. Here, is the mass of the warm dark matter particle which is set to 1 keV as described in the Introduction. The power spectrum P(k) therefore takes the following form:
| (3) |
The amplitude of the mass fluctuations in both cosmologies is normalised so that the mass fluctuation in spheres of radius 8Mpc is =0.86. This normalization was chosen to match the present day abundances of rich galaxy clusters in this cosmology (?) and is somewhat higher than the value deduced from more recent analyses (?, ? and ?). However, the value of is consistent with the WMAP determination and with weak lensing constraints (?), for our adopted value of the spectral index .
The baryonic fraction is set to =0.17, consistent with the predictions of primordial nucleosynthesis (?) and WMAP () for a Hubble parameter of h=0.65222h is defined such that =100h kms-1Mpc-1... Figure 1(a) shows a 2-d projection of a the initial particle positions for our simulation in the cosmology. Figs. 1(b) and (c) show the power spectra of the and initial conditions calculated from the particle distributions at . The dotted line in Figure 1 (c) shows the limit of our spatial resolution in the simulations. At scales smaller than this limit (to the right of the dotted line) there is no input power and the Poisson noise dominates.
| Simulation | Number | (kpc) | (kpc) | () | () | () |
|---|---|---|---|---|---|---|
| 126 – 167 | 116 – 208 | 29 – 52 | ||||
| 165 | 66 | 16 | ||||
| 125 – 169 | 116 – 208 | 29 – 52 | ||||
| 162 | 66 | 16 |
Velocity dispersions were added to the initial conditions of the warm dark matter model according to equations (0a & 0b). Additional velocity dispersions smear out the small-scale perturbations through free-streaming. We have performed simulations both with and without additional velocity dispersions and find only small differences at the very centres of the dark matter haloes (slightly less steep cusps when the velocity dispersions were included). The effects of initial velocity dispersions are unimportant for the simulations described in this paper.
We used identical values of =0.3, =0.7 for both the and the simulations. The mass of the warm dark matter corresponds to a mass cut-off of
| (4) |
in the simulations. The mass resolution of the 503 simulation is already sufficient to correctly represent the input power spectrum above this mass cut-off (see Table 2), thus the distribution of dark matter would not be expected to change in a simulation with still higher resolution. However, this is not true of the simulations, which have no mass cut-off. Higher mass resolution in the would be expected to produce earlier collapse of smaller structures.
2.2 Halo Selection
| a | b | c | d | e | ||||||
| Rvir/kpc | 350 | 360 | 330 | 330 | 280 | 280 | 280 | 280 | 300 | 310 |
| MDM(Rvir)/1011M⊙ | 21 | 22 | 17 | 17 | 10 | 10 | 10 | 11 | 13 | 14 |
| log | 3.1 | 3.1 | 3.2 | 3.1 | 3.3 | 3.4 | 3.3 | 3.3 | 3.2 | 3.3 |
| Mgal/1010M⊙ | 8.0 | 8.9 | 7.3 | 7.9 | 7.4 | 6.1 | 5.5 | 6.9 | 6.3 | 7.2 |
| log | 1.7 | 2.3 | 2.1 | 1.2 | 1.4 | 1.5 | 2.6 | 2.7 | 2.0 | 2.2 |
The initial conditions for our simulations were generated in a two stage process. A low resolution dark matter only simulation of a large computational volume was run until the present day. Haloes were selected from the final output of the simulation to be run at higher resolution including Smooth Particle Hydrodynamics (SPH) to represent a dissipative gas component. The re-simulation of these haloes at higher resolution requires the addition of short wavelength fluctuations missing in the low resolution simulations. In addition particles at large distances are averaged hierarchically to represent the tidal field of the entire computational volume by a manageable number of particles. A full description of the methods used to generate our initial conditions can be found in ?) (see also ?). Here we summarise the specific parameters used for the simulations in this paper.
We ran a low resolution dark matter simulation using the Adaptive Particle-Particle, Particle-Mesh (AP3M) N-body code of ?). For both cosmologies, a cube of = 50 Mpc containing 1283 particles was evolved from a redshift of z = 24 to the present day. The force law used in the code was a Plummer law with a gravitational softening fixed in comoving coordinates at 7 kpc . Identical random phases were used in both cosmologies so that the same haloes could be simulated at higher resolution enabling direct comparisons to be made. We used a spherical over-density group-finding algorithm (?) to identify virialised haloes at with masses in the range of in a low density environment such that the nearest halo with a mass greater than 10 is over 1 Mpc away. If applied to a 503 volume of the real universe our selection procedure would identify intermediate-mass giant field ellipticals or S0 galaxies systems similar to the Sombrero galaxy (M104) rather than late type spirals which are of lower mass, or very bright giant ellipticals which are found in high density regions.
Each target halo was re-simulated at a higher resolution with the inclusion of a gas component. We increased the particle number within a cubic volume at redshift containing all particles that end up within the virialised region of the halo at . Additional short wavelength perturbations were included to account for the missing small-scale power below the Nyquist frequency of the low resolution simulation. The size of the high resolution cube was of the order of . The tidal forces from particles outside the high resolution cube were approximated by increasingly massive particles in 5 nested layers of lower and lower resolution. Gas particles with masses chosen to the match the baryonic fraction were added in the high-resolution regions, in the same number and at the same positions as the dark matter particles. Outside the high-resolution regions only dark matter particles were included.
In total we ran 6 simulations simulations from to for each of the and cosmologies: Five simulations with particles (labelled (a) to (e)) and one simulation with particles within the high resolution cube . The simulations will be referred to as the and simulations hereafter. At the mass and spatial resolution of the runs, it is not possible to resolve the internal structure of a forming galaxy and they are used instead to investigate variations in their global properties. The simulations are used to investigate the internal properties of the galaxies in detail.

The simulations were performed with the GRAPESPH code as outlined in ?) using 5 GRAPE-3A boards (?) connected to a Sun Ultra-2 workstation. The evolution of the gas component was followed with SPH including radiative cooling and a simple star formation algorithm: Each gas particle that remains in a collapsing region with a density 7x10-23 kg m-3 (see ?; ?) for longer than a local dynamical time was converted into a star particle. Stellar feedback has been included in some simulations, using somewhat ‘ad hoc’ rules (?; ?; ?). However, it is clear that these representations are far from realistic. We have therefore chosen to make our simulations as simple as possible and hence stellar feedback is ignored. This makes it easier to compare simulations done at different mass resolutions, and to understand if the properties of the final stellar systems depend on whether the dark matter is warm or cold. Theoretical arguments (see e.g. ?; ?) suggest that stellar feedback is less important in high velocity dispersion systems than in low velocity dispersion systems, though since galaxies form hierarchically, feedback processes may have a significant effect on the evolution of high velocity dispersion systems at early times.
3 vs.

3.1 Simulations
For the cosmology investigated in this paper the formation of halos with masses should be suppressed because the initial power spectrum is truncated below this mass-scale. To quantify this effect, we compared the mass spectrum of satellite halos in the two cosmologies at the present day. A friends-of-friends group finding algorithm with a linking length of was used to identify dark matter haloes and their stellar systems for the simulations at . The massive central galaxy was excluded.
Figure 2 shows the mass distributions of the dark matter and stellar systems averaged over the 5 simulations in each cosmology As expected, the cosmology produces many more dark matter haloes with masses . There is, however, only a marginal difference in the mass distribution of the stellar systems. The central galaxies in the simulations have halo masses in the range of to , well above the cut-off mass of the cosmology. Table 2 summarizes some of the global properties of the galaxies are their counterpart. The virial radii, masses and the specific angular momenta of the galaxies and their halos do not reveal any large differences between the cold and warm dark matter simulations.
A comparison of the assembly history of the stellar mass for the central and galaxies averaged over the five simulations is shown in Figure 3. The mean values and standard deviations are shown. The redshifts at which and and of the present day mass in stars has been assembled are listed in Table 3. Again, there is no obvious difference between the and the cosmologies. At the stellar systems in both cosmologies have mean ages of about . The masses and ages of the galaxies are thus comparable to those of early type galaxies. In conclusion, despite differences in the formation of low mass dark matter haloes, the massive central galaxies formed in the two cosmologies resemble early type galaxies and have indistinguishable formation histories and global properties. The resolution of the simulations, however, is too low to investigate the internal properties of the main stellar systems in detail. We therefore now turn to the higher resolution simulations.
3.2 simulations
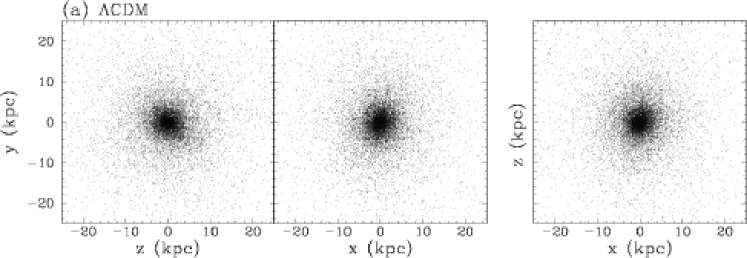
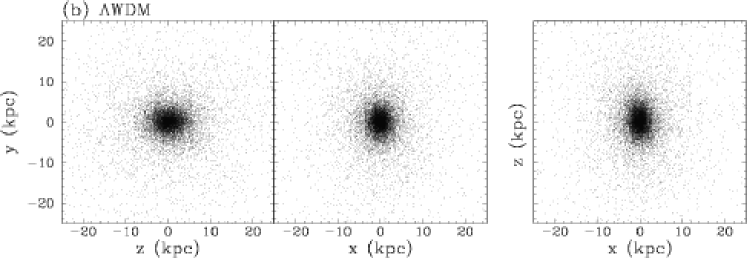
We have re-simulated halo ‘a’ (see Table 2) using particles within the high resolution region. Figure 4 shows the three orthogonal projections along the principal axes of the moment of inertia tensor of the central stellar systems in the and cosmologies at . The simulation produces a spheroidal stellar distribution. The galaxy on the other hand has a slightly more flattened morphology. We assume for a moment that the galaxies are two component systems and perform a decomposition of the surface mass density profile into an inner and outer component of the form:
| (5) |
where the constants and were determined using a non-linear fitting algorithm. The surface density profiles and the fits for the two galaxies are shown in Figure 5.
The stellar system that forms in the simulations has a more extended outer component. More interestingly, however, we see that the inner component of the galaxy in the simulation is more extended than in the galaxy. To test for evidence of whether the inner and outer components have kinematic counterparts, we performed a kinematic decomposition of the stars. We used a weak criterion to separate a kinematically cold component from a hot component. A star was tagged as a member of a cold component if
| (0a) | |||||
| (0b) | |||||
| (0c) |
where is the average circular velocity of the radial bin containing the star, is the radial velocity of the star, is the rotational velocity of the star, is the velocity along the minor axis defined by the moment of inertia tensor and is the average rotational velocity of the radial bin containing the star. Both galaxies are essentially hot stellar systems with no significant indication of a dynamically cold sub-component. The galaxy contains a small number of particles which obey the criteria given in equations 0a - 0c which are, however, distributed in a thick disk-like structure.
To quantify whether the flattening of the galaxy is caused by rotation, we have calculated the dimensionless spin parameter,, for the dark matter halos and the stellar systems where is defined as
| (1) |
and J is the angular momentum, E is the total energy and M is the total mass of the system (see e.g. ?)). To compute (1) only bound halo particles inside the virial radius and bound stars within the outer radius of the luminous part of the galaxy are included (defined as the radius at which the stellar density of the galaxy averaged in spherical shells becomes equal to the background level). The stellar system is treated as if it were virialised and so in Eqn. 1 is replaced by the kinetic energy of the stars ). In the cosmology the halo has =0.041 and the stars have =0.053, in the cosmology the halo has a slightly lower value of =0.032 whereas the stars have higher value of =0.228. Fig. 6 shows the specific angular momentum profiles for the and the galaxy. Neither cosmology produces a purely rotationally supported stellar system (, where is the specific angular momentum computed from the circular speed). However, the stellar system of the galaxy has a higher angular momentum than the galaxy except in the central regions .

Figure 7 shows the time evolution of the average specific angular momentum of the dark matter and stars in both cosmologies. At any given redshift the dark matter halo of the galaxy has more angular momentum than the halo, but they both show a very similar evolution with time.

In contrast, the angular momentum of the stars of the galaxy does not change significantly after a redshift of whereas the stars of the galaxy gain further angular momentum until with little evolution thereafter.

We have investigated the merger histories of the galaxies in more detail. A friends-of-friends algorithm with a linking length of 2.0 () was used to identify satellite galaxies consisting of more than 20 stellar particles () at each redshift. A satellite was then defined to have merged with the central galaxy at a redshift at which its particles were first identified as members of the central galaxy. Figure 8 shows the stellar mass ratio of every identified merger as a function of lookback time. The total number of mergers with M 109 M⊙ is 58 in the simulation compared with 96 in the simulation. The results show that at almost every redshift the galaxy experiences more individual minor mergers with higher mass ratios in stars than the corresponding galaxy. The mass ratio for an individual merger never exceeds 10:1. Low accretion rates like this are expected as the initial conditions were selected from low density environments. In addition to the frequency of mergers, the average internal composition of the merging satellites changes with time and is different in the two cosmologies (Figure 9). At redshifts the satellites always have a higher star-to-gas ratio. Interestingly, the only redshift range where the satellites have more mass in gas than in stars is . This corresponds to the period where the galaxies reach their second peak in the gas-to-star mass ratios as shown in Figure 10. In this figure

we plot the time evolution of the composition of the central galaxy. The mass-ratios of gas to stars (top) and dark matter to stars (bottom) in the and galaxies are plotted. The dark matter fractions vary only slightly between the two cosmologies. However, between a redshift of and the galaxy is significantly more gas rich than the galaxy.

To investigate where the stars that end up in the final galaxies have formed, we have calculated the stellar mass accumulated by the galaxies through mergers and compared it to the cumulative mass of stars that formed inside the galaxies (Figure 11). Below a redshift of two, when both galaxies have already assembled of their final stellar mass (see Figure 16), about 30% of all present day stars in the galaxy have been accreted by mergers and of the stars have formed inside the galaxy. Over the same period, the galaxy has accreted only of its present day stars and have formed within the galaxy.

The influence of the different accretion histories on the mean ages of the stellar population of the galaxies is shown in Figure 12. In each redshift bin we show the average age of the total stellar population for the (open squares) and the (filled squares) galaxies. In addition, the total stellar population was divided into stars that have merged with the galaxy (thick dashed and solid lines) and stars that have formed in the galaxy (thin dashed and solid lines). At all redshifts the galaxy accretes stars that are of a similar age to the galaxy itself. The accreted stars have formed in small halos at the same time as the stars within the main galaxy. In contrast, the stars accreted in the universe below are on average 1 younger than the stars within the galaxy. In total, however, the number of accreted stars is so small that there is almost no effect on the mean age of the galaxy.

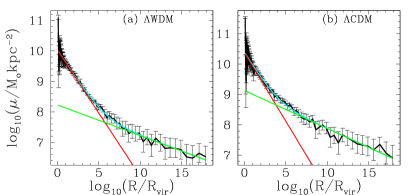
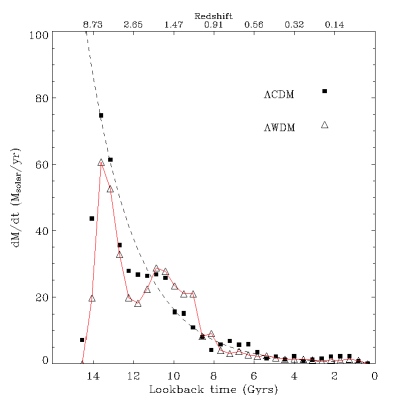
Fig. 13 shows the star formation rate of the main galaxy in the and simulations. The star formation rate of the galaxy can well be approximated by an exponential, sfr , with and . The galaxy does not follow an exponential. There is evidence for a second broad peak in the star formation rate around ago which is related to the enhanced gas accretion of the galaxy at early times.
The stellar mass assembly history of the 503 galaxies is shown in Fig. 16. As for the simulations, the early star formation rate of the central galaxy in the cosmology is significantly lower than in the cosmology. Due to this difference in the star formation histories, the galaxy is slightly older (half of its stars are older than ) than the galaxy (half of the stars are older than ).
3.3 Convergence Tests: Anticipated Effect of Extrapolation to Higher Resolution
In this section we investigate the effect of numerical resolution on the global properties of the galaxies formed in the and cosmologies. We estimate the degree to which convergence has been reached by comparing our and runs, which have identical large scale perturbations.
Table 3 lists some global properties of the and galaxies. The only value that increases significantly with resolution for both cosmologies is the radius at which the circular velocities reach their peak values. The corresponding circular velocity profiles for the baryonic and dark matter are shown in Fig. 14. The baryonic matter is more concentrated at low resolution. There are a number of possible explanations for this behaviour. If the gas in the inner parts of the galaxy is poorly resolved, star formation leads to a rapid depletion of gas resulting in artificial pressure gradients which drive more gas to the center. There is also the possibility that a mismatch of gravitational softening (Plummer) and SPH softening (cubic spline) supports unstable regions to collapse artificially (see ?).
| 343 | 503 | 343 | 503 | |
|---|---|---|---|---|
| R/(kpc) | 1.0 | 2.9 | 1.5 | 2.7 |
| Trot/Trand | 0.006 | 0.004 | 0.055 | 0.064 |
| 0.046 | 0.053 | 0.176 | 0.228 | |
| M(R)/(1010M⊙) | 4.49 | 7.63 | 6.84 | 8.43 |
| /(1010M⊙kpc-3) | 1.09 | 0.08 | 0.53 | 0.11 |
| 3.40 | 3.62 | 3.07 | 3.08 | |
| 9.971 | 10.01 | 9.987 | 10.01 | |
The cumulative mass profile is shown in Fig. 15. The galaxies produced in the 503 simulations extend much further than the lower resolution galaxies due the density criterion that we use to define the size of the galaxy.


Fig. 16 compares the stellar mass within 7 , corresponding to , as a function of lookback time for the and simulations in both cosmologies. We see that the assembly history is resolution dependent for redshifts . The trend goes in opposite directions for the two cosmologies. The galaxy accretes more mass whereas the galaxy accretes less. The final masses seem to converge at higher resolution. However, we note that our simulations do not include a photo-ionising background which would improve the numerical convergence in the case of the cosmology.
The collapse of objects smaller than the resolution limit of the simulations is suppressed at early epochs. Thus, when we increase the resolution in the simulations star formation occurs in objects which did not form at the lower resolution. However, in the power spectrum of the warm dark matter cosmology scales, , are intrinsically suppressed. Consequently, we see very little resolution dependence in the star formation history of the simulations as the resolution of the simulations is and therefore well below the cut off in the power spectrum. If we were to increase our resolution still further we would expect that the early star formation in the simulation to increase whilst very little change would be expected in the history of the simulations.

If we now compare the effect of resolution on the redshift where half of the stars are formed, , in the two cosmologies, we see that it increases with resolution in the cosmology but remains constant for the cosmology (Table 3). Thus if we extrapolate to higher resolution we conclude that in the cosmology will not change but the discrepancy between the formation redshifts in the two cosmologies would increase and could possibly produce a significant observable difference.
4 Detailed comparison with observations of elliptical galaxies

The analysis of the previous sections has shown that the simulated galaxies are hot spheroidal stellar systems. In this section we present a detailed comparison of the two galaxies formed in the and simulations with observations of giant elliptical galaxies with respect to observed characteristic photometric and kinematical properties, e.g. surface density profile, isophotal deviation from perfect ellipses, velocity dispersion, and major- and minor-axis rotation. In addition we analyse the line-of-sight velocity distribution (LOSVD) of both galaxies. The methods used to analyse the simulated galaxies closely follows the analysis used by observers and is described in detail in ?). Only a brief description will be given here. We created an artificial image of the simulated galaxies by binning the central 35 kpc into pixels and smooth it with a Gaussian filter of standard deviation 1.5 pixels. Using this image we derived the surface brightness distribution and the best fitting Sersic-profile (?) , where is the Sersic-index. For the profile is exponential, parameterises the de Vaucouleurs profile. The isophotes were analysed with respect to the fourth-order cosine deviation, , from perfect ellipses (?). For every projection of a simulated galaxy we defined an effective -coefficient, , as the mean value of between and , with being the projected spherical half-light radius. For the moment we are treating (M/L) as constant for all stellar particles regardless of when they were created, or the metallicity of the gas from which they originated.
The characteristic ellipticity for each projection was defined as the isophotal ellipticity at . The central velocity dispersion was determined as the average projected velocity dispersion of all stellar particles inside a projected galactocentric distance of . The characteristic rotational velocity along the major and the minor axis were the projected rotational velocities at and , respectively.
We analysed the surface brightness distributions of 100 random projections of the and galaxy using the Sersic-profile. The galaxy has a half-mass radius of and a mean Sersic-index of which is close to the observed lower limit for intermediate-mass ellipticals at the same effective radius (?). The galaxy shows a more exponential profile with a mean Seric-index of at a smaller effective radius of again consistent with lower observational limits (see Fig. 23). Interestingly, the observed trend for more exponential galaxies to have smaller effective radii is followed. Combined with the ellipticities and isophotal deviations derived in the following section the photometric properties of both galaxies agree with observed ellipticals (see ?).


In Fig. 17 we show the global analysis of the two galaxies resulting from the (filled boxes) and (open triangles) simulations seen along 100 random lines-of-sight. The observations of real elliptical galaxies are indicated by plus signs (data kindly provided by Ralf Bender). In the upper left plot of Fig. 17 the projections of the galaxy in the - plane are shown. The galaxy looks almost round with a maximum ellipticity of 0.2 and a peak in the ellipticity distribution around . It has predominantly disky () deviations from elliptical isophotes and there is a trend for more disky projections to have higher ellipticities. The galaxy is more elongated and the distribution of ellipticities peaks at with a maximum of . The isophotes are either slightly boxy or disky. Taking the errors of the analysis into account the isophotal shape scatters around zero. The area covered by the projections of both galaxies in the - plane is consistent with the observed distribution. However, the simulations do not reproduce galaxies with and or .
With respect to rotation, the galaxy is a slow rotator with
(upper right plot in Fig. 17)
and is likely to be flattened by anisotropic velocity dispersions as
the anisotropy parameter is in general well
below 0.7. As this galaxy shows predominantly disky isophotes it
occupies a region in the -
plane where no real galaxy is observed (lower left plot in Fig.
17). Additionally, in the
--plane the projections
cover the area of observed massive boxy ellipticals which are much
more luminous than the galaxies presented here. In contrast, the galaxy has projected -values higher than 0.5,
which is consistent with models for rotationally supported galaxies
(dashed line in upper right plot of Fig. 17). The galaxy
also is fairly isotropic with scattering around
zero and agrees well with observed isotropic galaxies with small
deviations from elliptical isophotes. None of the projections of the
simulated galaxies falls in the area of boxy anisotropic or disky
isoptropic ellipticals. Both simulated galaxies show minor-axis
rotation (lower right plot of Fig. 17). The galaxy
however disagrees with observations as it shows disky isophotes at the
same time. Observed disky ellipticals show only weak minor axis
rotation.


To analyse the LOSVDs of the simulated galaxies in more detail we placed a slit with a width of 1.5 kpc and a grid spacing of 0.5 kpc along the apparent long axis of each projected remnant. Thereafter all particles falling within each grid cell were binned in velocity along the line-of-sight. The line-of-sight velocity profiles for each bin along the grid were then parameterised by a Gaussian plus third- and fourth-order Gauss-Hermite basis functions (???). Figs. 18 and 19 show the kinematic parameters (, , ,) along the long axes of the and galaxy, respectively. and are the amplitudes of the third- and fourth order Gauss-Hermite functions. For and the resulting velocity profile is a Gaussian. For asymmetric profiles with the prograde (leading) wing steeper than the retrograde (trailing) one, and have opposite signs. When and have the same sign, the leading wing is broad and the trailing wing is narrow. LOSVDs with have a ’triangular’ or peaked shape, here the distribution’s peak is narrow with broad wings. Flat-top LOSVDs have , where the peak is broad and the wings are narrow.
The galaxy shows very little rotation inside its effective
radius (Fig. 18). The velocity dispersion inside
is flat and falls off slowly at larger
radii therefore never exceeds
0.2. The asymmetry of the LOSVD parameterised by is
anticorrelated with as it is observed for real
ellipticals (?). The local correlation between and
inside for 100
random projections of the simulated galaxy is shown
in upper plot of Fig. 20. and
agree well with observed data
(indicated by the shaded area) for
and are in general
anticorrelated. This is also reflected in a negative
effective value, , (lower plot in Fig.
20) for
almost all projections, where is defined as the
mean value of
inside one effective radius (see ?). The points follow
the observed correlation between and
.
The galaxy, as we have already seen in Fig. 17,
shows significant rotation
(Fig. 19) with the rotation velocity flattening out at
around 100 km/s beyond the effective radius. The velocity
dispersion profile is more peaked than for the case. This results
in local as high as 0.6. The
parameters and are consistent with zero inside
. Analysed for 100 projections the local value of
does not correlate with
which is in contradiction to
observations (upper
plot of Fig. 21). (lower plot in Fig.
21) tends to stay positive and does not follow the
observed trend, however it is broadly consistent with observations.

In summary, the galaxy can be interpreted as a modestly rotating
isotropic hot stellar system. Its global photometric and kinematical
properties are consistent with observations of isotropic
ellipticals. The galaxy does, however, not show any strong sign of
the fine-structure that would be typical for rotationally supported
elliptical galaxies. Its isophotal shape does not deviate
significantly from being elliptical and there is no evidence that the
LOSVDs show a correlated deviation from a Gaussian. This may be due,
at least in part, to an insufficient number of particles in the
simulation.
The galaxy shows signatures for being a combined
disk/bulge system (except for the very low net rotation rate). The
photometric decomposition (Fig. 5)
presents evidence for a disk-like sub-component. This is supported by
the predominantly disky shape of the galaxy. The anticorrelation
between and provides further kinematical evidence for
a combined disk-bulge system (??).
From the rotation curves, the round shape and the anisotropic
kinematics of the galaxy it becomes clear that the “disk” can
contribute only a small fraction to the total mass of the system.
However, the galaxy rotates too slowly to be consistent with
observations and there is no sign of a disk in the kinematic
decomposition. It forms a disky anisotropic system which is not
observed.
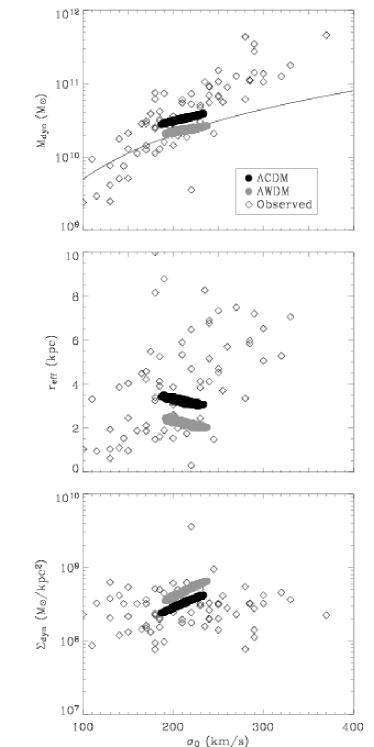
Due to the uncertain mass-to-light ratios of the simulated galaxies we
use the virial theorem to define a dynamical masses using the half-mass radius
and the central velocity dispersion of
every projected galaxy. This mass is used to define a dynamical
surface density, , to create a simulated
Fundamental Plane where the effective surface brightness is
replaced by . In the same way we derive
dynamical masses for observed ellipticals using the observed effective
radius and velocity dispersion. Fig. 22 shows a comparison of
observed ellipticals with the simulated and galaxies. Both
galaxies are consistent with observations. The galaxy has a
smaller dynamical mass and has a higher effective surface brightness
than the galaxy.
Figure 23 shows a comparison of the mean global projected properties of the simulated galaxies to the global properties of giant elliptical galaxies. The maximum spread in the data and in the observations is indicated by the error bars. It becomes clear from this figure that we produced “ordinary” ellipticals in our simulations which compare very well to the average properties of giant ellipticals.
The low number of stellar particles within the half-mass radii of the simulated galaxies () makes it too early to draw any final conclusion on the real structure of intermediate mass ellipticals in or cosmologies. Especially as the simulations are not yet numerically converged. Relaxation effects in particular might significantly influence the dynamics of the systems (see ?)
The present resolution is already sufficiently high to perform a
kinematical and photometric analysis within reasonable error limits
(all errors have been determined by applying the statistical
bootstrapping method (see ?) both for global and local
measurements (see e.g. Figs. 17,
18). Therefore we are able to trace the real structure
of the simulated galaxies at the present resolution. Increasing the
resolution, however, will very likely change the detailed internal
stellar structure of the simulated
galaxies whereas the differences will presumably be stronger for (as we have shown in the previous section) than for cosmologies.
A preliminary analysis of a higher resolution supports this conclusion.
5 Conclusions
We have presented the results of ten particles and two particles simulations of the formation of individual galaxies in a warm and cold dark matter cosmology with a cosmological constant. The sample of low resolution simulations enabled us to compare the global properties of the dark matter haloes and galaxies formed in the two different cosmologies. The two galaxies selected for re-simulation reside in a low density environment. Consequently the models presented here are are likely to trace the formation of ordinary intermediate mass giant elliptical or S0/Sa galaxies in the field, for example, the Sombrero galaxy (M104). The two high resolution simulations have been used to investigate the assembly histories of the final galaxies and to compare their internal properties with those of real early type galaxies.
As expected from the suppression of small-scale structure in the initial conditions, the cosmology produces fewer low mass dark matter haloes () at the present epoch compared with the cosmology (?). This feature is also reflected in the assembly histories of the two simulations. At almost all redshifts, the galaxy experiences more minor mergers with higher mass-ratios (up to 10:1) than the corresponding galaxy. Low accretion rates, and the absence of any major merger event, are expected since the initial conditions were selected from low density environments. In addition to differences in the frequency of mergers, the internal composition of the merging satellites differs in the two cosmologies. The satellites are always more gas rich. At redshifts the star-to-gas ratio is about an order of magnitude higher in the than in the cosmology. As a result, below a redshift of two (when both galaxies have already assembled of their final stellar mass) about 30% of all present day stars in the galaxy have been accreted by mergers and of the stars have formed inside the galaxy. Over the same period the has accreted only of its present day stars and have formed within the galaxy.
A further difference between the two cosmologies is evident in the angular momentum evolution of the galaxies. The halo of the galaxy has higher angular momentum than the halo but they both show a similar temporal evolution. In contrast, the average angular momentum of the stars of the galaxies does not change significantly after a redshift of whereas the stars of the galaxy gain further angular momentum until , with little evolution thereafter. Between a redshift of and the galaxy is more gas rich and forms more stars within the galaxy than its counterpart, resulting in a second peak in the star formation rate at .
We conclude that the removal of small scale power reduces the frequency of mergers. The reduction in the number of massive sub-halo mergers in the warm dark matter simulation produces a galaxy with significantly higher angular momentum at z=0. The increase in the specific angular momentum of objects in the warm dark matter simulations suppresses the collapse of gas within the simulations, which in turn reduces the star formation rate of the central galaxy at early epochs.
We performed a photometric and kinematical decomposition of the main stellar systems in the simulations. Both galaxies are dominated by a hot spheroidal component. The global projected properties of the two and galaxies resemble those of real elliptical galaxies. The total masses, density profiles, effective radii, ellipticities, global values of isophotal shapes and LOSVD asymmetries are consistent with the average global properties of giant elliptical galaxies of intermediate masses. This is in contrast to properties of very massive, anisotropic, and boxy ellipticals with large effective radii, typically found in clusters of galaxies. As the physical properties of massive ellipticals differ from those of ordinary intermediate mass ellipticals with respect to inner density-profiles, sizes, isophotal shapes and X-ray and radio properties (???), we can conclude that they must have formed in a denser environment and, therefore had different formation histories.
Investigating the galaxy in detail revealed that it appears to be an isotropic fast rotator with only weak fine structure both in its isophotal shape (the isophotes are elliptical) and in its LOSVDs (which on average have a Gaussian shape). The ratio of is a factor of ten higher for the than for the system. Observed rotationally supported ellipticals with similar rotational support do, however, show on average stronger asymmetries in their LOSVDs. The detailed photometric and global kinematical properties do agree very well with observations. The half-mass radius of stellar population is 2.3 . In contrast, the galaxy shows only weak rotation and appears to have anisotropic velocity dispersions. The isophotes are predominantly disky and the LOSVDs show the observed trend which indicates the presence of a weak disk component embedded in the spheroidal body of the galaxy (???). However, anisotropic disky systems, like the elliptical, are in general not observed. The half-mass radius of the galaxy is 3.2 . The mean age of the stellar population of both galaxies is about 10 which is in good agreement with the ages of early type galaxies.
?) have recently simulated the formation of an individual elliptical galaxy in a cosmology which is only a little more massive (by a factor of about 1.5) than our galaxy. However, their galaxy does not match the global properties of observed giant ellipticals as its stellar distribution is far too dense. Numerical resolution is unlikely to cause the difference as their initial particle masses and softening lengths are comparable to the values used for the simulations presented here. Their final galaxy, however, has significantly more stellar particles () than our galaxies (). This is due to differences in the star formation algorithms. ?) split their gas particles into several stars which can have different masses. As a result their mean stellar particle mass is a factor of four smaller than our fixed stellar mass. It is not clear in how far this difference influences the results, e.g. due to mass segregation effects in the stellar distribution. A further difference is that ?) make their stars at a rate proportional to the gas density with a relatively low efficiency. In the simulations presented here a gas particle is turned into a star particle as soon as its density is above a certain threshold for more than a dynamical time. As a result the gas in the ?) simulation can collapse to much higher densities before stars are formed.
In addition we omitted feedback processes in our simulations. ?) implemented thermal and kinematical feedback. Although one might naively expect that the inclusion of feedback would result in less compact objects, this goes in the opposite direction to explain the differences between their results and ours. Another possible explanation for the differences is the merger history. Our galaxies experience only minor mergers with mass ratios up to 10:1. The ?) galaxy undergoes a late major merger with a mass-ratio of 3:1 which could effectively drive gas into the centre and convert it into stars. However, the star formation history is not significantly different from our galaxy which undergoes no major merger. The merger is therefore more likely to influence the dynamics of the system rather than have a major effect on the concentration of the bulk of the stellar population.
Based on the simulations at two different resolutions in a and cosmology it becomes clear that this investigation is not yet definitive. As the simulations are not yet fully numerically resolved (especially the simulation) we cannot say with confidence whether or produces galaxies that most closely resemble real elliptical galaxies. In conclusion, we can state that with the simple physics included in our simulations, it is possible to produce ellipticals in both cosmologies with global properties that are in good agreement with observations of intermediate mass giant ellipticals or S0s. However, the combination of the detailed properties of our simulated galaxies (which are very likely to be resolution dependent), like the shape of the LOSVD or the isophotal shape, differ slightly from observations of real ellipticals for one combination or the other. Future simulations at higher resolution will hopefully enable us to determine which, if either, of the two cosmologies produce galaxies which match the observations.
6 Acknowledgements
Thorsten Naab acknowledges the award of a PPARC PDRA.
Bibliography
- Abadi M. G., Navarro J. F., Steinmetz M., Eke V. R., 2003, ApJ, 591, 499
- Bahcall N., Dong F., Bode P., SDSS Collaboration 2002, American Astronomical Society Meeting, 201, 0
- Barkana R., Haiman Z., Ostriker J. P., 2001, ApJ, 558, 482
- Barnes J. E., 1988, ApJ, 331, 699
- Barnes J. E., 2002, MNRAS, 333, 481
- Barnes J. E., Hernquist L., 1996, ApJ, 471, 115
- Bate M. R., Burkert A., 1997, MNRAS, 288, 1060
- Bender R., Burstein D., Faber S. M., 1992, ApJ, 399, 462
- Bender R., Doebereiner S., Moellenhoff C., 1988, A&AS, 74, 385
- Bender R., Saglia R. P., Gerhard O. E., 1994, MNRAS, 269, 785
- Bender R., Surma P., Doebereiner S., Moellenhoff C., Madejsky R., 1989, A&A, 217, 35
- Bendo G. J., Barnes J. E., 2000, MNRAS, 316, 315
- Benson A. J., Lacey C. G., Baugh C. M., Cole S., Frenk C. S., 2002, MNRAS, 333, 156
- Binney J. J., Evans N. W., 2001, MNRAS, 327, L27
- Bode P., Ostriker J. P., Turok N., 2001, ApJ, 556, 93
- Burles S., Tytler D., 1998, ApJ, 499, 699
- Caon N., Capaccioli M., D’Onofrio M., 1993, MNRAS, 265, 1013
- Cen R., 2003, Astro-Ph, 0303236
- Chiu W. A., Fan X., Ostriker J. P., 2003, Astro-Ph, 0304234
- Colin P., Klypin A., Valenzuela O., Gottlober S., 2003, submitted to ApJ, astro-ph/0308348
- Couchman H. M. P., 1991, ApJ, 368, L23
- Dekel A., Silk J., 1986, ApJ, 303, 39
- Diemand J., Moore B., Stadel J., Kazantzidis S., 2003, submitted to MNRAS, astro-ph/0304549
- Dubinski J., Mihos J. C., Hernquist L., 1996, ApJ, 462, 576
- Dutton A., Courteau S., Carignan C., de Jong R., 2003, submitted to AJ, astro-ph/0310001
- Efstathiou G., 2000, MNRAS, 317, 697
- Efstathiou G., Bond J. R., White S. D. M., 1992, MNRAS, 258, 1P
- Eke V. R., Cole S., Frenk C. S., Navarro J. F., 1996, MNRAS, 281, 703
- Eke V. R., Navarro J. F., Steinmetz M., 2001, ApJ, 554, 114
- Faber S. M., Tremaine S., Ajhar E. A., Byun Y., Dressler A., Gebhardt K., Grillmair C., Kormendy J., Lauer T. R., Richstone D., 1997, AJ, 114, 1771
- Fall S. M., Efstathiou G., 1980, MNRAS, 193, 189
- Governato F., Mayer L., Wadsley J., Gardner J. P., Willman B., Hayashi E., Quinn T., Stadel J., Lake G., 2002, Astro-Ph, 0207044
- Hernquist L., 1992, ApJ, 400, 460
- Heyl J. S., Hernquist L., Spergel D. N., 1994, ApJ, 427, 165
- Klypin A., Kravtsov A. V., Valenzuela O., Prada F., 1999, ApJ, 522, 82
- Lacey C., Cole S., 1994, MNRAS, 271, 676
- Meza A., Navarro J. F., Steinmetz M., Eke V. R., 2003, ApJ, 590, 619
- Mihos J. C., Hernquist L., 1996, ApJ, 464, 641
- Moore B., Quinn T., Governato F., Stadel J., Lake G., 1999, MNRAS, 310, 1147
- Naab T., Burkert A., 2001a, in ASP Conf. Ser. 230: Galaxy Disks and Disk Galaxies Gas Dynamics and Disk Formation in 3:1 Mergers. pp 451–452
- Naab T., Burkert A., 2001b, ApJ, 555, L91
- Naab T., Burkert A., 2003, accepted for publication by ApJ, 555, 555
- Navarro J. F., Frenk C. S., White S. D. M., 1995, MNRAS, 275, 56
- Navarro J. F., Frenk C. S., White S. D. M., 1997, ApJ, 490, 493
- Navarro J. F., Steinmetz M., 1997, ApJ, 478, 13
- Navarro J. F., White S. D. M., 1993, MNRAS, 265, 271
- Navarro J. F., White S. D. M., 1994, MNRAS, 267, 401
- Negroponte J., White S. D. M., 1983, MNRAS, 205, 1009
- Percival W. J., Sutherland W., Peacock J. A., Baugh C. M., Bland-Hawthorn J., Bridges T., Cannon R., + 20 Co-authors 2002, MNRAS, 337, 1068
- Pierpaoli E., Borgani S., Scott D., White M., 2002, Astro-Ph, 10, 116
- Refrigier A., 2003, ARA&Ain press, astro-ph/0307212
- Ricotti M., 2003, MNRAS, 344, 1237
- Rix H., White S. D. M., 1990, ApJ, 362, 52
- Seljak U., 2001, Astro-Ph, 0111362
- Sersic J. L., 1968, Atlas de galaxias australes. Cordoba, Argentina: Observatorio Astronomico, 1968
- Sommer-Larsen J., Götz M., Portinari L., 2002, Ap&SS, 281, 519
- Spergel D. N., Verde L., Peiris H. V., Komatsu E., Nolta M. R., Bennett C. L., Halpern M., Hinshaw G., Jarosik N., Kogut A., Limon M., Meyer S. S., Page L., Tucker G. S., Weiland J. L., Wollack E.and Wright E. L., 2003, Astro-Ph, 0302209
- Springel V., 2000, MNRAS, 312, 859
- Springel V., Hernquist L., 2003, MNRAS, 339, 289
- Steinmetz M., Navarro J. F., 1999, ApJ, 513, 555
- Sugimoto D., Chikada Y., Makino J., Ito T., Ebisuzaki T., Umemura M., 1990, Nature, 345, 33
- Thomas D., Maraston C., Bender R., 2002, Ap&SS, 281, 371
- van der Marel R. P., Franx M., 1993, ApJ, 407, 525
- Viana P. T. P., Nichol R. C., Liddle A. R., 2002, ApJ, 569, L75
- Weil M. L., Eke V. R., Efstathiou G., 1998, MNRAS, 300, 773
- Weil M. L., Hernquist L., 1996, ApJ, 460, 101
- Wright L. J., 2002, Numerical Simulations of Disc Galaxy Formation. PhD Thesis, University of Cambridge
- Yoshida N., Sokasian A., Hernquist L., Springel V., 2003, Astro-Ph, 0303622