Soft X-ray Absorption due to a Foreground Edge-On Spiral Galaxy Toward the Core of Abell 2029
Abstract
We have detected an X-ray absorption feature against the core of the galaxy cluster Abell 2029 () which we identify with the foreground galaxy UZC J151054.6+054313 (). Optical observations (, , , and ) indicate that it is an Scd galaxy seen nearly edge-on at an inclination of . H i observations give a rotation velocity of 108 km s-1 and an atomic hydrogen mass of , where is the distance to the galaxy in units of 90 Mpc. X-ray spectral fits to the absorption feature yield a hydrogen column density of cm-2 assuming solar abundances. If the absorber is uniformly distributed over the disk of the galaxy, the implied hydrogen mass is . Since the absorbing gas in the galaxy is probably concentrated to the center of the galaxy and the middle of the disk, this is a lower limit to the total hydrogen mass. On the other hand, the absorption measurements imply that the dark matter in UZC J151054.6+054313 is not distributed in a relatively uniform diffuse gas.
Subject headings:
dark matter — galaxies: clusters: individual (Abell 2029) — galaxies: individual (UZC J151054.6+054313) — galaxies: spiral — radio lines: galaxies — X-rays: galaxies1. Introduction
In this paper we report on the serendipitous detection of a foreground edge-on galaxy seen in absorption against the X-ray core of a cooling flow galaxy cluster. The cluster, Abell 2029, is a nearby () cluster which contains a central cD galaxy whose diffuse light extends up to 850 kpc (Uson, Boughn, & Kuhn, 1991). It has been (re)classified by Dressler (1978) as richness class 4.4. X-ray studies of the cluster show that it is a very relaxed system, and is one of the most luminous galaxy clusters [ ergs s-1]. We have examined the archival image of the cluster to study the structure of the thermal intracluster medium (ICM) in the core of the cluster and the interaction of the central radio source with the ICM (T. E. Clarke et al., in preparation, hereafter Paper II). While analyzing the image, we discovered a linear absorption feature roughly 15 south of the cluster core.
This feature is due to the galaxy UZC J151054.6+054313 (hereafter UZC J151054), which is a beautiful example of a late-type spiral galaxy seen (nearly) edge-on in the foreground of the dense cluster Abell 2029. It has a distinctive bulge component and a rather thin disk with a disk-to-bulge ratio of , consistent with the parameters of an Sb/Sc galaxy (Figure 1a). Dressler (1981) measured redshifts of 31 galaxies toward Abell 2029 and found UZC J151054 to be in the foreground of the cluster, at a redshift of , while the cluster is at a redshift of . The linear feature is due to photoelectric absorption of soft X-rays in the disk of the spiral galaxy which is seen against the diffuse thermal intracluster medium. In § 2, we discuss the X-ray, optical, and radio observations and reductions for this galaxy. The optical and H i details of the system are given in § 3 and § 4, respectively. § 5 presents the X-ray absorption due to the foreground spiral, and in § 6 we discuss the results of these observations.
Throughout this paper, we adopt a luminosity distance of 90 Mpc for UZC J151054. We express the physical properties in terms of this distance, and scale quantities with . This distance is consistent with a pure Hubble Flow and WMAP cosmology (Bennett et al., 2003), which gives =93.2 Mpc. This is also in agreement with the Tully-Fisher distance of 83 Mpc (see § 4 below). At a distance of 90 Mpc, the scale is 0.44 kpc/arcsec.
2. Observations and Data Reduction
2.1. X-Ray
The central region of Abell 2029 was observed with the X-ray Observatory on 2000 April 12 for a total time of 19.8 ksec (OBSID 891). The observations were centered on the back-illuminated ACIS-S3 chip. We present a detailed description of the data reductions in Paper II and only provide a brief summary here. The data were analyzed using CIAO version 2.3 and CALDB 2.18. The events were filtered for energy (0.3–10 keV) and grade (ASCA 0,2,3,4, and 6). The background light-curve was determined from the S1 chip and showed no strong flares, and we removed only 128 seconds of data due to high background.
The background for the observation was determined from the blank sky background files collected by M. Markevitch111See http://cxc.harvard.edu/contrib/maxim/acisbg/COOKBOOK. For the purposes of studying the absorption due to the foreground galaxy, it is the soft X-ray background in the 0.3–1 keV band which is most important. The soft background, which is mainly Galactic, varies by a factor of 2 even at high Galactic latitudes (Abell 2029 is at ). Thus, it would be preferable to use an in-situ background from the observation. Unfortunately, the PSPC image of Abell 2029 (Sarazin, Wise, & Markevitch, 1998) shows that the thermal X-ray emission from the cluster covers the entire S3 chip, and even extends beyond the S1 chip (the other backside-illuminated chip). As a result, it is difficult to determine an in-situ background from the observation. For this absorption study, it would also be useful to separate the background into particle and Galactic foregrounds and cosmological X-ray background. Although the correct background is thus uncertain by a factor of about two, the dominant “background” in these measurement is actually the diffuse cluster emission from Abell 2029, and the results presented here are affected by less than 10% by this uncertainty in the real background. The sense of the variation is that, if the background is higher than we have assumed (the likely sense of the variation), we have underestimated the absorption by the spiral galaxy, albeit very slightly.
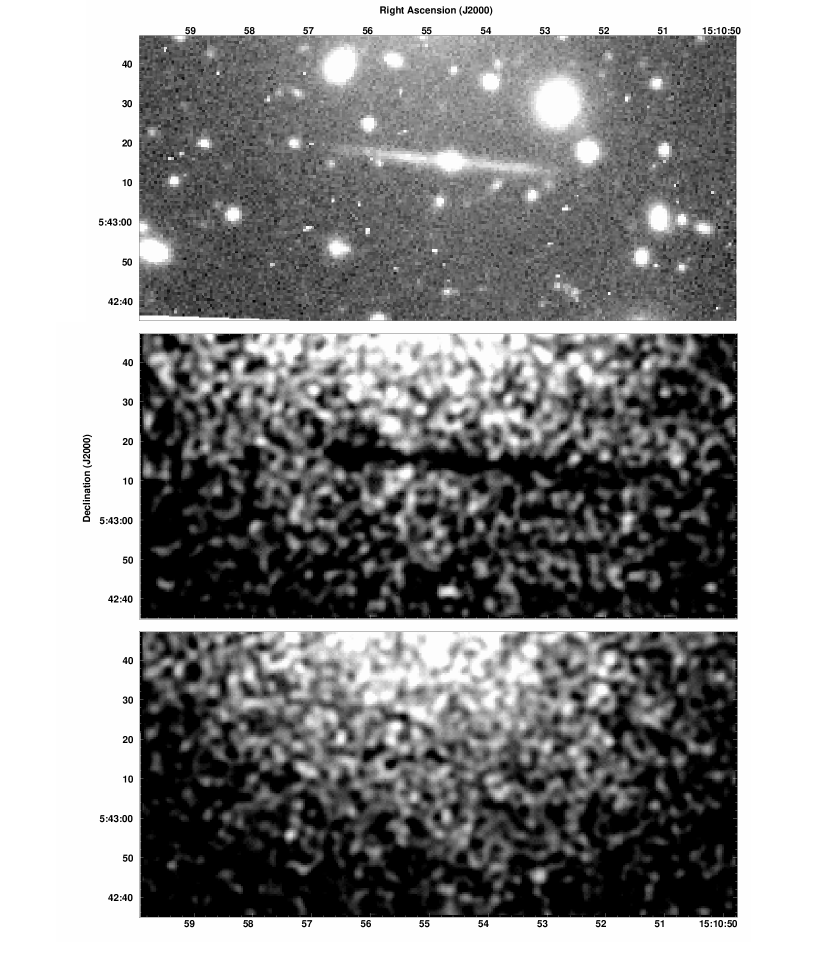
Figure 1b,c shows Gaussian smoothed (=1″) images in the soft and hard X-ray bands of the region around the spiral galaxy UZC J151054, both corrected for exposure and background. The emission gradient seen from north to south in the image is due to the thermal ICM of the core of the cluster Abell 2029. Detailed X-ray images of the galaxy cluster are presented in Paper II. The X-ray image was compared to the Two Micron All Sky Survey (2MASS; Cutri et al., 2001) to check the positional accuracy. There are three 2MASS IDs which are associated (within 1″) with X-ray sources, and comparison of positions shows no significant shift between the two coordinate systems.
2.2. Optical
, , , and band photometry has been obtained for a different project by one of us (JMU) in collaboration with S. P. Boughn (Haverford) and J. R. Kuhn (Hawaii). The observations were taken with the 0.9 m telescope on Kitt Peak National Observatory on 1987 May 20 and 1988 May 10 (), 1988 May 8 (), and 1988 May 14 (). The No. 3 RCA CCD was used for these observations mounted at the f:7.5 Cassegrain focus, which resulted in square pixels of 086 on a side. The seeing was . The observations produced mosaics of Abell 2029 which included the foreground spiral galaxy that we discuss in this paper (see Uson et al., 1991, for details of the observing and data reduction techniques). band photometry of Abell 2029 was obtained on 1998 April 19 using the T2KA camera mounted at the f:7.5 Cassegrain focus, which resulted in square pixels of 068 on a side. Throughout the run the seeing was excellent, between 07 and 09, which resulted in an effective seeing of 2 due to the available pixel size. The spatially-overlapping exposures were used to make a mosaic of about 35 (RA) by 58 (Dec) again including the galaxy discussed here (Dale & Uson, 2000). Figure 1a shows our galaxy immersed in the diffuse halo that pervades the center of Abell 2029 and extends about 850 kpc from the cluster center (Uson et al., 1991). The coordinate system of the band image of the spiral galaxy was tied to the 2MASS position frame using five matches in the field.
2.3. Radio Continuum
A cm continuum image has been obtained from a deep HI survey of Abell 2029. The NRAO Very Large Array (VLA) was used in its C configuration to cover the frequency range of 1300.7 MHz to 1335.2 MHz appropriate to the redshift range of the cluster. Although the frequency range precluded the observation of H i at the redshift of the foreground spiral, it yields a good continuum image of the field, with a resolution of ″ and an rms noise of Jy/beam. Figure 2 shows that the spiral galaxy is undetected in the radio continuum; we derive an integrated flux of Jy which leads to a upper limit of 200 Jy over the full area of the galaxy (270 arcsec2).
2.4. H i Observations
H i observations were obtained for us by Jodie Martin (UVa) and John Hibbard (NRAO) in two 10 minute observations with the NRAO Green Bank Telescope (GBT). The observations were made with the Spectral Processor using two orthogonal polarizations with bandwidths of 10 MHz with a frequency resolution of 9.8 kHz. The elevation was degrees which caused a fair amount of radio frequency interference (RFI) pickup. The data were (twice) Hanning-smoothed off-line in order to minimize a ripple due to strong out-of-band RFI, giving a final resolution of km s-1. The data were reduced using the DISH package in AIPS++. Even in the presence of RFI, the spectral stability was quite adequate and we have only subtracted a linear baseline from the data. The calibration was referenced to 3C295 which was observed about 12 hours after the galaxy at about the same elevation. We adopt a value for the flux of 3C295 of 22.46 Jy at our observing frequency (1391 MHz) from the Baars et al. (1977) scale which leads to the spectrum shown in Figure 3. From the scatter of the data in the line free channels, we estimate the 1- error per channel for the two polarizations to be 3.5 mJy (continuous line) and 4.4 mJy (dashed line).
The average redshift is 6438 km s-1 (optical definition, heliocentric) in good agreement with the value of km s-1 listed in the Updated Zwicky Catalog (Falco et al., 1999), which was obtained by Haynes et al. (1997) using the Arecibo telescope. Correction to the frame of the cosmic microwave background radiation yields a redshift of c km s-1 placing the galaxy at a distance of Mpc assuming a pure Hubble flow. We shall use this distance to derive physical quantities below but express those values in units of where appropriate.
3. Optical Properties
We have used the prescription in Tully et al. (1998) to determine the inclination and find a most-likely value of , assuming an intrinsic aspect ratio of 10:1 for the disk. The lower limit is if we assume that the galaxy is thin. We have adopted a value of . The Holmberg diameter is barely reached by the observations and has a value of kpc.
Table 1 shows the results of the photometry. Given the seeing differences we only determine the photometry for the center of the galaxy (a box), the bulge, the disk, and the galaxy as a whole. To define the regions used for photometry we took an average of the , , , and frames to make masks and used the same area for all bands in the photometry. The values are corrected for foreground extinction using the prescription of Schlegel, Finkbeiner, & Davis (1998); but are not corrected for internal extinction (see below). The background was determined by first masking all sources visible in any of the four bands, then estimating the average and gradient due to the cD halo from the remaining pixels on either side of the nucleus both above and below the disk. We estimate the photometry to be accurate to mag given the difficulty to estimate the local “background” levels in the presence of faint cluster galaxies and the large envelope of the cD galaxy that dominates Abell 2029. Similarly, we estimate the colors to be accurate to 0.05 – 0.1 mag.
The colors are consistent with those of Scd galaxies given by Frei & Gunn (1994) with the -corrections interpolated linearly to . For example, the global color is when 0.82 (1.14) is the corresponding “average” color of an Scd (Sbc) galaxy. The color is a bit blue (0.34) where 0.53 is expected for a typical Scd galaxy (0.77 for an Sbc), and could be affected by a contribution from H as well. The color is even bluer (1.17 when 1.37 is expected for an Scd galaxy and 1.76 for an Sbc), which might be an indication of recent star formation.
These colors are uncorrected for internal extinction which would, of course, make them even bluer. There is a long-standing debate on the optical depth of (late) spiral galaxies (e.g., Masters, Giovanelli, & Haynes, 2003, and references therein). The correction to a face-on orientation is usually parametrized in terms of the aspect ratio as
| (1) |
where is the correction to the I band magnitude, and are the apparent semi-major and semi-minor axes of the galaxy, and is an empirical coefficient. Because our galaxy is about 2 magnitudes dimmer than , (Giovanelli et al., 1994) leading to a correction of . For comparison, we have used the two relations offered by Tully and collaborators (Tully et al., 1998) to compute the same correction, which in our case lead to values of using the relation that depends on the absolute magnitude, and using the dependence on the velocity width. Given the statistical character of these prescriptions, we find their agreement quite encouraging. Adding a -correction of magnitudes from Frei & Gunn (1994) leads to an band estimate of the luminosity of . The expected stellar mass-to-light ratio of UZC J151054 is in solar units (de Jong, 1996) yielding an estimate of the total stellar mass of the galaxy of .
We have opted to use the average of both of the Tully et al. (1998) methods to similarly estimate a correction to the band photometry, which yields a value of . This allows us to estimate an absolute magnitude of (which includes a -correction of from Frei & Gunn, 1994) corrected to face-on but not for any residual effects from scattering or internal extinction. Our (final) estimate of the band luminosity of this galaxy is thus . The expected stellar mass-to-light ratio of UZC J151054 is in solar units (de Jong, 1996). Thus, the total stellar mass of the galaxy is expected to be in good agreement with the estimate from the band photometry.
4. H i
The H i spectrum shows an asymptotic velocity of km s-1. Although the H i emission often extends beyond the optical emission, we derive a lower limit to the total mass of the galaxy by estimating the mass internal to the optical radius of 12 kpc as .
Integration of the H i spectra yield estimates of the total fluxes of Jy km s-1 and Jy km s-1 for polarizations one and two, respectively, where the errors are derived from the scatter of the line-free channels and do not include calibration errors. As seen in Figure 3, the second polarization is corrupted by RFI, so that we shall ignore it henceforth (although it does offer confirmation of the velocity extent of the H i). After our analysis was completed, we have received the spectrum from Haynes et al. (1997) electronically. Their measured total flux is Jy km s-1, which we have been told should be increased by perhaps 5% to account for pointing errors and should be accurate to about 15% (M. Haynes, private communication). Given our short integration, we consider the agreement of the two derived total fluxes somewhat coincidental.
Nevertheless, we are encouraged to derive an H i mass from our spectrum and arrive at a value of which is accurate to 10%. Thus, the galaxy shares in the common “dark matter” problem with ratios of , (in solar units). The total of the stellar and H i mass is approximately , which is still about five times smaller than the total mass from the rotation velocity. Thus, the dark matter mass of the galaxy is approximately , out to a radius of kpc.
We have also used the “Baryonic Tully-Fisher” relation derived by McGaugh et al. (2000) to estimate the distance to UZC J151054. Given the uncertainty that recent star formation adds to the band determination of the stellar mass, we have used the stellar mass derived above from the band photometry (). Equation 2 of McGaugh et al. (2000) yields an estimate of the mass in stars and gas of . Correcting the H i mass for the He fraction yields a value of and a luminosity distance of =83 Mpc, in good agreement with the Hubble flow distance given the uncertainties and the unknown peculiar velocity of UZC J151054. Using a value of appropriate for an 8 Gyr Sc galaxy with approximately continuous star formation (de Jong, 1996), instead of our adopted value of 1.7 (corresponding to a 12 Gyr Sc galaxy) would lead to =87 Mpc.
5. X-Ray Absorption
Examination of Figure 1 shows that the X-ray absorption region is roughly the size of the optical disk of UZC J151054. Comparison of the hard (1.0–7.0 keV) and soft (0.3–1.0 keV) X-ray images indicates that the absorption is more prominent in the soft X-ray band as expected for photoelectric absorption. The 0.3–1.0 keV image contains 82 counts in the region of absorption, compared to 197 and 184 counts in the same size region above and below the absorption feature. This corresponds to a detection of the foreground spiral galaxy absorption feature. A careful comparison of the position angle of the optical galaxy and the X-ray absorption feature shows that the X-ray absorption may be slightly tilted () relative to the galaxy disk (Figure 1) . Such a misalignment could be the result of a warp in the HI disk relative to the optical disk in UZC J151054.
The extent of the absorption region was determined by taking cuts through the X-ray images. We used square regions of width 36 running roughly east to west (PA=872) along the X-ray absorption feature and determined the counts in each region from the 0.3–1.0 keV image. The box height is approximately the size of the optical spiral disk and the width was set small enough to allow several boxes to be placed along the absorption feature with sufficient counts to determine the extent of the absorption region. In Figure 4 we show a series of exposure and background corrected counts from 34 regions running east to west along the absorption feature. Figure 4 also shows the results from shifting the boxes up and down by one box height and determining the counts both above and below the absorption feature.
In Figure 5 we show a similar plot for a set of 31 regions of size 55″ 05 running north-south parallel to the disk. Note that the PSF of the ACIS-S3 detector at these positions and energies is mainly determined by the pixel size on the detector, and the 80% encircled energy radius is about 07. Thus, the absorption from the disk is resolved perpendicular to the disk.
The limited number of counts in the absorption region preclude any detailed modeling of the spatial structure of the absorption. The full width of the absorption along the disk is about 56″ (25 kpc). The dashed vertical lines in Figure 4 show the approximate I-band optical extent of the galaxy. The width of the absorption feature agrees fairly well with the optical width of the galaxy. In some ways, this might be surprising, since many spiral galaxies have H i disks which extend beyond their optical disks. On the other hand, the X-ray absorption at these energies is mainly due to heavy elements (primarily oxygen), and the abundances of heavy elements are likely to be low outside of the optical disk. In the vertical direction, the width of the absorption disk is about 5″ (2.2 kpc), after making a small correction for the PSF of the ACIS-S3. The size and strength of the X-ray absorption can also be characterized by the equivalent width, or the width of a region with complete absorption and the same reduction in flux as that of the spiral galaxy absorption feature. Using the 0.3–1.0 keV data, we determine an equivalent width of 34″ (15 kpc) along the disk, and 3″ (1.3 kpc) perpendicular to it. These values are smaller than the full width of the feature because the absorption is not complete.
To analyze in more detail the absorption due to the spiral disk, we extracted spectra from the feature and a larger surrounding “background” area. The spectra were binned to a minimum of 25 cts/bin to provide good statistics. The region of the absorption feature and the surrounding thermal ICM were fit in XSPEC with a WABS * ZWABS * MEKAL model after applying a correction for the quantum efficiency degradation. The MEKAL model represents the background cluster emission, while the ZWABS is the absorption from the foreground spiral. The Galactic column in WABS was set to cm-2 as determined from Dickey & Lockman (1990)222Typical variations in the Galactic column determined from Dickey & Lockman (1990) around the location of UZC J151054 () are less than 10%. We also allowed the Galactic column to be free in the fits and found a best fit value lower than the Galactic value ( = cm-2). This low Galactic hydrogen column density is consistent with that found by Lewis, Stocke, & Buote (2002) for the outer regions of the cluster. Using the lower Galactic column for the fits results in less than a 5% change in the excess absorption column due to the foreground spiral galaxy.. In the fit to the absorption feature, the temperature and metallicity for the cluster emission were fixed at the value determined by the surrounding “background” region, but the excess absorption was allowed to vary. The surrounding thermal ICM is best fit with a temperature of 7.1 keV (/d.o.f. = 141/175), slightly lower than the deprojected temperature found by Lewis, Stocke, & Buote (2002). The model fits in XSPEC were taken for the energy range of 0.5–10.0 keV. We extended the model fits down to 0.3 keV and found consistent results although there were significantly larger residuals at the lowest energies in the fits of the surrounding region.
The best fit model (/d.o.f. = 152/193) to the X-ray spectrum (Figure 6) gives an excess absorbing column (with 90% confidence interval) of cm-2. At these columns, almost all of the absorption is due to heavy elements, particularly oxygen. Thus, this measurement is most directly interpretable as a measurement of the column density of oxygen (in any form containing K-shell electrons) of cm-2 (assuming the metallicity of Anders & Grevesse, 1989). The column density of hydrogen can thus be written as cm-2, where is the oxygen abundance in units of the solar abundance. This corresponds to a mass of , assuming that the absorber is spread uniformly over the 556 by 36 region covered by the disk of the galaxy. Of course, it is likely that the interstellar gas and dust in UZC J151054 are concentrated to the center of the galaxy and the middle of the disk, and that the absorption is not uniform. Thus, it is likely that the column density and derived mass are really lower limits to the total amount of absorbing material. We note that the hydrogen mass determined from the X-ray absorption (assuming a uniform absorber and solar abundances) is about a factor of 5 smaller than the atomic hydrogen mass from the 21 cm observations. This may be due to a non-uniform distribution of the absorber, or due to a lower than solar metallicity in the interstellar medium (ISM) in UZC J151054.
The X-ray absorption feature appears to be limited vertically to the approximate width of the optical disk in UZC J151054. In order to limit the absorption due to material in the halo of this galaxy, we also extracted the spectra from regions which were 556 by 36 but shifted by 36 above and below the disk. The spectra of the two regions above and below the disk were combined, and fit in the same way as the absorption from the disk. The best-fit model had an excess absorption of cm-2 (/d.o.f. = 173/217). Since the excess is consistent with zero at the 90% confidence level, we interpret this measurement as a 90% confidence upper limit of cm-2.
6. Discussion
We have found a deep X-ray absorption feature due to a foreground spiral galaxy seen in projection against the core of the galaxy cluster Abell 2029. Based on the 0.3–1.0 keV data, the X-ray deficit associated with the spiral disk of UZC J151054 is detected at 8 significance. The X-ray absorption is strongest at low energies, as expected for photoelectric absorption. From the X-ray spectrum of the absorption feature, we find an absorbing column of cm-2, assuming solar abundances. This corresponds to a mass of of hydrogen in the spiral disk, if the absorber is uniformly distributed over the region of the spiral disk. If the absorber is not uniform, as seems more likely, the required mass of the absorber is higher.
An analysis of the optical data shows that the galaxy colors are consistent with those of an Scd galaxy, while the axial ratio gives an inclination of . We fail to detect radio continuum emission from UZC J151054.6+054313 at a reasonably low level. Our limit of Jy is consistent with the lack of significant emission in the IR; the galaxy is barely detectable in the 2MASS survey images (Cutri et al., 2001).
The detected X-ray absorption is smaller than that expected from the amount of neutral hydrogen detected in 21-cm emission from the disk of UZC J151054. This may indicate that the ISM in UZC J151054 is not uniformly distributed over the absorption region, or that the metallicity is low. The X-ray absorption measurements also provide an upper limit on any additional diffuse gas or dust in this galaxy. We note that X-ray absorption is relatively insensitive to the physical state of the diffuse material. Any form of gas or dust at temperatures below K would produce absorption. At the columns of interest here, most of the absorption is due to the K-shell electrons in oxygen. The measurements directly give the column density of oxygen, rather than hydrogen. Thus, the limits of the mass of the absorbing material depend inversely on the abundance of oxygen relative to hydrogen.
The mass of the absorbing material we detect, , is much less than the total mass of the galaxy or the dark matter mass, . Thus, our measurements limit the possibility that the dark matter is diffuse baryonic gas. If the dark matter is in the form of a roughly spherical halo, then our limits on the absorption outside the disk yield a limit on the mass of , which is about a factor of three smaller than the dark matter mass. If the dark matter is in the disk and is uniformly distributed, then the limit on its mass is certainly less than the total absorbing mass determined for the disk of . Thus, the dark matter cannot be diffuse gas, unless it either has very low metal abundances or is very inhomogeneous in its distribution.
In recent years, there have been a number of suggestions that dark matter in galaxies is indeed baryonic, and is due to dense clouds of gas (e.g., Pfenniger, Combes, & Martinet, 1994; Ortwin & Silk, 1996). This gas might either be located in a thick disk (Pfenniger et al., 1994) or in a more spherical halo (Ortwin & Silk, 1996). However, in either model, the clouds of gas are rather small and dense, and have a small covering factor. Thus, the maximum optical depth for absorption across the galaxy is limited by this covering factor. As a result, our measurements for UZC J151054 do not refute or strongly constrain these theories.
Finally, we note that a much longer (80 ksec) Chandra observation of the center of Abell 2029 is planned for Cycle 5. Among other aims, this observation should allow the absorption feature due to UZC J151054 to be studied in more detail. It would also be useful to have a 21 cm line image of the galaxy to compare the emission line with absorption from the interstellar medium.
References
- Anders & Grevesse (1989) Anders, E. & Grevesse, N. 1989, Geochimica et Cosmochimica Acta, 53, 197
- Baars et al. (1977) Baars, J. W. M., Genzel, R., Pauliny-Toth, I. I. K., & Witzel, A. 1977, A&A, 61, 99
- Bennett et al. (2003) Bennett, C. L., et al. 2003, ApJS, 148, 1
- Cutri et al. (2001) Cutri, R. M., et al. 2001, Explanatory Supplement to the 2MASS Second Incremental Data Release, The Two Micron All Sky Survey at IPAC Website: http://www.ipac.caltech.edu/2mass/releases/second/doc/explsup.html
- Dale & Uson (2000) Dale, D. A., & Uson, J. M. 2000, AJ, 120, 552
- de Jong (1996) de Jong, R. S. 1996, A&A, 313, 377
- Dickey & Lockman (1990) Dickey, J. M., & Lockman, F. J. 1990, ARA&A, 28, 215
- Dressler (1978) Dressler, A. 1978, ApJ, 226, 55
- Dressler (1981) Dressler, A. 1981, ApJ, 243, 26
- Falco et al. (1999) Falco, E. E., Kurtz, M. J., Geller, M. J., Huchra, J. P., Peters, J. Berlind, P., Mink, D. J., Tokarz, S. P., & Elwell, B. 1999, PASP, 111, 438
- Frei & Gunn (1994) Frei, Z., & Gunn, J. E. 1994, AJ, 108, 1476
- Giovanelli et al. (1994) Giovanelli, R., Haynes, M. P., Salzer, J. J., Wegner, G., Da Costa, L. N., & Freudling, W. 1994, AJ, 107, 2036
- Haynes et al. (1997) Haynes, M. P., Giovanelli, R., Herter, T., Vogt, N. P., Freudling, W., Maia, M. A. G., Salzer, J. J., & Wegner, G. 1997, AJ, 113, 1197
- Lewis, Stocke, & Buote (2002) Lewis, A. D., Stocke, J. T., & Buote, D. A. 2002, ApJ, 573, L13
- Masters, Giovanelli, & Haynes (2003) Masters, K. L., Giovanelli, R., & Haynes, M. P. 2003, AJ, 126, 158
- McGaugh et al. (2000) McGaugh, S. S., Schombert, J. M., Bothun, G. D., & de Blok, W. J. G. 2000, ApJ, 533, L99
- Ortwin & Silk (1996) Ortwin, G., & Silk, J. 1996, ApJ, 472, 34
- Pfenniger et al. (1994) Pfenniger, D., Combes, F., & Martinet, L. 1994, A&A, 285, 79
- Sarazin, Wise, & Markevitch (1998) Sarazin, C. L., Wise, M. W., & Markevitch, M. L. 1998, ApJ, 498, 606
- Schlegel et al. (1998) Schlegel, D. J., Finkbeiner, P. F., & Davis, M. 1998, ApJ, 500, 525
- Tully et al. (1998) Tully, R. B., Pierce, M. J., Huang, J., Saunders, W., Verheijen, M. A. W., & Witchalls, P. L. 1998, AJ, 115, 2264
- Uson et al. (1991) Uson, J. M., Boughn, S. P., & Kuhn, J. R. 1991, ApJ, 369, 46


| Region | Area | ||||
|---|---|---|---|---|---|
| (arcsec2) | (mag) | (mag) | (mag) | (mag) | |
| Center | 36 | 18.70 | 18.21 | 17.70 | 17.31 |
| Bulge | 58 | 18.55 | 18.05 | 17.59 | 17.20 |
| Disk | 212 | 18.60 | 18.31 | 17.92 | 17.66 |
| Galaxy | 270 | 17.82 | 17.42 | 16.99 | 16.65 |