X-ray Scattering Halos from the Galactic Center:
Implications for Diffuse Emission Around Sgr A
Abstract
We consider the absorption and scattering of X-rays observed from the Galactic center. One objective is to characterize the intrinsic X-ray emission from the central black hole, Sgr A, in its quiescent and flaring states — crucial for our understanding of the accretion physics of supermassive black holes. We correct the fluxes observed by the Chandra and XMM telescopes for absorption and scattering, but limited knowledge about the properties of the intervening gas and dust causes large uncertainties. We use realistic models for the dust grain size distribution, consistent with many other observational constraints, as well as reasonable models for the gas and dust abundances and spatial distributions. Since much of the intervening dust is relatively close to Sgr A, the scattered halo of X-ray photons is very concentrated: its intensity can dominate the point spread function of Chandra inside 1″, and so affects estimates of the point source flux. It also causes an apparent broadening of the radial intensity profiles of Galactic center sources, and observations of this broadening can therefore help constrain models of the line of sight distribution of the dust. We estimate that the combined scattering halos from observed Galactic center sources within of Sgr Acontribute up to of the observed diffuse emission in this region. Unresolved sources may make an additional contribution. Dust-scattered photons suffer a time delay relative to the photons that arrive directly. For dust that is 100 pc towards us from the Galactic center, this delay is about 1000 s at angles of 1″ and 100 ks at 10″. We illustrate how the evolution of the scattering halo following X-ray flares from Sgr Aor other sources can also help to constrain the dust’s line of sight distribution. We discuss the implications of X-ray scattering halos for the intensity of diffuse emission that has been reported within a few arcseconds of Sgr A: in the most extreme, yet viable, model we consider, of it is due to dust scattering of an unresolved source. The remainder results from an extended source of emission.
1 Introduction
Our Galaxy’s central supermassive black hole provides an unprecedented opportunity for studying the accretion physics of these objects, which are thought to power active galactic nuclei. Since we must view the Galactic Center (GC) through a large column of gas and dust, observations are restricted to wavelengths in and longer than the near infrared (NIR) and to X-rays harder than about 2 keV.
Near infrared observations reveal a dense stellar cluster (Genzel et al. 2003a, and references therein), whose inner members have high proper motions, consistent with the presence of a black hole of mass (Schödel et al. 2002; Ghez et al. 2003a). Its location, as derived from stellar orbits, coincides with the compact, nonthermal, weakly variable, linearly and circularly polarized radio source Sgr A(Balick & Brown 1974; Bower et al. 2003, and references therein) and a flaring X-ray point source discovered by the Chandra X-ray Observatory (Baganoff et al. 2001; 2003, hereafter B01 and B03, respectively). The X-ray emission from this source is extended on scales comparable to the Bondi radius, pc. Recently a flaring NIR source has been detected at this position (Genzel et al. 2003b; Ghez et al. 2003c).
The spatial and spectral structure of the X-ray emission may help to constrain the diverse set of theoretical models that have been proposed for the accretion onto the black hole (e.g., Falcke, & Markoff 2000; Melia, Liu, & Coker 2000; Liu & Melia 2002; Quataert 2002; Yuan, Markoff, & Falcke 2002; Yuan, Quataert, & Narayan 2003; Quataert 2003). It has been argued that the low luminosity of Sgr Awith respect to its expected classical Bondi accretion luminosity is evidence for very inefficient accretion mechanisms (e.g. Narayan 2002, and references therein). Models that attempt to explain the arcsecond scale diffuse emission via accretion onto a clustered population of unresolved neutron stars have also been proposed (Pessah & Melia 2003). Nayakshin & Sunyaev (2003) proposed that the X-ray flares may result from the interaction of stars with a cold gas disk orbiting close to Sgr A.
In this paper we consider the scattering and absorption of X-rays from the Galactic Center. In particular we emphasize the importance of scattering in producing extended emission — “halos” — on arcsecond scales. Since much of the intervening dust is located close to the GC, these halos are much more concentrated than those around sources observed along more typical Galactic lines of sight. We assess the contribution made by the concentrated scattering halos of Galactic center sources to the diffuse emission seen within of Sgr A. The halos are so concentrated that they can dominate the intensity of the Chandra point spread function (PSF) inside 1″, so they affect determinations of the point source flux and thus intrinsic luminosity. They also affect the estimates of the intensity of emission due to diffuse gas close to the Bondi radius, and thus estimates of the gas density and the black hole’s Bondi accretion rate.
We consider the distribution of gas and dust towards the Galactic center in §2. We then use X-ray observations and a model for how dust and gas absorb and scatter X-rays to calculate the intrinsic X-ray luminosity and spectrum of Sgr A(§3). This involves a correction for dust scattering that requires a calculation of the angular intensity profiles of scattering halos as a function of energy. In §4 we calculate the total intensity of the scattering halo, including examples of the delayed halos from flares, and compare to observations. We discuss the implications of our results and conclude in §5.
2 The Gas and Dust Distribution to the Galactic Center
To calculate X-ray scattering we require a model for the spatial distribution of dust along the midplane of the Galaxy from the Sun to the Galactic center. The total column of gas and dust also affects the amount of absorption. We take the distance from the Sun to the Galactic center to be 8 kpc (Reid 1993). We assume a uniform metallicity and dust-to-gas ratio, taken to be 1.5 times the value for the local ISM, consistent with Galactic abundance gradients measured in H II regions (Giveon, Morisset, & Sternberg 2002).
2.1 Spatial Distribution
Based on studies of the radial distribution of the atomic and molecular gas (e.g. Binney & Merrifield 1998, Fig. 9.19) we approximate the distribution of gas from the main Galactic disk via a Gaussian located at kpc and with a HWHM of 2 kpc. We denote the fraction of the total column that is in this outer component by . This approximation underestimates the local ISM density close to the Sun, but this material makes little contribution to inner X-ray scattering halos, on scales of arcseconds.
A second component of the total column is the material in the inner few hundred parsecs of the Galaxy, and we denote the fraction of material in this region by . The properties of this gas have been constrained by data from IRAS (Infrared Astronomical Satellite) and COBE (Cosmic Background Explorer) observations (Launhardt, Zylka, & Mezger 2002). A gas disk with typical densities in its diffuse component of is inferred to extend out to . An inner, denser, inclined, circumnuclear disk is seen as a separate dynamical component (Güsten et al. 1987; Marr, Wright, & Backer 1993) extending from . However, most of this material does not intersect our line of sight to Sgr A. The distribution of gas in these regions is very inhomogeneous: within the parsec disk are giant molecular clouds, such as the “50 km/s cloud” and the “20 km/s cloud”, which lie close to the line of sight to Sgr A. Vollmer, Zylka, & Duschl (2003) estimate that the former is closer to us than Sgr A, while the latter is spread out over a larger distance with its densest region closer than Sgr A. The centroids of these clouds are within of our Sgr Asight line. There is also evidence for clumps of hot molecular gas in the circumnuclear disk on scales (McGary, Coil, & Ho 2001), and even inside the central parsec (Herrnstein & Ho 2002), so that the total gas column to a particular location in the central region may show significant variation. In the study of Herrnstein & Ho (2002) structure was seen on scales all the way down to the beam size of 10″.
As a first attempt to describe this complicated density structure, we shall approximate the radial distribution of the inner component with a Gaussian centered at various distances, , towards us from Sgr A, and with a HWHM equal to . As a fiducial case we take pc, but we also consider models with and 25 pc. In all cases we assume a small central cavity that is free of dust. We take the radius of this cavity to be 2 pc, and then adjust the normalizations of the Gaussians so that the total column from 2 pc to 8 kpc is equal to the adopted overall totals. Individual gas clumps and clouds may have a column density comparable with the total through the more diffuse regions (below). To allow for the possibility of such an enhancement we consider models with a range of column densities in the smoothly distributed component.111Note that the scattering halos due to material inside the inner few parsecs are typically smaller than the size of the point spread function (PSF) of Chandra, and thus do not significantly affect the observable halo profile.
2.2 Estimates of the Total Column Density
The total columns of gas and dust to the GC are uncertain. One of the most common methods used to measure these quantities is by estimation of the K band extinction by simultaneously fitting near-IR photometry of GC stars with spectra of a particular stellar type and with a certain amount of reddening (Becklin et al. 1978; Lebofsky, Rieke, & Tokunaga 1982; Sellgren et al. 1987; Rieke, Rieke, & Paul 1989, hereafter RRP). This method requires knowledge of the extinction law in the near-IR (e.g. Rieke & Lebofsky 1985) and accurate models for the intrinsic stellar spectra. The main discriminant for the stellar spectra are the strengths of the CO absorption bands: they become stronger for decreasing temperature and increasing luminosity. absorption at the edges of the K band can help distinguish between M giants and K supergiants, because the strength of this absorption decreases with increasing luminosity. Typically, solar metallicity stars have been used as standards for late-type spectra (e.g. Kleinmann & Hall 1986). One possible source of systematic error is the effect of elevated metallicities, which would tend to increase the strength of the CO and features for a given luminosity and surface temperature.
An alternative to fitting detailed stellar spectra is to assume that certain, particularly blue, sources have Rayleigh-Jeans spectra: this method was used by RRP for the sources making up the IRS16 complex, which have subsequently been identified as hot, emission line stars (e.g. Eckart et al. 1995; Krabbe et al. 1995; these observations also show that IRS13, discussed below, is a complex dominated by hot He stars), however the derived dust columns are still somewhat sensitive to the choice of extinction law (see below).
A third method to measure extinction is from the ratio of Br to Br recombination lines. The difficulties here are (1) the need to assume a particular theoretical ratio for the intrinsic line ratio, e.g. based on case B recombination theory at a particular density and temperature, and (2) the measurement of the line ratios in what is a very complicated and crowded region of the sky.
The relatively bright infra-red sources closest to Sgr Aare the IRS16 complex, IRS13, and IRS7, which have projected separations from Sgr Aof , 0.13, and 0.20 pc. The values of adopted by RRP for these sources were 3.4, 3.5, 4.1, respectively, where the value for IRS16 is an average of the 7 components reported by RRP. The extinction law used by RRP has between and , with . The Milky Way dust models of Weingartner & Draine (2001, hereafter WD01) with have . If the extinction at K is derived from the degree of reddening of a Rayleigh-Jeans spectrum, then the values of derived from WD01 models are times that derived by RRP. Similar corrections may be expected for determinations of from fitting more realistic stellar spectra. Draine (2003a) has discussed the extinction per H nucleon in regions of different . Using from Draine (2003a) and the grain size distributions of WD01, we find . In the fiducial, “local Milky Way metallicity” case of the WD01 model with the effective H column densities for the three GC sources described above are thus . For the models with the column densities are different by factors of 1.09 and 0.92, respectively. If the effective metallicity is greater than solar by a certain factor, then these estimates would be reduced by the same factor, assuming a constant dust to metals ratio and for fixed grain properties.
Stars such as S0-2, which are very close to Sgr Ain both the plane of the sky and in line of sight dimension, are much fainter than the brighter IR sources discussed above, so the continuum slopes of their published spectra (Ghez et al. 2003b) are not yet reliably determined (A. Ghez 2003, private communication). With this caveat in mind, the K band extinction can be estimated assuming an intrinsic Rayleigh-Jeans spectrum (which is a reasonable assumption) and assuming a K band continuum spectrum with . These values yield for the RRP normalization, about 50% greater than the value estimated using the same technique towards IRS16.
The above range of values for the extinction appear to be fairly typical of the GC region on larger scales. Using the same reddening law as RRP, Figer et al. (1998) find towards the Quintuplet star cluster, located 30 pc in projection from Sgr A. Lebofsky & Rieke (1987) found the extinction over a 24 square arcminute region around the GC was spatially variable, but never less than . Sellgren et al. (1987) (using so that values of are about a factor of 0.85 of those derived using of RRP) reported that their extinction results were consistent with a uniform component with and a variable component due to material near the GC with . These results are consistent with the recent model of Launhardt et al. (2002), who find () due to dust in the outer Galactic disk and a similar value for extinction due to dust in the GC region itself.
We note that the clumps reported by Herrnstein & Ho (2002) are estimated (but with large uncertainties) to have , which would correspond to extinctions a factor of 30 larger than typically reported, if they contain typical dust grain populations.
As we shall describe later, estimates of the total column density have also been made by fitting models for the X-ray emission from Sgr Ato observations. Porquet et al. (2003) found , corresponding to for . B01 found , i.e. about a factor of 3 or 4 smaller than Porquet et al. (2003).
Given the uncertainties in the estimates of the total gas and dust columns along the line of sight to the GC, and since it is clear that there is some variation towards different objects in this region, we shall consider a range of different density distributions and total column densities. As an average for the gas along the line of sight to the GC, we adopt a metallicity of 1.5 times solar and a dust-to-gas mass ratio of 1.5 times the local interstellar value, which is taken to be 0.008. This metallicity enhancement is consistent with ISO (Infrared Space Observatory) observations of Galactic H II regions (Giveon, Morisset, & Sternberg 2002). We assume depletions into dust grains of 67% for C, 20% for O, 90% for Mg, Si, and Fe, and 0% for N, Ne, and S (WD01). For the fiducial model we set , which for the WD01 grain model with and the above metallicities yields . For this model we also set . We shall also consider a model with , so that is twice the above value, and which has and : i.e. we have added material only to the inner component.
The dust model with has C/H = 90 ppm in polycyclic aromatic hydrocarbons (PAHs) and consists of a mixture of carbonaceous grains and amorphous silicate grains. As discussed by Li & Draine (2001), the carbonaceous grains have the properties of PAH molecules when they contain C atoms, and the properties of graphite particles when they contain C atoms. By altering the size distributions of the carbonaceous and silicate particles, the dust model appears to be able to reproduce observed extinction curves in various Galactic regions, and in the Large and Small Magellanic Clouds. This dust model, when illuminated by starlight, produces infrared emission consistent with the observed emission spectrum of the interstellar medium (Li & Draine 2001, 2002).
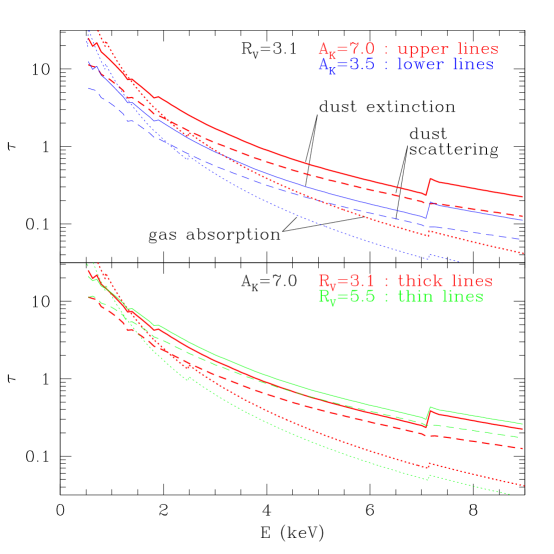
For the amorphous silicate grains and the carbonaceous grains we employed the dielectric functions recently estimated by Draine (2003b) and calculated the scattering using Mie theory. The X-ray absorption and scattering properties of this model are consistent with observations towards Nova Cygni 1992 that probe typical dust in the local diffuse ISM (Draine & Tan 2003). In Figure 1 we show the energy dependence of the optical depth (due to photoelectric absorption by gas and extinction by dust) of our models of gas and dust toward the GC. The contribution of the dust extinction due to scattering is also shown.
Lutz et al. (1996) reported extinction towards the GC in the 4-8 region of the spectrum exceeding that expected for standard graphite-silicate mixes (e.g. Draine 1989), which may indicate that additional species are present, such as iron/metal sulphides or metal oxides, or carriers related to the production of the 3 ‘ice’ absorption features that are seen in the spectra. From an analysis of such absorption features, Chiar et al. (2000) found evidence for enhanced molecular material along the line of sight to Sgr Aas compared to the Quintuplet star cluster.
A shift in the grain size distribution toward larger grains, with increased values of , is expected in the dense, cold conditions of the cores of giant molecular clouds. Since these conditions may apply to a significant amount of the gas and dust towards Sgr A, we shall also consider the effect of using models with for the entire dust column. Dust models with larger grains yield lower values of for a given and metallicity. For example, the model of WD01 gives columns that are a factor of 0.70 smaller than the case.
Given an observed X-ray spectrum we can use the models shown in Figure 1 to estimate the form of the intrinsic spectrum (§3). However, we shall also see that when the flux from a particular source is defined as all photons arriving from within a certain angular radius (e.g. on arcsecond scales for Chandra), then a substantial fraction of the photons that are scattered can remain in this source region and must be accounted for.
3 The Intrinsic X-Ray Spectrum of Sgr A
Utilizing the high spatial resolution () of Chandra, B01 and B03 reported the first detection of an X-ray source that can be convincingly associated with Sgr A. B03 fit the observed spectrum (derived from counts within 1.5 of the source from the first 40.3 ks observation) with an absorbed power-law model, with with and (90% confidence interval). However, these calculations did not account for dust scattering (B01), leading to an overestimation of the column density necessary to produce the observed soft X-ray cutoff. B01 reported results from a second observation with effective exposure time of 35.4 ks, which included a ks flare. From a joint analysis of the quiescent emission from the two epochs and the flare emission from the second epoch, B01 derived , , and , where the subscripts and refer to the quiescent and flaring states, respectively. Models of the spectra of an absorbed optically thin thermal plasma (Raymond & Smith 1977) yielded similar column densities with (B03). Systematic errors due to the energy dependence of the enclosed energy fraction inside 1.5 and of charge transfer inefficiency effects could lead to an overestimation of by , an underestimation of the intrinsic X-ray luminosity by , and an overestimation of (B03).
XMM-Newton observed a bright 3 ks flare from Sgr A(Porquet et al. 2003) and from these observations were derived , and . The spectrum could also be fit with models based on bremsstrahlung continuum, thermal blackbody, and optically thin plasma emission.
The method of estimating the intrinsic spectrum of a source typically involves counting all the photons arriving inside a given circular area around a source (a radius of was used for the Chandra observations of the quiescent state), and then subtracting off a background flux, estimated from a surrounding annulus. Given an assumed dust and gas column, a correction is then made to estimate the intrinsic flux that would be received if there was no absorption. However, for gas and dust distributed close to the source, much of the scattering halo is located very close to the PSF, and needs to be accounted for.
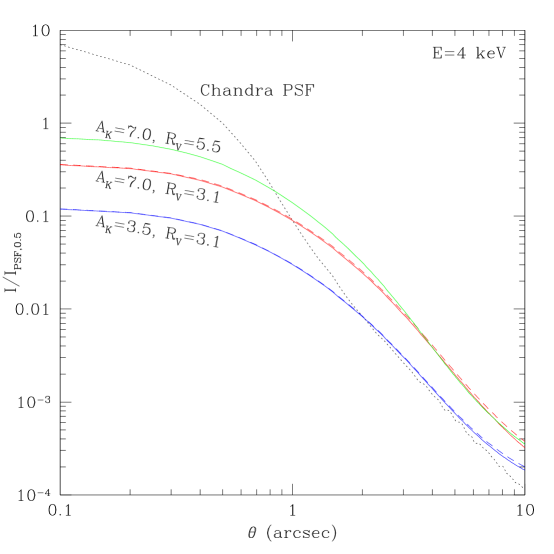
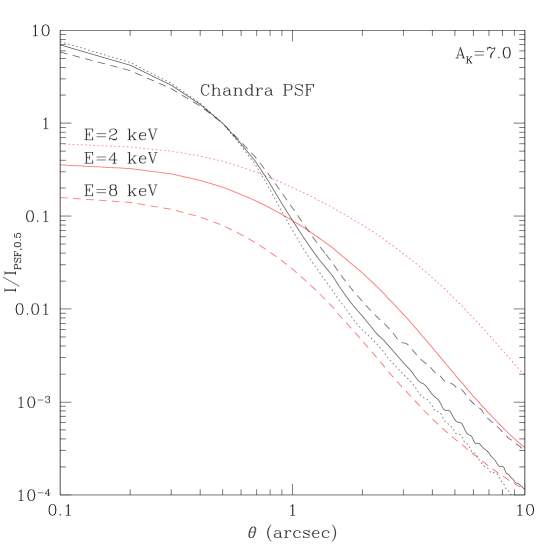
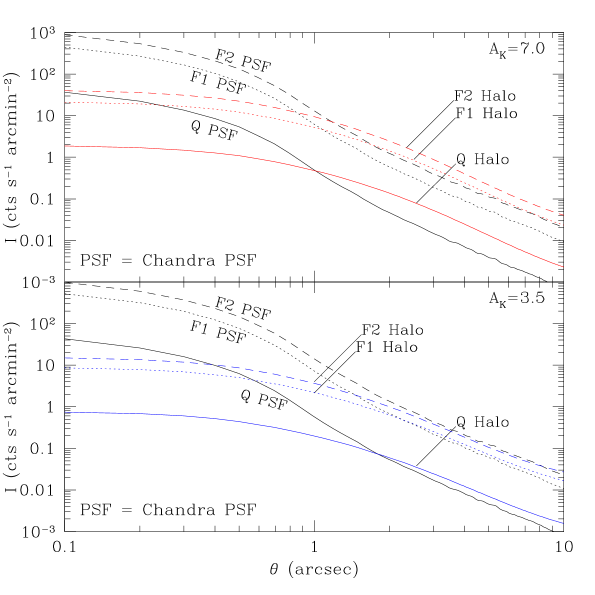
Consider a source observed at 4 keV. For the model with that has , we have , , and . Figure 2 shows the radial intensity profiles of dust-scattered halos of a monochromatic source at 4 keV for the adopted models for the density distribution to the GC, i.e. for and . The halo profile was convolved with the on-axis energy-dependent Chandra PSF, derived from the CIAO (Chandra Interactive Analysis of Observations) software. We see that the scattering halos can dominate over the PSF inside 1″. In this figure we also show the dependence on the scattering halo on the grain size distribution, as parameterized via : a model with a larger value of , corresponding to larger average grain sizes, produces a halo that is more concentrated inside a few arcseconds. The halos at several different energies are compared in Figure 3: at lower energies the halo intensities are stronger relative to the PSF.
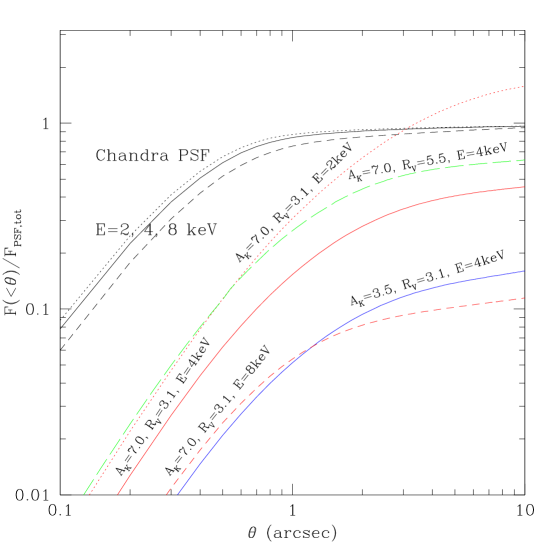
The fraction of enclosed flux in the scattering halo, relative to that in the PSF is shown in Figure 4. These results allow one to correct for the contribution that a scattering halo makes to the direct flux from a source, given the angular scale inside which the direct flux of a particular observation is estimated, i.e. the observed flux inside an angle is the sum of the unscattered flux and the part of the scattered flux that lies inside .
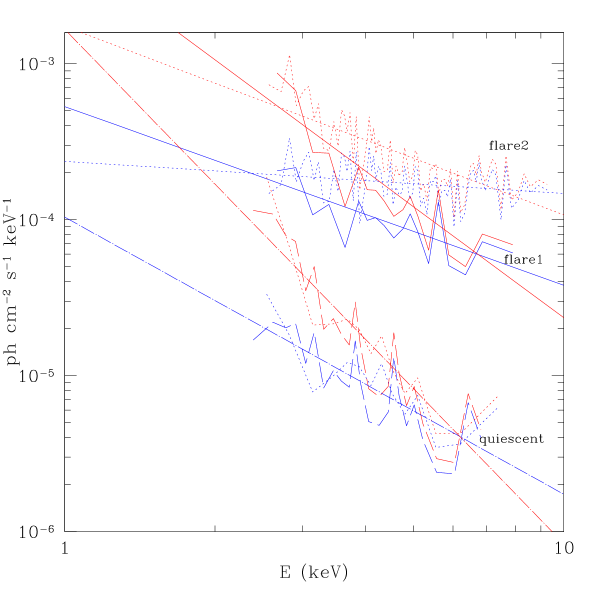
For absorption and scattering with our fiducial density models, we calculate the intrinsic spectra of Sgr Ain its quiescent and flaring states, based on the observed fluxes and appropriate extraction radii (Figure 5 and Table 1). From these results we see that the uncertainty in the intrinsic X-ray luminosity of Sgr Ais set by the uncertainty in the extinction, as parameterized by . This also sets the uncertainty in the slope of the spectrum, e.g. when fit by power-law models. The quiescent state 2-10 keV luminosity is a few. The two flares reported by B01 and Porquet et al. (2003) are about a factor of 10 to 30 times more luminous in this energy range, when averaged over the flare durations. We estimate that the peak luminosity of the flares is a factor of 1.3 and 2 times greater than the mean values quoted in the table. We tend to favor a harder intrinsic spectrum for the flare than Porquet et al., who find their best fitting power-law model has (and ), however at least part of this discrepancy is due to the fact that our model uses a much smaller column of gas: for the cases respectively. Part of this difference is due to our use of abundances that are a factor of 1.5 times greater than the local interstellar values, and part may be due to differences in the grain models, including our preference to normalize to the observed extinction in the K band, rather than the canonical visual extinction of 30 mag. Our results are broadly consistent with those of B01.
| State of | bbEffective extraction radius used to define source spectrum. | () | ||||
|---|---|---|---|---|---|---|
| Sgr A[Ref.]aaReferences: (1) Baganoff et al. (2001); (2) Porquet et al. (2003) | (mag) | (arcsec) | at 1 keV | () | ||
| Quiescent [1] | 3.5 | 3.1 | 1.5 | 1.04 | 1.78 | 2.88 |
| Quiescent [1] | 7.0 | 3.1 | 1.5 | 16.6 | 3.30 | 5.58 |
| Quiescent [1] | 7.0 | 5.5 | 1.5 | 13.0 | 3.15 | 5.27 |
| Flaring [1] | 3.5 | 3.1 | 2.5 | 4.82 | 1.10 | 40.1 |
| Flaring [1] | 7.0 | 3.1 | 2.5 | 43.2 | 2.25 | 58.8 |
| Flaring [1] | 7.0 | 5.5 | 2.5 | 34.4 | 2.13 | 56.4 |
| Flaring [2] | 3.5 | 3.1 | 2.5ccThe extraction radius was , but from time delay considerations and the duration of the flare s we expect the scattering correction to be limited to that appearing inside . | 2.37 | 0.21 | 95.1 |
| Flaring [2] | 7.0 | 3.1 | 2.5ccThe extraction radius was , but from time delay considerations and the duration of the flare s we expect the scattering correction to be limited to that appearing inside . | 17.4 | 1.21 | 120 |
| Flaring [2] | 7.0 | 5.5 | 2.5ccThe extraction radius was , but from time delay considerations and the duration of the flare s we expect the scattering correction to be limited to that appearing inside . | 14.1 | 1.10 | 117 |
4 The X-ray Scattering Halo of Sgr A
X-ray scattering by dust creates diffuse “halos” of emission around astronomical sources (Overbeck 1965; Martin 1970; Hayakawa 1973), and these can be used to constrain models of the dust (e.g. Catura 1983; Mathis, & Lee 1991; Predehl & Klose 1996; Smith, Edgar, & Schafer 2002; Draine & Tan 2003, and references therein). X-ray scattering is most efficient at small angles, degree, and if the dust and gas have a fairly uniform distribution along the line of sight to a source, then this angle is also representative of the size of the observed scattering halo. The diffuse emission directly associated with Sgr Aextends only over a few arcseconds (B03). It has been argued that any diffuse emission created by dust-scattering would be fairly uniform on these scales, and therefore removed during the process of background subtraction: B03 estimated the background from the mean intensity between scales 3.5″to 10″.
However, dust that is close to the source tends to produce a more intense and concentrated scattering halo. This is relevant to the case of Sgr Abecause much of the line-of-sight dust is thought to be within a 100 pc or so of the Galactic center. The median scattering angle, , and dust at a distance from a point source produces a scattered halo with 50% of the scattered power within , where is the distance from the observer to the point source, and multiple scattering is neglected (Draine 2003).
For the adopted models of the source spectrum in the quiescent and flaring states, Figure 6 shows the calculated azimuthally-averaged intensity profile of the scattering halo. As in the monochromatic case, the halo profile was convolved with the on-axis Chandra PSF, derived from the CIAO data analysis software.222Smith et al. (2002) have shown that the PSF at angles greater than is best derived empirically from study of astronomical sources. In this study we restrict our attention to scales inside , where the PSF is well-determined from theoretical modeling of the telescope’s optics. Note that the energy dependence of the PSF can be seen in Figure 3.
The strength of the scattering halo is relatively more important for the quiescent state, because of its softer spectrum. However, in all cases the halo intensity can become significant relative to the PSF on scales of about an arcsecond or so.
In Figure 7 we show the effect of changing the location of the inner component of dust that is near Sgr A. As the dust is brought closer to Sgr A, the halo becomes more concentrated, becoming more and more point-like, and thus indistinguishable from the intrinsic source after convolution with the (Chandra) PSF.

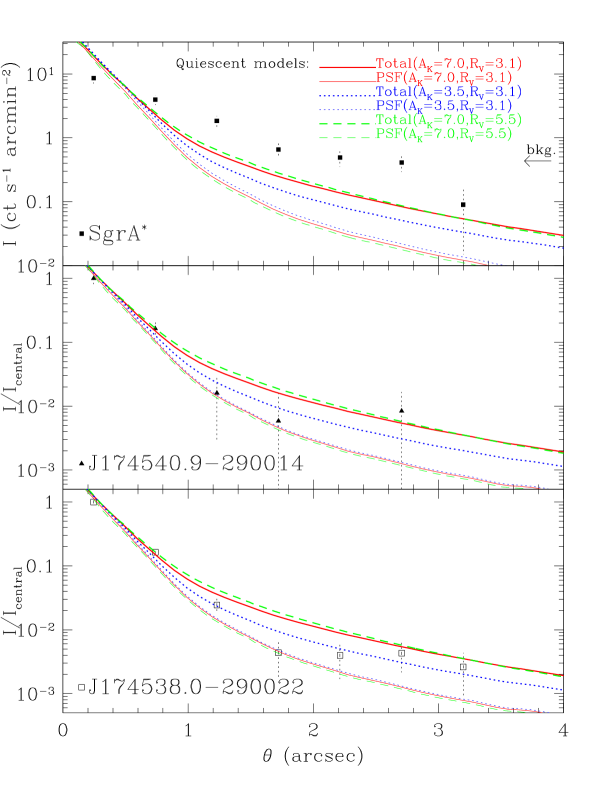
In Figure 8 we compare the theoretical radial intensity profiles, which are the sum of the PSF and the dust-scattered halo, with the observed emission from and around Sgr Ain its quiescent state (B03). The observations are presented as the mean values of annuli 0.492″wide, which is the pixel size. Note that the dithering of the telescope during the observation means that these profiles are not broadened significantly by the finite pixel size. B03 also corrected for pointing errors, estimated to be by . We also show the radial intensity profiles of two other nearby point sources, J174540.9-290014 and J174538.0-290022, observed by B03, normalized to the intensity of the innermost annulus. These sources have comparable spectra to Sgr A, are separated on the sky from Sgr Aby 18.7″(0.73 pc) and 27.0″(1.05 pc), respectively. Being heavily absorbed they are likely to be in the GC region, and given the angular distribution of sources around Sgr A, their proximity makes it likely that they are physically close to Sgr Ain all three spatial dimensions. It is likely, although not certain (§2), that their lines of sight are subject to similar extinctions, particularly for contributions from gas and dust that is towards us from the Galactic center.
We find that dust-scattering of point source emission is important for broadening the PSF of Chandra for typical sources in the vicinity of the GC. The level of enhancement is sufficient to explain the observed profiles of the sources near Sgr A. The largest enhancement at the arcsecond scale occurs with the inner dust component about 50 pc from Sgr A, and with dust that has , i.e. larger grains. However, even with the model with the largest dust column, corresponding to magnitudes, the scattering halo appears to be insufficient to explain the intensity of the diffuse emission within a few arcseconds of Sgr Aby factors of several. The total dust column would have to be increased by similar factors above the value of the model in order to explain the entire diffuse emission as being due to dust-scattered emission from an unresolved, steady point source.
We note that our model intensity profiles are greater than the data in the central annulus by about a factor of 1.8. This is because we have normalized the models to produce the observed flux, which was estimated inside an extraction radius of . The models underpredict the intensity beyond about 0.6″, and so to compensate have larger central intensities. If there are instrumental effects that lead to broadening, such as pointing errors, that have not been corrected for in the data analysis of B03, then these would cause the intensity of the central annulus to appear artificially smaller. If there are no such effects (as suggested by the profiles of the two nearby point sources) so that the observed intensity of the central annulus is accurate, then our point source models would have to be reduced in flux by a factor of about 1.8. This would lead to a similar reduction in the halo intensities and the contribution they make to the extended emission.
We now make a crude estimate for the contribution of the scattering halos from sources surrounding Sgr Ato the diffuse background inside 10″. From Figure 4 we estimate that at 4 keV for the model the scattering halo contributes about 20% of the PSF flux at angles 1.5-10″. B03 report that the sources inside 10″have a combined flux of . Thus over the 40.9 ks of the observation, the number of expected counts per pixel (0.492″) is about 0.1. The model would predict about half of this value. These estimates are much smaller than the 1.2 counts per pixel measured by B03 for the strength of the diffuse background, so we conclude that the scattering halos from the innermost GC sources make a relatively minor contribution to the local diffuse emission.
4.1 Time Delay of Scattered Photons
An additional effect that can boost the observed intensity is the delayed scattering of enhanced flux from an earlier flare. B03 observed that the flux at the start of their observation was rapidly declining and three times greater than the mean value. They concluded that a flare occurred around the time of the start of their observation ( confidence). Since flares from Sgr Ahave been observed to occur very frequently (about once per day, Baganoff 2003), here we estimate the effects of such flares on the scattered halos. The time dependence of the scattered halo intensity at various angles can help to constrain the dust and gas distribution near the Galactic center. If a typical strong flare occurred just before or at the start of the reported observation of quiescent emission of B03, it could have contributed significantly to the intensity of the diffuse emission.

Photons that reach us via one or more scatterings will have to travel a longer path length and so will be delayed compared to those arriving directly. If the source is variable, such as a flare, then this time delay can yield information on the distance and dust distribution to a source (Trümper & Schönfelder 1973; Draine & Tan 2003). For single scattering from dust that is a distance along the line of sight to a source at distance , the delay is
| (1) | |||||
| (2) |
We expect much of the dust towards Sgr Ato be close to the source: for pc, , so the delay for becomes 760, 1500, 3100 s.
Figure 9 shows the time evolution of the scattered halo intensity following two different hypothetical flares, whose properties we have take to be similar to the flare observed by B01 (F1) and that observed by Porquet et al. (2003) (F2). The evolution of intensities depends on the distribution of gas near Sgr A. Given the actual lightcurve of an observed flare, and with careful subtraction of the quiescent component, one may use the time-varying component of the X-ray halo to constrain the line of sight gas distribution close to the Galactic Center.
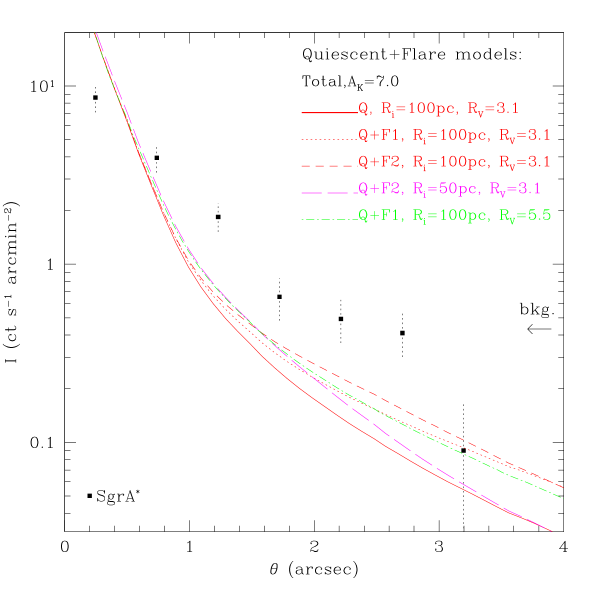
To compare to the observations of B03 we find the mean intensity averaged over the 40 ks observation period of B03. The results are shown in Figure 10. The delayed arrival of X-ray photons from when Sgr Awas in a more luminous state can boost the mean halo intensity in the following 40 ks by a factor of two or so. We stress that for these particular observations, while there is evidence for a flare near the beginning of the observation period, the actual lightcurve is unconstrained. Thus our calculation makes use of representative flare properties, as seen during other observations.
5 Conclusions
The large column densities of gas and dust towards the Galactic center strongly absorb and scatter X-rays, so that a careful treatment of these processes is necessary to infer the intrinsic properties of sources in this region, such as their luminosity, spectra, and spatial size. The fact that much of the dust lies close to the GC means that the scattering halos are much more concentrated than the halos seen around typical sources in the outer Galaxy. The same phenomenon also occurs for halos observed around X-ray sources in star-forming regions, since these also tend to contain a large column density of dust near the source.
In this paper we have analyzed the effects of the intervening gas and dust on Galactic center X-ray sources, using a realistic range of models for the total column and spatial distribution. We used reasonable estimates for chemical abundances and depletions of the gas and dust. We calculated the radiative transfer using realistic scattering properties of dust grains, and considered the effects of multiple scattering. We also evaluated the importance of different grain size distributions.
The principal conclusions of our work are the following:
1. The intrinsic luminosities and spectra of emission from Sgr Ain its quiescent state and in two flaring states are shown in Figure 5 and Table 1. These estimates depend on the amount of intervening dust and gas, which we have related to the most relevant observable, the extinction in the K band. The quiescent 2-10 keV luminosity ranges from 3 to , as ranges from 3.5 to 7.0 magnitudes. At the same time, the spectral index, , ranges from 1.8 to 3.3. The flaring states are about 10 to 30 times more luminous, with the flare observed by Chandra having a harder spectral index by about 0.7-1.0 and the flare observed by XMM-Newton having a harder spectral index by about 2.0. The uncertainties can be reduced once a better estimate for is available.
2. We show that scattering by dust within pc of the Galactic center can account for the arcsecond-scale broadening of Galactic center X-ray sources seen in Chandra observations by B03.
3. We have calculated the azimuthally averaged intensity profile of the dust-scattered halo around Sgr A, and shown that it can dominate the Chandra PSF beyond 1 arcsec (see Fig. 7). This effect contributes to the diffuse emission seen around Sgr A.
4. The dust-scattered halos of multiple sources in the GC region overlap, but only account for at most of the diffuse emission inside 10″of Sgr A.
5. Motivated by the detection of enhanced emission at the start of the observation of B03 and by other observations that show that strong flares occur about once per day (Baganoff 2003), we have modeled the effects of flared emission from Sgr A. For reasonable distributions of the dust, the time delay for scattered emission is of order a thousand to several thousand seconds at 1″, increasing quadratically with the angle. We show how measurements of the evolution of the scattered halo following a flare can help constrain the dust’s spatial distribution. It is possible that delayed scattering from a flare accounts for some of the diffuse emission close to Sgr Ain the observation of B03. To disentangle the quiescent component, data in a period at least ks after a major flare needs to be analyzed.
6. Our fiducial models for the contribution of a dust-scattered halo to the extended emission of Sgr Acan explain up to of the observed intensity at , corresponding to the extent of the Bondi radius. Thus earlier estimates of the gas luminosity and density may be overestimated by factors of and , respectively. Previous determinations of the Bondi accretion rate and luminosity could be overestimated by similar factors. We conclude, like B03, that the emission around Sgr Ais extended. To explain the entire emission as being due to dust scattering would require at least a doubling of the observed column in material at least 25 pc from Sgr A(but not substantially changing the columns to the other nearby GC sources), and/or the presence of an exceptionally strong flare just prior to the observation period. The latter possibility can be tested by looking at the observed halo from Sgr Ain more quiescent periods in existing (but unpublished) data.
References
- (1) Baganoff, F. K., Bautz, M. W., Brandt, W. N. et al. 2001, Nature, 413, 45 (B01)
- (2) Baganoff, F. K. 2003, AAS/HEAD, 35, 03.02
- (3) Baganoff, F. K., Maeda, Y., Morris, M. et al. 2003, ApJ, 591, 891 (B03)
- (4) Balick, B., & Brown, R. L. 1974, ApJ, 194, 265
- (5) Becklin, E. E., Matthews, K., Neugebauer, G., & Willner, S. P. 1978, ApJ, 220, 831
- (6) Binney, J., & Merrifield, M. 1998, Galactic Astronomy (Princeton: Princeton Univ. Press)
- (7) Bower, G. C., Wright, M. C. H., Falcke, H., & Backer, D. C. 2003, ApJ, 588, 331
- (8) Catura, R. C. 1983, ApJ, 275, 645
- (9) Chiar, J. E., Tielens, A. G. G. M., Whittet, D. C. B., Schutte, W. A., Boogert, A. C. A., Lutz, D., van Dishoeck, E. F., & Bernstein, M. P. 2000, ApJ, 537, 749
- (10) Draine, B.T. 1989, in Proc. 22nd ESLAB Symp. on IR Spectroscopy in Astronomy, ed. B. H. Kaldeich, ESA SP-290, 93
- (11) Draine, B.T. 2003a, ARA&A, 41, 241
- (12) Draine, B.T. 2003b, ApJ, 598, 1026
- (13) Draine, B.T., & Tan, J.C. 2003, ApJ, 594, 347
- (14) Eckart, A., Genzel, R., Hofmann, R., Sams, B. J., & Tacconi-Garman, L. E. 1995, ApJ, 445, L23
- (15) Falcke, H., & Markoff, S. 2000, A&A, 362, 113
- (16) Figer, D. F., Najarro, F., Morris, M., McLean, I. S., Geballe, T. R., Ghez, A. M., & Langer, N. 1998, ApJ, 506, 384
- (17) Genzel, R., Schödel, R., Ott, T., et al. 2003a, ApJ, 594, 812
- (18) Genzel, R., Schödel, R., Ott, T., et al. 2003b, Nature, 425, 934
- (19) Ghez, A. M., Becklin, E., Duchêne, G., Hornstein, S., Morris, M., Salim, S., Tanner, A. 2003a, Astron. Nachr., 324, No. S1, Special Supplement “The Central 300 parsecs of the Milky Way”, eds. A. Cotera, H. Falcke, T. R. Geballe, S. Markoff (astro-ph/0303151)
- (20) Ghez, A. M., Duchêne, G., Matthews, K., et al. 2003b, ApJ, 586, L127
- (21) Ghez, A. M., Wright, S. A., Matthews, K. et al. 2003c, ApJL, submitted (astro-ph/0309076)
- (22) Giveon, U., Morisset, C., & Sternberg, A. 2002, A&A, 392, 501
- (23) Güsten, R. Genzel, R., Wright, M. C. H., Jaffe, D. T., Stutzki, J., & Harris, A. I. 1987, ApJ, 318, 124
- (24) Hayakawa, S. 1973, in IAU Symp. 52, Interstellar Dust and Related Topics, ed. J. M. Greenberg & H. C. van de Hulst (Dordrecht: Reidel), 283
- (25) Herrnstein, R. M., & Ho, P. T. P. 2002, ApJ, 579, L83
- (26) Kleinmann, S. G., & Hall, D. N. B. 1986, ApJS, 62, 501
- (27) Krabbe, A., Genzel, R. Eckart, A. et al. 1995, ApJ, 447, L95
- (28) Launhardt, R., Zylka, R., & Mezger, P. G. 2002, A&A, 384, 112
- (29) Lebofsky, M. J., Rieke, G. H. 1987, AIP Conf. Proc. No. 155, “The Galactic Center,” ed. D. C. Backer, p79
- (30) Lebofsky, M. J., Rieke, G. H., & Tokunaga, A. T. 1982, ApJ, 263, 736
- (31) Li, A., & Draine, B.T. 2001, ApJ, 554, 778
- (32) Li, A., & Draine, B.T. 2002, ApJ, 572, 232
- (33) Liu, S. & Melia, F. 2002, ApJ, 566, L77
- (34) Lutz, D., Feuchtgruber, H., Genzel, R., et al. 1996, A&A, 315, L269
- (35) Marr, J. M., Wright, M. C. H., & Backer, D. C. 1993, ApJ, 411, 667
- (36) Martin, P. G. 1970, MNRAS, 149, 221
- (37) Mathis, J.S., & Lee, C.-W. 1991, ApJ, 376, 490
- (38) Melia, F., Liu, S., & Coker, R. 2000, ApJ, 545, L117
- (39) McGary, R. S., Coil, A. L., & Ho, P. T. P. 2001, ApJ, 559, 326
- (40) Narayan, R. 2002, in Lighthouses of the Universe, eds. M. Gilfanov, R. Sunyaev, et al., (Springer-Verlag) (astro-ph/0201260)
- (41) Nayakshin, S., & Sunyaev, R. 2003, MNRAS, 343, L59
- (42) Overbeck, J. W. 1965, ApJ, 141, 864
- (43) Pessah, M. & Melia, F. 2003, ApJ, 585, L29
- (44) Porquet, D., Predehl, P., Aschenbach, B., Grosso, N., Goldwurm, A., Goldoni, P., Warwick, R. S., & Decourchelle, A. 2003, A&A, in press, (astro-ph/0307110)
- Predehl & Klose (1996) Predehl, P., & Klose, S. 1996, A&A, 306, 283
- (46) Quataert, E. 2002, ApJ, 575, 855
- (47) Quataert, E. 2003, ApJL, submitted, (astro-ph/0310446)
- (48) Raymond, J., & Smith, B.H. 1977, ApJS, 35, 419
- (49) Reid, M. J. 1993, ARA&A, 31, 345
- (50) Rieke, G. H., & Lebofsky, M. J. 1985, ApJ, 288, 618
- (51) Rieke, G. H., Rieke, M. J., & Paul, A. E. 1989, ApJ, 336, 752
- (52) Schödel, R., Ott, T., Genzel, R., et al. 2002, Nature, 419, 694
- (53) Sellgren, K., Hall, D. N. B., Kleinmann, S. G., & Scoville, N. Z. 1987, ApJ, 317, 881
- (54) Smith, R. K., Edgar, R. J., & Schafer, R. A. 2002, ApJ, 581, 562
- (55) Trümper, J. & Schönfelder, V. 1973, A&A, 25, 445
- (56) Vollmer, B., Zylka, R., & Duschl, W. J. 2003, A&A, in press, (astro-ph/0306200)
- (57) Weingartner, J.C., & Draine, B.T. 2001, ApJ, 548, 296 (WD01)
- (58) Yuan, F., Markoff, S., & Falcke, H. 2002, A&A, 383, 584
- (59) Yuan, F., Quataert, E., & Narayan, R. 2003, ApJ, in press (astro-ph/0304125)