Scaling Relations of Local Spiral Galaxies.I. Observational Foundations
Abstract
This paper presents an exploration of two fundamental scaling relations of spiral galaxies, the luminosity-rotation speed (or Tully-Fisher; TF) relation, and the size-luminosity (SL) relation, and the dependences of their scatter, at red and infrared bands. We verify that the observed virial relations of disk galaxies are given by and using distance-redshift surveys of high surface brightness (HSB) and low surface brightness (LSB) non-interacting galaxies. These results imply that the galaxy surface brightness . The collected surveys provide accurate -band luminosities, disk scale lengths, circular velocities, and, in some cases, color. Various issues regarding the scatter of scaling relations in blue to near-infrared bands are being re-examined with accurate Kron luminosities, effective radii, and colors from the 2MASS database. We derive the first extensive -band TF and SL relations. At a given infrared luminosity, the TF velocity residuals are correlated with infrared color, which in turn is determined by the variations in galaxy formation ages and dark halo concentrations; these residuals are fully independent of surface brightness and other tested galaxy observables. We verify that TF relations (TFRs) for various morphological types have different zero points, but a common slope, such that early-type (redder) disks rotate faster than later-type (bluer) systems of the same luminosity. The morphological type dependence of the TFR is a direct consequence of the more fundamental scatter dependence on color, which itself is related to the star formation history of a galaxy. The scatter of the SL relation is mostly dominated by surface brightness, but color also plays a small role. The observed systematic variations of disk size with color, for a given luminosity, are weaker than expected, perhaps as a result of uncertainty in disk scale length measurements. The TF and SL residuals for HSB and LSB galaxies are weakly correlated with , in agreement with the earlier claim by Courteau & Rix (1999, ApJ, 513, 561), and . The former result suggests that spiral disks of all color, brightness and barredness may be, on average, dominated by dark matter even in their inner parts (the so-called “sub-maximal disk” solution at disk scale lengths). The observed scaling relations of disk galaxies are likely the result of the simplest scenario of galaxy formation in the standard cosmological picture, but their color dependence remains a challenge to hierarchical structure formation models. These relations and their derivatives are analysed in terms of, and serve as stringent constraints for, galaxy formation models in our companion paper.
1 Introduction
Understanding the origin and nature of galaxy scaling relations is a fundamental quest of any successful theory of galaxy formation. The success of a particular theory will be judged by its ability to predict the slope, scatter, and zero-point of any robust galaxy scaling relation at any particular wavelength. Some observed scaling relations in spiral galaxies, based on their size, luminosity, and rotation speed, can be reproduced individually to fairly good accuracy by invoking galaxy formation models that include virial equilibrium after dissipational collapse of spherical cold dark matter (CDM) halos and angular momentum conservation (e.g. Mo, Mao, & White 1998, hereafter MMW98; van den Bosch 1998, 2000, hereafter collectively as vdB00; Navarro & Steinmetz 2000, hereafter NS00; Firmani & Avila-Reese 2000; hereafter FAR00).
One of the most firmly established empirical scaling relation of disk galaxies is the Tully-Fisher relation (TFR; Tully & Fisher 1977); a tight correlation between the total luminosity and the rotation speed of a disk galaxy. However, to date, no single CDM-based model of galaxy formation can simultaneously reproduce the slope, zero-point, scatter, and color trends of the TFR, match the shape and normalization of the luminosity function, and explain the sizes, colors, and metallicity of disk galaxies (see, e.g,. vdB00; Bell et al. 2003). In addition, simultaneously accounting for the mass and angular momentum distribution of spiral galaxies in a gas dynamical context remains a major challenge for hierarchical formation models (Navarro & White 1994; Bullock et al. 2001b; van den Bosch et al. 2002b). A complete theory of galaxy scaling relations awaits a fuller understanding of structure forming mechanisms and evolutionary processes (e.g. star formation, merging, feedback, and cooling prescriptions) in galaxies (see Somerville & Primack 1999 for a comparison of “recipes” among competing theories.) Likewise, the fine-tuning of these galaxy formation and evolutionary models demands a careful examination of empirical scaling relations of galaxies.
In order to set up a framework for the study of galaxy scaling relations, we examine the correlations of parameters related by the virial theorem, , for bright galaxies (i.e. where feedback effects are minimal). We consider three fundamental observables for each disk galaxy: the total luminosity , the stellar scale length of the exponential disk, and the observed circular velocity . The stellar mass, , can be estimated from the luminosity by assuming a stellar mass-to-light ratio, . The size-luminosity (SL) relation of galaxy disks is also expressed as , where is the surface brightness.
Key to mapping fundamental dynamical trends in spiral galaxies, the measurement of TF and SL relations and detection of their correlated residuals require velocity amplitudes measured at a suitably chosen radius representative of the flat part of resolved rotation curves, red/infrared magnitudes to minimize extinction and population effects, accurate disk scale lengths, and, ideally, color terms with a broad baseline (e.g. ) to test for variations in the stellar population and extinction effects. Our goal in this paper is thus to assemble such a data base.
A study of scaling relations in irregular and spiral galaxies by Salpeter & Hoffman (1996; hereafter SH96) yielded the correlations , where , , and , are the HI and dynamical masses, and a characteristic radius, respectively. The blue luminosities, as used in that study, are notoriously sensitive to dust extinction and stellar population effects and dynamical effects cannot be simply isolated. A new study of scaling relations in the (near-)infrared would provide more robust dynamical constraints to galaxy formation models. While the TFR has been examined at nearly all optical-IR wavelengths (e.g. Strauss & Willick 1995; Verheijen 2001, hereafter V01), comparatively few multi-wavelength analyses of the SL relation (SLR) of spiral galaxies have been done so far (SH96; MMW98; Shen et al. 2003). This is partly because the accurate disk scale lengths needed to calibrate the SLR, at any wavelength, have only recently become available for large databases (e.g. Courteau 1996; Dale et al. 1999; MacArthur et al. 2003, hereafter MCH03). The recent availability of light profile decompositions for very large galaxy databases (e.g. Sloan Digital Sky Survey and Two Micron All-Sky Survey; §2) heralds a new era for the study of galaxy scaling relations (e.g. Shen et al. 2003). We will return to considerations about the SLR in §2.1. The remainder of this section focuses on the TFR and the dependences of its scatter on galaxy observables.
The empirical TFR is expressed as
| (1) |
with the near-IR log-slope (Willick et al. 1997; Giovanelli et al. 1997, hereafter G97; Courteau et al. 2000; V01). Reported values of the log-slope range from 2.8 in the blue to 4.0 in the infrared (Willick et al. 1997; Tully & Pierce 2000; V01) for both high and low surface brightness galaxies (Zwaan et al. 1995; V01). Log-slopes steeper than in the infrared typically result from small samples and excessive pruning on the basis of idealized morphology or kinematics, a narrow range of inclinations, redshift cutoffs, etc. (Bernstein et al. 1994; V01; Kannappan, Fabricant, & Franx 2002, hereafter KFF02). The slope, scatter, and zero-point of blue TFRs are predominantly dominated by stellar population and dust extinction effects (e.g. Aaronson & Mould 1983; C97; G97; Willick et al. 1997; Tully & Pierce 2000) and on the techniques used to recover the major observables and fitting for fundamental relations (e.g. Strauss & Willick 1995; C97; V01; Bell & de Jong 2001; KFF02). Because we are mainly interested in masses, rather than luminosities, we do not concern ourselves with TFRs and other scaling relations measured at blue wavelengths. We show in Appendix A that the fundamental form of the TFR, based on dynamical principles only, is given by , that is .
The modern interpretation of the TFR is that of a correlation between the total baryonic mass of a galaxy, inferred via its infrared luminosity and a stellar mass-to-light ratio and total gas mass (HI + He), and its total mass inferred from the asymptotic circular velocity of the galaxy disk (McGaugh et al. 2000; Bell & de Jong 2001; V01). The “baryonic” TFR is expressed as
| (2) |
Since disk gas mass fractions typically increase with decreasing luminosity (i.e., McGaugh & de Blok 1997), one typically has that .
While the log-slope of the TFR can be reproduced fairly well by most CDM-based structure formation models (e.g. MMW98; vdB00; NS00), the predicted scatter can be large compared to the inferred “cosmic” scatter of mag in red/infrared bands (Willick et al. 1996; V01) and interpretations about its dependence differ (see below).
Besides the basic understanding of the slopes of galaxy scaling relations, the dependence of their scatter has also been addressed by many, especially for the TFR (e.g. Aaronson & Mould 1983; Giraud 1986; Rhee 1996; Willick et al. 1997; KFF02), and can be used to set stringent constraints on structure formation models (Courteau & Rix 1999, hereafter CR99; Heavens & Jimenez 1999; FAR00; NS00; V01; Buchalter, Jimenez, & Kamionkowski 2001; Shen, Mo, & Shu 2002).
While various trends in the scatter of the blue TFR have been reported in the past, no correlations of the infrared TF residuals with inclination, size, concentration, gas fraction, or far infrared luminosity have thus far been reported (Aaronson & Mould 1983; V01). The dependence of near-IR TFR scatter on color and surface brightness is however still a matter of contention that we discuss in §2.2. The SLR scatter is also addressed in §2.2.
The study of scaling relations in galaxies has benefited from the two-pronged application of the TFR for the purposes of: (i) Estimating relative distances to measure deviations from the mean Hubble flow (see, e.g., Strauss & Willick 1995 and the reviews in the “Cosmic Flows 1999” proceedings by Courteau, Strauss, & Willick 1999); and (ii) testing galaxy formation and evolution models (Dalcanton, Spergel & Summers 1997; MMW98; vdB00). The philosophy of sample selection and calibration differs in both cases. For cosmic flow analyses, the calibration and science samples must be pruned mostly on the basis of morphology and visual appearance in order to minimize systematic errors and thus ensure the smallest possible magnitude (distance) error. Since TF scatter depends strongly on the slope of the TF, it is found that the combination of steepness, magnitude errors, extinction correction, and sky stability favors red () bands for smallest distance errors and cosmic flows applications (Courteau 1997, hereafter C97; V01). The accuracy of bulk flow solutions also depends on the size of the sample. In order to collect large enough samples, TF calibrations for flow studies rely mostly on HI line widths or H rotation curves that can be collected relatively quickly on modest aperture telescopes. These rotation measures typically sample the disk rotation out to 2 to 3 disk scale lengths (C97).
By contrast, use of the TFR as a test bed for galaxy formation models requires the widest range of morphological types, to sample all structural properties, and that extinction and stellar population effects be minimized to isolate genuine dynamical correlations. The nearly dust-insensitive -band is thus the one of choice for such applications (V01)111We find in §2.3 a slightly tighter 2MASS TFR at -band rather than at ; the -band TFR is hardest to control due to airglow fluctuations (Jarrett et al. 2003).. Rotation velocities are preferably extracted from fully resolved HI rotation curves obtained using aperture synthesis maps that sample the disk rotation out to 4 to 5 disk scale lengths.
Ideally, the study of scaling relations should rely on homogeneous samples assembled with the very purpose of testing for broad structural and dynamical differences; at the moment, we must contend with the more finely pruned heterogeneous samples of late-type spirals that have been collected during the last decade mostly for flow studies. These data, which include near-infrared luminosities, and sometimes colors, for large samples of galaxies, still enable us to characterize the dependence of scaling relations and examine various constraints of structure formation models, in ways hitherto unsettled.
In Courteau et al. (2003), we showed that barred and unbarred galaxies have similar physical properties and that they share the same TFR. As a natural extension of this study and CR99, in §2.2 we use the extensive all-sky distance-redshift catalogs presented in §2 to characterize the scatter of the TF and SL relations in terms of galaxy observables for a broad suite of galaxy types. In §3 we bolster the notions of surface brightness independence and color dependence of the TFR, as well as that of surface brightness dependence for the SLR, for disk galaxies. This prompts a renewed examination of the correlated scatter study of CR99 which favored high dark-to-luminous mass fractions in galaxy disk’s interiors.
In §4 we develop a simple analytical interpretation for the origin of the galaxy virial relations, such as the TF and SL relations, in a cosmological setting. The analysis of the scatter in the scaling relations, and a discussion about the implications of our results in terms of existing galaxy formation models, are presented in our companion paper (S. Courteau et al. 2004a, in preparation; hereafter Paper II).
2 Available Samples
We consider four samples for which accurate galaxy observables, including crucial rotational velocities, are available. These include (a) the large -band survey of galaxy distances for bright field spirals in the Southern sky by Mathewson, Ford, & Buchhorn (1992; hereafter “MAT”); the all-sky -band TF surveys by (b) Dale et al. (1999; hereafter “SCII”) and (c) Courteau et al. (2000; 2004b, in preparation; hereafter “Shellflow”); and (d) the multi-band TF survey of Ursa Major cluster galaxies by Tully et al. (1996) and V01 (hereafter “UMa”). The first three TF surveys were originally designed to map the convergence of the velocity field on Mpc scales, with the SCII and Shellflow studies paying special attention to TF calibration errors between different observatories. By design, these surveys favor late-type galaxies with inclinations on the sky greater than 32∘; most have ∘.
Properties for each sample are given in Table 1. These include in Col. (2), the number of galaxies from the original database that have a full complement of useful observables; Col. (3), the nature of the sampled galaxies (cluster or field; the predominantly “field” surveys of MAT and Shellflow include a small fraction of cluster galaxies); Col. (4), the digital photometric coverage. -band magnitudes for all the MAT galaxies were extracted from the RC3 (de Vaucouleurs et al. 1991). We have Sloan Digital Sky Survey (York et al. 2000, hereafter SDSS) colors for 39 SCII galaxies (see Appendix B) and Kron magnitudes and colors from the Two Micron All-Sky Survey (Skrutskie et al. 1997; hereafter 2MASS) for the brightest SCII galaxies; Col. (5) the magnitude or diameter limits of the original catalog; Col. (6), the redshift limits of the survey in km s-1. For UMa, we list the adopted cluster distance in Mpc; and in Col. (7), the rotation measure, either extracted from HI line mapping or H spatially resolved rotation curves. While MAT gives both HI and H rotation measures we use only the sub-sample of galaxies with available HI , which is largest. Our results for the MAT sample do not depend upon this particular choice of rotation measures. For SCII, rotation velocities were obtained using either H long-slit spectra or HI line profiles. These two rotation measures are comparable as long as the rotation curve is flat beyond 2 disk scale lengths and the HI surface density drops rapidly in the outer disk (C97). Rotation velocities for the Shellflow sample were measured at from resolved H rotation curves. For the UMa database, we use the “HI ” sample of 44 galaxies with HI line widths (V01).
Disk scale length measurements were computed in somewhat different ways for each sample. For the MAT galaxies, we have used the two-dimensional bulge-disk (B/D) decompositions of MAT -band images by Byun & Freeman (1995). These decompositions assumed a de Vaucouleurs bulge profile which is not ideal for late-type galaxies (MCH03) and therefore the disk central surface brightnesses are likely biased low. The disk scale lengths are less affected, in a relative sense due to the broader baseline of the disk modeled as an exponential profile, and deemed adequate for the purpose of our study (see §2.1). SCII disk scale lengths were obtained by fitting a straight line to the exponential part of the -band surface brightness profile from -mag arcsec-2 to -mag arcsec-2 (the so-called “marking the disk” technique) and corrected for projection effects according to , where and are the semi-major and semi-minor axes of the disk (Dale et al. 1999; G97). The correction for projection is small and somewhat uncertain but the choice of observed or deprojected scale lengths for the SCII galaxies does not affect our final results. Shellflow scale lengths were extracted from one-dimensional B/D decompositions of azimuthally-averaged -band surface brightness profiles (MCH03; S. Courteau et al. 2004; in preparation). These fits account for a Sérsic bulge and an exponential disk. Disk scale lengths for the UMa sample were measured from a “marking the disk” technique but the fit baseline is unspecified and erratic fits are reported in Tully et al. (1996). The latter could be due to inclusion of bulge light in the disk fit (scale lengths biased low) for the brighter galaxies and sky domination (scale lengths biased high) for the fainter galaxies. The latter signature is detected when we compare the scale length measurements for the four samples in §2.1.
Physical parameters are computed using H=72 km sec Mpc. This matches the revised distance to the UMa cluster from 15.5 Mpc to 18.6 Mpc, based on new Cepheid distances from the HST Key Project (Tully & Pierce 2000). The exact choice of distance scale does not affect our conclusions so long as it is consistent for all samples in order to put absolute scales on equal footing (luminosities in and scale lengths in kpc).
Hubble types for all but the SCII galaxies were obtained from the heterogeneous NASA Extragalactic Data (NED) Base. Most SCII galaxies were not classified in NED and their morphological types were determined in a homogeneous fashion via a combination of eye-ball examination, B/D ratio and/or concentration index (Dale et al. 1999). Interacting and disturbed galaxies were rejected in all samples. Together, the MAT, SCII, Shellflow, and UMa samples combine for a total of 1,750 separate entries; some repeat measurements within a given sample exist but all observations are independent.
2.1 Mean Parameter Relations
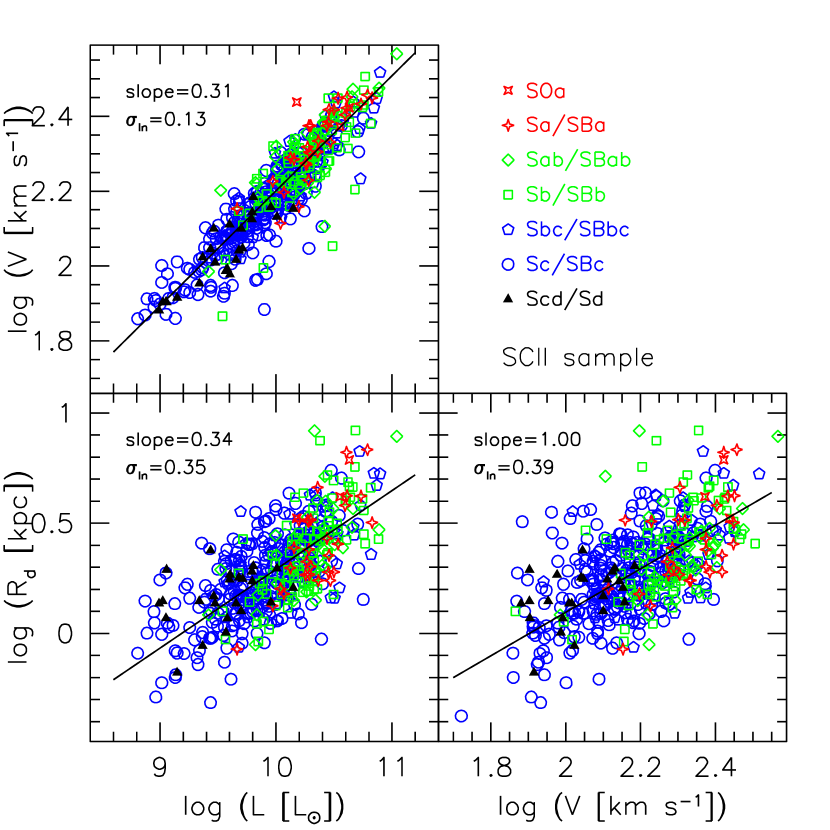
We consider the projected distribution in each of the planes defined by a pair of the three log virial variables, , , and ; these are shown in Figs. 1–4 for the SCII, MAT, Shellflow, and UMa galaxies. The axis limits are the same in all figures for trend matching between each sample. Different symbols identify the full range of spiral Hubble types, as a proxy for accurate optical colors which are not available for the full MAT and SCII samples. The solid lines correspond to one dimensional linear regressions to (a) on , (b) on , and (c) on , given the measurement errors in the first variable in each case when available (or otherwise using unweighted fits). The fits for the SCII sample are used as fiducials against the other, less complete, samples and are shown as a dotted line on the virial projections for each sample. For each relation, we fit the functional form , where and stand for any combination of , , and ; the upper bar denotes the median value of each variable. To achieve a robust fit to the data , we varied to minimize the datamodel deviation (rather than the squared difference). We repeat the fits for all the log quantities keeping either the total luminosity, stellar scale length, or maximum velocity fixed. This fitting technique follows the treament in CR99. We have also computed standard least-squares fits which yield similar results. Log-slopes and the Pearson linear correlation coefficients for each parameter combination are reported in Table 2 (we do not concern ourselves with calibration zero-point differences in this Paper).
The regressions were performed using the full range of luminosities (when the regression was on ) and velocities (when the regression was on ). It has been proposed that the scaling relations may be different for the fainter, LSB galaxies (e.g., Kauffmann et al. 2003; Shen et al. 2003), where supernova feedback effects are likely to be important (e.g., Dekel & Silk 1986; Dekel & Woo 2003). Such a departure is, however, not apparent in the samples (SCII and MAT) that most closely probe the LSB regime (see Figs. 1 & 2).
The agreement in Table 2 between the log-slopes for different samples is relatively good, though differences exist. All samples are well matched by a TFR, , with log-slope . Our TF fits are also a close match to those published by the original authors (as ), even though the minimization techniques can be quite different. The Pearson correlation coefficient of the distribution (not considering the errors) averages for the TFR and the conditional distribution of at a given is roughly log-normal. The correlations for the SL and size-velocity (SV) relations are weaker, averaging . The size distributions are less robust than the TFR owing to a number of factors such as, (a) small range of galaxy sizes in some samples (Shellflow, UMa), (b) lack of a uniform and universal definition of scale length (MCH03), and (c) intrinsic scatter due to the natural dispersion of the spin parameter, (§4). Whether scale lengths are measured from B/D decompositions or “marked” over a specified range of surface brightnesses (while omitting the bulge region or not) can yield scale differences greater than 20% (MCH03). The overlap between the four samples is too small (in some cases non-existant) to calibrate such systematic errors. Thus it is difficult to determine how much of the lower correlation coefficients in the SL and SV relations is due to genuine dynamical processes andor inadequate scale lengths. In spite of potential pathologies with the MAT scale lengths (see §2), the scalings for this sample and SCII are comfortably close. For the sake of uniformity, we will base our final analysis of the virial relations of disk galaxies on the SCII sample alone, being the most extensive and robust sample considered here. Furthermore, unlike our results for some of the other, less complete and thus noisier, data sets our fits for SCII are self-consistent, within the errors. If and and , then self-consistency requires that . This is indeed the case for SCII, our most complete sample.
In summary, we find the following mean power-law scaling relations at -band for spiral galaxies:
| (3) |
The uncertainties in the log-slopes for the SCII sample, based on measurement errors, are , , and , respectively.
Fig. 5 shows the combined TF and SL relations for the four samples. This operation formally requires that the magnitudes, rotation velocities, and scale lengths be perfectly homogeneous. However, zero-pointing differences exist between the various samples thus preventing a direct merging of all samples into one large homogeneous catalog for our study of scaling relations. The rest of our investigation thus relies on the separate examination of each data set.
2.2 The Morphological/Color Dependence of Galaxy Scaling Relations
The morphological type dependence of the TFR is highlighted in Figs. 1–4 by different point types and colors. This dependence, first noted by Roberts (1978), and revisited by Aaronson & Mould (1983), Rubin et al. (1985), Giraud (1986), Pierce & Tully (1988) and G97 – to name a few – goes in the general sense of early-type galaxies rotating faster than later-types at a given optical luminosity. This trend is confirmed for each sample in the top panels of Figs. 1–4 where the early-type and late-type spirals, represented by red stellated points and black filled triangles, are located above and below the fiducial fits, respectively222At the lenticular end of the spiral sequence, S0 galaxies are consistent with our qualitative findings with a marked offset from the mean TFR (of Pierce & Tully 1992) but these galaxies also show a steeper TFR than early-type spirals (Neistein et al. 1999; Hinz, Rix, & Bernstein 2001; Mathieu, Merrifield, & Kuijken 2002). The steeper TFRs may be a consequence of sample selection andor just the nature of S0 galaxies.. Recent optical TF relations of nearby spirals (e.g. KFF02) and of distant spirals (B. Weiner et al. 2003 [DEEP project], in preparation) covering a wide range of morphologies support the Hubble-type dependence of the optical TFR, up to at least .
Figs. 6 & 7 show histograms of the luminosity residuals from the mean TF relation as a function of Hubble type for the Shellflow and SCII samples (similar results are obtained for MAT and UMa). By selection, the mean TF fit is dominated by Sb-Sc galaxies. For the Shellflow sample, early and late-type spirals differ by 0.08 dex and -0.25 dex from the mean TFR respectively. This is accentuated in the SCII sample (Fig. 7) with TF luminosity residuals of +0.17 dex and -0.33 dex for early and late-types, respectively. Dale et al. (1999) applied a morphological-type correction to their galaxy magnitudes for the construction of their TF template. Their corrections to total -band magnitudes for TSab, Sb, and TSbc are -0.27, -0.11, and 0.00 mag, respectively, which is somewhat larger than the ones we find for their data.
While Hubble-type classification depends on the bandpass of selection, a morphological-type dependence of the TFR, even at near-infrared bands, is undeniable. The morphology dependence of the SV and SL relations is weaker, as one would expect based on the relatively larger errors of disk scale lengths compared to circular velocity measurements. The distributions of scale lengths in the SL diagrams show a slight excess for bluer (later type) galaxies over the mean at a given luminosity, suggesting that bluer galaxies are bigger than the mean. Prejudice from theoretical models (e.g. FAR00; vdB00) and our own simple scenario of disk formation (§4) would have us favor a scenario where redder objects are both faster rotators and more compact, but observational evidence for the latter is weak. This could be the result of inhomogeneous disk scale length measurements, and especially for the fainter systems for which sky errors are more conspicuous. The slight excess of disk scale lengths over the mean at the faint end of the SLR could be understood if sky subraction was systematically under-estimated. In that respect alone, an extensive program to measure accurate disk scale lengths and half-light radii for a large collection of spiral galaxies based on one unique reduction method and high signal-to-noise data is badly needed.
Because morphological classification is a subjective measure, we look at more objective observables to determine what physical parameters drive the TFR scatter. Figs. 8 and 9 display the TFR scatter in magnitude against five galaxy observables for the four samples. Besides the RC3 and SDSS colors extracted for the MAT and SCII samples respectively (see Appendix B for SCII), the data were all collected from the original literature. The concentration indices (CIs) for Shellflow and SCII galaxies correspond to the ratio of radii containing 75 and 25 percent of the total light (CI72). CIs for UMa galaxies were computed at radii containing 80 and 20 percent of total light (CI82; Tully et al. 1996). Note that all exponential disks without a bulge have the same value of CI72=2.8 and CI82=3.6, regardless of their total mass or scale length. For the MAT sample, we substituted missing CI data with B/D ratios.
Looking at Figs. 8 & 9, we see that the TFR scatter (in magnitudes) is clearly independent of central surface brightness, , physical disk scale length, , and concentration index. Color and morphological types, on the other hand, are both correlated with TF magnitude residuals. Given that color and morphological type are themselves strongly correlated (see Fig. 10), this is consistent with a picture in which color is the fundamental driver of scatter in the TF relation. Fig. 10 shows that the tightest correlation with morphological type is indeed with color. Fig. 10 also shows that velocity depends more strongly upon morphological type (color) than disk size, an important observation that we return to in §3 and Paper II. The correlation of morphological types with concentration index is poorest, highlighting the relative inadequacy of the CI test to discriminate between different spiral Hubble types.
According to V01, all correlations of TF residuals with galaxy observables detected in blue bands, including color, vanish in the infrared. This important conclusion however rests on the study of a small data sample (less than 44 galaxies) and deserves closer attention. Contrary to findings in Aaronson & Mould (1983) and V01, Rubin et al. (1985) found that the morphological type dependence of the TFR was reduced, but not eliminated, at infrared luminosities333 Unlike V01 and Aaronson & Mould (1983), Rubin et al. (1985) found a similar morphology (color) dependence of the TFR, even at -band. Such a dependence could be an artifact of rotational speed measurements with optical spectra. The shape of optical rotation curves is often dominated by the inner rising part of an early-type spiral or the slowly rising part of a later-type spiral of the same luminosity. However, the presence or absence of a bulge or bar has a weaker effect on the overall extended shape of a resolved HI rotation curve. Thus the asymptotic rotational speed measured from HI synthesis maps or H velocity fields from say, 2 disk scale lengths to the last detected velocity point (with acceptable signal-to-noise), will not be subject to the vagaries of the inner rotation curve in the same way as optical rotation curve measurements (e.g. C97, V01). So long as velocity measurements are made beyond , the rotation speed should be unaffected by a bulge or bar (CR99; Courteau et al. 2003), and the trends detected by Rubin et al. and ourselves are robust.. Thus color is potentially another fundamental parameter of galaxy structure and formation, in addition to size, luminosity and rotation speed. Until recently, the CCD luminosity measurements in large galaxy samples with available line widths were only collected in a single band (typically or ), thus thwarting any systematic test for color dependence. Recent scatter studies based on the small, pruned, UMa galaxy sample (Heavens & Jimenez 1999; V01) can now be duplicated for much larger samples, as we do here.
The recent -band TF study of the Nearby Field Galaxy Survey (Jansen et al. 2000) by KFF02 identified color and H equivalent width as the main drivers of the TFR scatter. Color and H equivalent width are both tributary of star formation histories though the former depends both on the integrated and instantaneous star formation while the latter is a function of the current star formation rate alone. Taken together with our results, it thus seems that star formation history is the fundamental driver of the TF scatter (e.g. Heavens & Jimenez 1999). One expects the TF scatter in bluer bands to be more sensitive to contributions of instantaneous star formation activity, while at (near-)infrared bands the scatter mainly reflects the convolved star formation histories.
In order to verify that the basic trends in the scatter of the galaxy virial (TF and SL) relations are a manifestation of star formation histories, and thus persist at infrared bands, we need to expand our data base as we do below.
2.3 The Infrared Tully-Fisher and Size-Luminosity Relations
The advent of large-scale infrared surveys such as 2MASS provides us with reliable luminosities, effective radii, and colors to construct (nearly) dust-free scaling relations. With a typical surface brightness limit of mag arcsec-2, the 2MASS luminosity profiles are a full two magnitudes shallower than the typical -band profiles in our samples or the SDSS brightness profiles. Yet, they yield scaling relations that are as tight as the ones derived at -band. We now restrict our IR-extended analysis to the SCII sample for which the greatest range of luminosities and rotation speeds is found and thus for which the most reliable scaling relations can be derived. Because of the 2MASS magnitude limit of 13.5 -mag (e.g. Bell et al. 2003b), only the brightest SCII galaxies have measured Kron magnitudes.
Figs. 11 to 13 show the 2MASS -band scaling relations for SCII galaxies plotted against , , and colors444Concentration indices from the 2MASS data base are known to be pathological (Bell et al. 2003b), as we verified ourselves. Consequently, we omit scaling relations with CI as a discriminant.. In the -band one is notoriously more sensitive to airglow fluctuations (e.g., Jarrett et al. 2003), making this photometric band less attractive for TF studies. The -band TFR is very similar to that in the -band, but since the latter yielded the smallest TF scatter, we focus on the -band in what follows. The scatter in the SL and SV relations is significantly reduced compared to that in the -band (cf. Table 2). Note, however, that the size parameter in the -band is an effective radius rather than a disk scale length (which was not available from the 2MASS data release). Therefore, it is unclear whether this reduction in scatter reflects the usage of a more robust and rigorous galaxy size measure, or whether it is related to stellar population differences.
As reported in Table 2, the (SCII) and TFRs have nearly the same log-slopes. For the SCII sample with 2MASS data, the infrared scaling relations are:
| (4) |
While the log-slopes for our SL and SV relations in Figs. 11 to 13 were computed with respect to , they can be compared directly to since, for a pure exponential disk, . However, the -band SL and SV log-slopes are significantly steeper than at , possibly resulting from biases in the measurement of disk scale lengths versus effective radii. The former is sensitive to the disk fitting baseline while the other depends on the strength of the bulge-to-disk ratio. In order to verify this, we would need both types of radii measurements (either at -band or in the infrared) which are not currently available; the assembly of such a data base is under way. Low and intermediate-redshift () studies of SV relations, based on data from Courteau (1996; C97) and Vogt et al. (1997) and as reported in Mao, Mo, & White (1998), have SV log-slopes of and respectively, in good agreement with our -band measurements. Dynamical considerations (§4) also suggest a log-slope of unity for the SV relation. More work needs to be done to ascertain the cause of the steep infrared size-dependent scaling relations.
Figs. 11–13 confirm that the TF scatter is dominated by color and nearly independent of size and surface brightness. Previous reports of TF residual correlations with surface brightness may have generated confusion. Willick (1999) reported a correlation of -band TF residuals with surface brightness and compactness for his “LP10K” survey of distant cluster galaxies using a moments fitting method to determine the exponential disk parameters even in the presence of irregularities in the galaxy light profiles. In an attempt to alleviate subjective fitting boundaries, Willick’s computation used the entire surface brightness profile, including the bulge, and thereby biasing scale length and central surface brightness measurements. Applying his procedure, we can reproduce the putative surface brightness dependence of the TFR while proper bulge-to-disk (B/D) fitting techniques (MCH03) find none555It is unfortunate that J. Willick is no longer with us to defend his approach..
The absence of surface brightness dependence of the TFR scatter has been verified by Sprayberry et al. (1995), Zwaan et al. (1995), and V01, and suggests a near-constancy of near-infrared (NIR) ratio for high surface brightness (HSB) and low surface brightness (LSB) galaxies of comparable total luminosities. In other words, if the surface brightness decreases, so do and in such a way that the TFR is independent of surface brightness. Thus, HSB and LSB galaxies belong to the same TFR, albeit with LSB galaxies showing a greater spread at lower luminosities. Any TF offset between low and high surface brightness noticed in the -band can be explained by mass-to-light ratio differences between the relevant stellar populations and, according to V01, the offset disappears at .
The SLR shows a very strong dependence on (as expected since ), and a weaker dependence on color. We see from Fig. 13 that bluer galaxies are on average larger than the mean, at a given luminosity, but we cannot state with any confidence that redder galaxies have smaller characteristic sizes, since these scatter evenly about the mean line.
3 Residual Correlations of Scaling Relations
The previous section identified color and surface brightness as the primary source of scatter in the TF and SL relations, respectively. In the spirit of CR99, we now examine correlations of the residuals from the mean virial relations in each sample.
Following §2.1, we define the residuals for each object as . Fig. 14 shows residual correlations for combinations of , , and for each sample based on the -band catalogs. The colored types have the same morphological dependence as in Figs. 1–4. The correlation residuals for the SCII sample with 2MASS -band data are presented in Fig. 15; the point types are a function of color. As in CR99, we apply a robust non-parametric test by rotating the set of residuals by various angles to get and then applying a Spearman rank test (Press et al. 1992, §14.6) for correlations between the quantities . The acceptable range of can be calculated from the range of angles for which the are not significantly correlated. The correlation slopes and their associated errors are reported in Table 3 and are shown at the bottom of each panel in Fig. 14. The linear correlation coefficients, , which provides another means of assessing the strength of the correlation between each residual, are also shown at the top left corner of each panel. The slopes and correlation coefficients shown at the bottom of Fig. 15 are representative of the full data set (including all colors).
There is close agreement in the correlated residual solutions of all samples, and including the 2MASS SCII data set, with the general solution:
These slopes are an average of the values for Shellflow, MAT, and the and -band SCII samples. Besides UMa, the slopes for the TF/SL residuals for all samples are negative (anti-correlated) and low. For the three large samples and at all colors, the TF/SL residual correlation is statistically different from , though only weakly. Furthermore, redder galaxies (top left corner of Fig. 15) lie above the null line whereas blue galaxies (bottom left) lie below. Note also that galaxies of all morphological types (and barredness, not shown here), scatter normally about the zero line. FAR00 have also computed the TF/SL residuals for the UMa sample (V01; see lower left panel of Fig. 16) and find no correlation for both for LSB and HSB galaxies, as do we for that sample (see Table 3). That result is however heavily weighted by the small size of the sample.
The weak and strong surface brightness dependences of the TF and SL relations, respectively, have been used to infer the ratio of baryonic to dark mass in the inner parts of galaxies (CR99). If the gradient of NIR mass-to-light ratios is self-similar among galaxies of different brightnesses, CR99 conjectured that maximal disks666A stellar disk is “maximal” if it contributes more than 75% of the total rotational support of the galaxy at , the radius of maximum disk circular speed (Sackett 1997). is the scale length of the disk. should be offset from the mean TF and SL relations in such a way that the fractional deviations, and , from the mean relations, and , should be strongly correlated. The case of would be expected for pure (maximal) exponential stellar disks (i.e., without a dark matter halo). Uncorrelated TF/SL residuals might then suggest that disk galaxies (of all colors, types, and barredness) are, on average, sub-maximal777The most massive spiral galaxies with km s-1 may harbor disks with high mass fractions, in agreement with the maximum disk hypothesis (Athanassoula, Bosma, & Papaioannou 1987; Kranz, Slyz, & Rix 2003). andor that a fine-tuning of halo and disk parameters washes out any surface brightness correlation in the TFR. Using the samples of bright late-type spiral galaxies of Courteau (1992) and MAT, with available and -band luminosity profile and H rotation measures, CR99 found a tentative correlation between the TF residuals (measured in velocity space) and the SLR residuals. The TF/SL fractional deviations were found to be weakly correlated with . With our expanded study, we now find , suggesting that the disk mass plays only a small role in setting the total velocity at . According to the galaxy contraction models of CR99888Our models have been independently confirmed by Bullock (2002; priv. comm.), the residual correlation corresponds to , indicating that spiral galaxies, independent of barredness or type, would be dominated by dark matter with within . This result agrees with analytical models of cosmological structure formation (e.g. Dalcanton et al. 1997; MMW98; NS00; vdB00; Cole et al. 2000), whereby dark halos dominate the potential even in the inner parts of galaxies, and with independent measurements of galaxy dynamics (e.g. Fuchs 2001; Trott & Webster 2002; Kranz, Slyz, & Rix 2003). This result does not preclude the possibility of a stronger disk at radii smaller than .
With , the SL residuals (middle column of Figs. 14–15) are also weakly correlated. A positive correlation may be real but not of fundamental interest. Consider a model where V(R) versus L(R) is a strict relation with no scatter, while R is a scattered quantity about the relation R(L). Then the scatter in both V(R) and L(R) comes solely from the scatter in R, and of course the residuals will be correlated, both determined by the value of R for a specific galaxy. Thus it is the TFR between V and L that gives rise to the V(R)-L(R) correlation. In a similar way, the weak SL correlation between R and L gives rise to a (weak) correlation between the residuals of R(V) and L(V). Models to explain the numerical value of the correlation residuals are presented in Paper II.
The VL residual distributions (third column of Figs. 14–15) are tightly correlated with (a little less at ) and relatively small slope errors; indeed, this relation is simply the TFR recast in differential form.
Figs. 16 and 17 are expanded versions of the relations for the MAT, SCII, Shellflow, and UMa samples with -band data, and the SCII sample with -band data, respectively. Again, the correlated residuals are fully inconsistent with the prediction for a pure stellar exponential disk (short-dashed line), at (CR99). The solid and long-dashed lines show the best fits from our Spearman rank test. The lower panels in Figs. 16 and 17 show TF and SL residuals with color. Trends of and with color residuals are shown in the right lower and central panels; the residual fits for the SCII+2MASS data are shown as solid and long-dashed lines in Fig. 17. Velocity residuals correlate tightly with color whereas size residuals are noisier and statistically consistent with zero. These trends match those seen in CR99 for the Courteau-Faber and MAT samples and ought to be reproduced by evolutionary models of disk galaxies (e.g. FAR00; vdB00). If we account for the observed trends with color, and the simplest assumptions about single stellar population models, we find that the mean observed value of yields an upper limit to the contribution of disk stars to the rotation curve at (CR99).
4 On the Origin of the Disk Galaxy Scaling Relations
The linear regressions of on and on , mostly for the -band results, yield the following average TF, SL, and SV relations:
| (5) |
Within these relations, at a given luminosity, we found that redder spirals tend to rotate faster and show hints of being more compact than bluer spirals.
In the spirit of the spherical-collapse model (Gunn & Gott 1972) one can define the virial radius of a collapsed, virialized gravitational body as the radius inside of which the average density is a factor times the average background density (the value of depends on redshift and cosmology; see e.g., Eke, Cole & Frenk 1996; Bryan & Norman 1998). It is straightforward to show (see Appendix A) that with this definition the virial quantities , (defined as the total mass within ), and (defined as the circular velocity at ) are related according to and . Therefore, as long as , , and are roughly constant (i.e., are not significantly correlated with either of the virial quantities), these virial relations are all that is required to explain the observed scaling relations for disk galaxies.
To realize the implications of this in terms of galaxy formation theory, we write
| (6) |
Here, is defined as the disk mass-to-light ratio, is the baryonic mass fraction of the Universe ( for a CDM cosmology), and is the galaxy formation efficiency that describes what fraction of the baryonic mass inside the halo ultimately ends up in the disk. The virial relation thus turns into the observed TFR if, and only if,
| (7) |
is not correlated with and reveals an amount of scatter in agreement with that observed in the TF relation.
In the standard model for disk formation, set forth by Fall & Efstathiou (1980), Dalcanton et al. (1997) and MMW98, the relation between and derives from the acquisition and conservation of (specific) angular momentum by the baryons, when cooling to form a centrifugally supported disk. The total angular momentum of a virialized system is conveniently expressed by the dimensionless spin parameter
| (8) |
(Bullock et al. 2001). For an exponential disk embedded in a dark matter halo, the total angular momentum is given by
| (9) |
with and the surface density and circular velocity of the disk, and
| (10) |
(MMW98) a dimensionless number. If disk formation occured under conservation of specific angular momentum, as generally assumed, one therefore obtains that
| (11) |
(MMW98). Thus, for the virial relation to turn into the observed SV relation , one requires that
| (12) |
is not correlated with and has a scatter around its mean value in agreement with that in the observed SV relation.
Similarly, in order to relate the virial relation between and to the observed SL relation, the quantity
| (13) |
cannot be correlated with galaxy luminosity, and has to reveal an amount of scatter that matches that in the SL relation observed.
Thus, the challenge for galaxy formation theories is to understand how to meet the constraints on , , and derived here. That this is not a trivial matter becomes clear if one takes into consideration that (i) both and depend extremely sensitively on the efficiencies of cooling, star formation and feedback, and are thus expected to be strongly correlated with and (see e.g., van den Bosch 2002a), and (ii) that both and depend, in a convoluted way, on , , and on halo concentration, which itself depends on halo mass (e.g., Navarro, Frenk & White 1997).
An additional challenge for galaxy formation models is to understand the dependence of the scaling relations on disk color. For instance, reproducing that color is the prime driver of scatter in the TF relation, requires that is correlated with color. In hierarchical structure formation scenarios, small mass haloes form earlier than their more massive counterparts. Since gas cooling is very efficient in low mass haloes at high redshift, these models generally predict that fainter galaxies (living in low mass haloes) are older, and therefore redder, than their more luminous counterparts. This is opposite to the observed trend, and has long been known to be an important problem for galaxy formation in CDM comogonies (see Bell et al. 2003a and MacArthur et al. 2003b for recent discussions). Because of this problem, simple disk formation models within this CDM framework naturally predict that the slope of the TF should be steeper in bluer bands (e.g., van den Bosch 2002a), again opposite to what has been observed. For the more massive galaxies to be older/redder, one could adjust the feedback prescription in order to vary the amount of gas accreted by spiral galaxies as a function of time. However, the energetic requirements for this to occur may exceed the energy reservoir in the stellar winds and supernovae and would require the action of an AGN (Bell et al. 2003a). The challenge is to realize this such that the constraints on , , and are not violated.
In summary, we can conclude that the observed scaling relations of disk galaxies are predominantly a straightforward result of the basic dynamics of halo formation in the standard cosmological picture and the simple, standard scenario of disk formation. They do, however, impose some interesting constraints on galaxy formation models, which we address in more detail in Paper II.
5 Discussion
By assembling some of the most extensive existing databases of galaxy structural parameters, and adding new infrared luminosity and effective radii from 2MASS, we have been able to confirm or infer the following major observational results:
-
•
The scaling relations of spiral galaxies, obtained by linear regressions of on and on , are
This implies that the surface brightness . These scaling relations seem to reflect the simplest possible model for disk galaxy formation based on angular momentum conservation of the baryons inside virialized dark matter halos.
-
•
The residuals of in the TFR are correlated with color, and uncorrelated with effective surface brightness. The residuals of are correlated with surface brightness and marginally correlated with color.
-
•
Early-type (redder) disk galaxies rotate faster than later (bluer) types at a given luminosity. The effective radii of blue galaxies are marginally larger than the mean at a given luminosity, while the sizes of red galaxies do not show a significant systematic deviation from the mean.
-
•
The TF/SL residuals are weakly anti-correlated with . This confirms the results of CR99, suggesting that most spiral disks are sub-maximal.
-
•
The SV/LV residuals are weakly correlated with .
While the observed scaling relations of disk galaxies appear to be a straightforward result, the lack of correlation between the residuals from these relations of and at a given coupled with their color dependence is more puzzling. In Paper II, we argue that the small scatter in the TFR is consistent with being a reflection of the natural scatter in halo concentration , as measured in cosmological simulations. This scatter is small because it is independent of the scatter in halo spin. Other explanations for the small size of the TFR scatter have invoked star formation and feedback processes (Eisenstein & Loeb 1996; Silk 1997; Heavens & Jimenez 1999; FAR00), the small dispersion in halo andor disk collapse times (Heavens & Jimenez 1999; vdB00), and dynamical response of the halo to the disk assembly (NS00). Whether these, and other interpretations for the small scatter in the TFR, are all fully independent is still a matter of contention that we revisit, along with the interpretation of the major observational results above, in Paper II.
Appendix A A General Derivation of the Tully-Fisher relation
Below, we develop the theory for the TFR (see also MMW98; NS00), and determine the fundamental nature of the TFR. This is because two simple predictions for the TFR have been used in the past: one with a log slope of ( in magnitudes), and the other with a log-slope of ( in magnitudes). Here we compare both predictions and show that they are related to one another. This discussion replicates §4, but giving more detail.
Let us consider a dark-matter halo of mass reaching virial equilibrium at a time corresponding to the cosmological expansion factor . We assume that the halo properties at that time are relevant for the properties of the stellar component that has formed in this halo.
For a body that is dominated by gravitational forces and is approximately in steady-state, the virial radius is defined in the spirit of the spherical-collapse model (Gunn & Gott 1972) by a given density contrast relative to the mean universal density at the time of collapse (where mass shells are infalling for the first time), namely by . At early times, when , the relevant density contrast is , while for the standard CDM cosmology (with and today) it rises to today (e.g. Eke et al. 1998; Peacock 1999). We ignore the weak redshift dependence of the factor in the following expressions999The maximum correction is obtained at low redshifts. For example, in the range the change is roughly , which implies that in the following expressions should be replaced by . This is a weak effect, which becomes even weaker at higher redshifts where the bulk of galaxy formation occurs..
If disks are embedded in dark halos we can define the total mass of the system (dark plus baryonic matter) as
| (A1) |
Here is the gravitational constant, and is defined as the radius inside of which the average density of the system is times the critical density of the Universe, which at a given is given by
| (A2) |
One can thus write
| (A3) |
Here is simply the circular velocity at , and is the Hubble constant at the virialization redshift of the halo. Note that , for an Einstein-de Sitter cosmology relevant at high redshifts, where is loosely referred to as the time of formation of the halo. The three virial quantities at thus define a one-parameter family: .
We now define the disk mass-to-light ratio101010We use the subscripts “d” and “h” to refer to the disk and dark matter halo, respectively.
| (A4) |
and write
| (A5) |
Here is the baryonic mass fraction of the Universe ( for a CDM model), and is the galaxy formation efficiency that describes what fraction of the baryonic mass inside the halo ultimately ends up in the disk. Depending on the efficiencies of cooling, star formation and feedback, this can vary anywhere from zero to unity (see e.g., van den Bosch 2002a)
Combining equations (A1) to (A5) yields
| (A6) |
This is a TFR with log-slope (see also Dalcanton et al. 1997; White 1997; MMW98; van den Bosch 1998; Syer, Mao, & Mo 1999).
In contrast, several authors in the past have predicted that the TFR should have a log-slope of (e.g., Sargent et al. 1977; Aaronson, Huchra, & Mould 1979; Salucci, Frenk, & Persic 1993; Sprayberry et al. 1995; Zwaan et al. 1995; Stil & Israel 1998). Their argument goes as follows: Assume that the disk surface brightness is described by an exponential function of the form
| (A7) |
with the stellar scale length of the disk. The total luminosity of the disk is
| (A8) |
Assuming that one measures the rotation velocity at a radius , and that the gas and stars in the disk move on circular orbits,
| (A9) |
with the total mass within radius . If we define the total mass-to-light ratio
| (A10) |
| (A11) |
This is a TFR with a log-slope of , and as long as one measures the rotation velocity at a constant number of scale lengths, , the scatter is determined purely by the variation in . This was emphasized by Zwaan et al. (1995), who, from the finding that both HSB and LSB spirals follow the same TFR, concluded that LSB galaxies must have much larger values of than their high surface brightness counterparts. Note that this “conspiracy” does not apply for the TFR of Eq. (A6), for which the zero-point is independent of the disk’s surface brightness.
The TFRs in Eqs. (A6) and (A11) thus predict a different log-slope. The cause of this apparent paradox lies in the fact that the surface brightness, (MMW98), and Eq. (A11) reduces to Eq. (A6). Thus, the two theoretical predictions of the TFR, with log-slopes and , are directly related, but only the derivation for Eq. (A6) is strictly based on dynamics and it is the most fundamental of the two.
Appendix B SDSS Colors for Galaxy Classification
Accurate optical colors based on digital imaging is available only for the Shellflow () and UMa () samples. The MAT and SCII galaxy magnitudes were imaged only at -band. In CR99, we computed a color term for MAT galaxies using RC3 B-band fluxes but RC3 magnitudes are inherently uncertain with mag. With the release of SDSS/DR1 data (York et al. 2000; Abazajian et al. 2003), we can extract and magnitudes (as proxy for and magnitudes) for galaxies that overlap with Shellflow and SCII galaxies. We do this for Shellflow galaxies in order to map the SDSS system to the Cousins system, upon which Shellflow magnitudes are based. A final transformation can then be applied to SCII magnitudes. We compare in Figs. 18 & 19 instrumental Petrosian magnitudes from the SDSS first data release against instrumental magnitudes for 31 Shellflow and 39 SCII galaxies. The comparisons avoid any differences due to extinction and k-corrections. Besides a zero-point offset, the and Petrosian magnitudes scale linearly with the and Cousins magnitudes in Shellflow and SCII. We compute transformations for the SDSS Petrosian magnitudes into Cousins magnitudes for the SCII galaxies that overlap with the SDSS/DR1 database. The instrumental “” magnitudes for SCII were corrected the same way as the -band magnitudes but using an extinction dependence , instead of , and the Poggianti (1997) formulation for the -band k-correction.
References
- Aaronson, Mould, & Huchra (1979) Aaronson, M., Mould, J., & Huchra, J. 1979, ApJ, 229, 1
- Aaronson & Mould (1983) Aaronson, M. & Mould, J. 1983, ApJ, 265, 1
- Abazajian etal. (2003) Abazajian, K. et al. . 2003, AJ, in press / astro-ph/0305492 [SDSS/DR1]
- Athanassoula, Bosma, & Papaioannou (1987) Athanassoula, E., Bosma, A., & Papaioannou, S. 1987, A&A, 179, 23
- Bell et al. (2003a) Bell, E. F., Baugh, C. M., Cole, S., Frenk, C. S., & Lacey, C. G. 2003, MNRAS, 343, 367
- Bell et al. (2003b) Bell, E. F., McIntosh, D. H., Katz, N., & Weinberg, M. D. 2003, ApJ Supp., in press (astro-ph/0302543)
- Bell & de Jong (2001) Bell, E. F. & de Jong, R. S. 2001, ApJ, 550, 212
- Bryan & Norman (1998) Bryan, G. L. & Norman, M. L. 1998, ApJ, 495, 80
- Buchalter, Jimenez, & Kamionkowski (2001) Buchalter, A., Jimenez, R., & Kamionkowski, M. 2001, MNRAS, 322, 43
- Bullock et al. (2001a) Bullock, J. S., Kolatt, T. S., Sigad, Y., Somerville, R. S., Kravtsov, A. V., Klypin, A. A., Primack, J. R., & Dekel, A. 2001a, MNRAS, 321, 559
- Bullock et al. (2001b) Bullock, J. S., Dekel, A., Kolatt, T. S., Kravtsov, A. V., Klypin, A. A., Porciani, C., & Primack, J. R. 2001, ApJ, 555, 240
- Byun & Freeman (1995) Byun, Y. I. & Freeman, K. C. 1995, ApJ, 448, 563
- Cole et al. (2000) Cole, S., Lacey, C, G., Baugh, C. M., & Frenk, C. S. 2000, MNRAS, 319, 168
- Courteau et al. (2003) Courteau, S. , Andersen, D.R., Bershady, M.A., MacArthur, L.A., & Rix, H.-W. 2003, ApJ, 2003, 594, 208
- Courteau, Strauss, Willick (2000) Courteau, S., Strauss, M.A., & Willick, J.A. 2000, “Cosmic Flows 1999: Towards an Understanding of Large Scale Structure”, ASP Conf. Vol. 201
- Courteau et al. (2000) Courteau, S. , Willick, J. A., Strauss, M. A., Schlegel, D., & Postman, M. 2000, ApJ, 544, 636 [Shellflow]
- Courteau & Rix (1999) Courteau, S. & Rix, H. 1999, ApJ, 513, 561 [CR99]
- Dalcanton et al. (1997) Dalcanton, J. J., Spergel, D. N., & Summers, F. J. 1997, ApJ, 482, 659
- Dale et al. (1999) Dale, D. A., Giovanelli, R., Haynes, M. P., Campusano, L. E., & Hardy, E. 1999, AJ, 118, 1489 [SCII]
- Dekel & Silk (1986) Dekel, A. & Silk, J. 1986, ApJ, 303, 39
- Dekel & Woo (2003) Dekel A. & Woo J. 2003, MNRAS, 344, 1131
- de Vaucouleurs et al. (1991) de Vaucouleurs, G., de Vaucouleurs, A., Corwin, H. G., Buta, R. J., Paturel, G., & Fouque, P. 1991, Third Reference Catalog of Bright Galaxies (New York:Springer) [RC3]
- Eisenstein & Loeb (1996) Eisenstein, D. J. & Loeb, A. 1996, ApJ, 459, 432
- Eke, Navarro, & Frenk (1998) Eke, V. R., Navarro, J. F., & Frenk, C. S. 1998, ApJ, 503, 569
- Eskridge et al. (2002) Eskridge, P. B. et al. 2002, ApJS, 143, 73
- Fall & Efstathiou (1980) Fall, S. M. & Efstathiou, G. 1980, MNRAS, 193, 189
- Firmani & Avila-Reese (2000) Firmani, C. & Avila-Reese, V. 2000, MNRAS, 315, 457 [FAR00]
- Fuchs (2001) Fuchs, B. 2001, Dark Matter in Astro- and Particle Physics, 25
- Giovanelli et al. (1997) Giovanelli, R., Haynes, M. P., Herter, T., Vogt, N. P., da Costa, L. N., Freudling, W., Salzer, J. J., & Wegner, G. 1997, AJ, 113, 53 [G97]
- Giraud (1986) Giraud, E. 1986, ApJ, 309, 512
- Gunn & Gott (1972) Gunn, J. E. & Gott, J. R. I. 1972, ApJ, 176, 1
- Heavens & Jimenez (1999) Heavens, A. F. & Jimenez, R. 1999, MNRAS, 305, 770
- Hinz, Rix, & Bernstein (2001) Hinz, J. L., Rix, H., & Bernstein, G. M. 2001, AJ, 121, 683
- Jarrett et al. (2003) Jarrett, T. H., Chester, T., Cutri, R., Schneider, S. E., & Huchra, J. P. 2003, AJ, 125, 525
- Kauffmann et al. (2003) Kauffmann, G. et al. 2003, MNRAS, 341, 54
- Kannappan, Fabricant, & Franx (2002) Kannappan, S. J., Fabricant, D. G., & Franx, M. 2002, AJ, 123, 2358 [KFF02]
- Kranz, Slyz, & Rix (2003) Kranz, T., Slyz, A., & Rix, H. 2003, ApJ, 586, 143
- MacArthur et al. (2003) MacArthur, L. A., Courteau. S., & Holtzman, J. A. 2003, ApJ, 582, 689 (MCH03)
- MacArthur et al. (2003b) MacArthur, L. A., Courteau. S., Bell, E., & Holtzman, J. A. 2003b, ApJ, submitted
- Mao et al. (1998) Mao, S., Mo, H. J., & White, S.D.M. 1998, MNRAS, 297L, 71
- Mathieu, Merrifield, & Kuijken (2002) Mathieu, A., Merrifield, M. R., & Kuijken, K. 2002, MNRAS, 330, 251
- Mathewson, Ford, & Buchhorn (1992) Mathewson, D. S., Ford, V. L., & Buchhorn, M. 1992, ApJS, 81, 413 [MAT]
- McGaugh & de Blok (1997) McGaugh, S. S., & de Blok, W. J. G. 1997, ApJ, 481, 689
- Mo, Mao, & White (1998) Mo, H. J., Mao, S., & White, S. D. M. 1998, MNRAS, 295, 319 [MMW98]
- Navarro & White (1994) Navarro, J. F., & White, S. D. M. 1994, MNRAS, 267, 401
- Navarro, Frenk, & White (1997) Navarro, J. F., Frenk, C. S., & White, S. D. M. 1997, ApJ, 490, 493
- Navarro & Steinmetz (2000) Navarro, J. F. & Steinmetz, M. 2000, ApJ, 538, 477 [NS00]
- Neistein, Maoz, Rix, & Tonry (1999) Neistein, E., Maoz, D., Rix, H., & Tonry, J. L. 1999, AJ, 117, 2666
- Peacock (1999) Peacock, J.A. 1999, “Cosmological Physics,” (Cambridge Univ.Press)
- Pierce & Tully (1988) Pierce, M. J. & Tully, R. B. 1988, ApJ, 330, 579
- Pierce & Tully (1992) Pierce, M. J. & Tully, R. B. 1992, ApJ, 387, 47
- Poggianti (1997) Poggianti, B. M. 1997, A&AS, 122, 399
- Rhee (1996) Rhee, M.-H. 1996, Ph.D. thesis, Kapteyn Institute
- Roberts (1978) Roberts, M. S. 1978, AJ, 83, 1026
- Rubin, Burstein, Ford, & Thonnard (1985) Rubin, V. C., Burstein, D., Ford, W. K., & Thonnard, N. 1985, ApJ, 289, 81
- Salpeter & Hoffman (1996) Salpeter, E. E. & Hoffman, G. L. 1996, ApJ, 465, 595 [SH96]
- Sargent et al. (1977) Sargent, W. L. W., Schechter, P. L., Boksenberg, A., & Shortridge, K. 1977, ApJ, 212, 326
- Shen, Mo, & Shu (2002) Shen, S., Mo, H. J., & Shu, C. 2002, MNRAS, 331, 259
- Shen et al. (2003) Shen, S. et al. 2003, submitted to MNRAS [astro-ph/0301527]
- Silk (1997) Silk, J. 1997, ApJ, 481, 703
- Sprayberry, Impey, Bothun, & Irwin (1995) Sprayberry, D., Impey, C. D., Bothun, G. D., & Irwin, M. J. 1995, AJ, 109, 558
- Strauss & Willick (1995) Strauss, M. A. & Willick, J. A. 1995, Phys. Rep., 261, 271
- Skrutskie et al. (1997) Skrutskie, M. F., et al. 1997, in “The Impact of Large Scale Near-IR Sky Surveys”, eds. F. Garzon et al., p. 25. (Dordrecht: Kluwer Academic Publishing Company)
- Syer, Mao, & Mo (1999) Syer, D., Mao, S., & Mo, H. J. 1999, MNRAS, 305, 357
- Trott & Webster (2002) Trott, C. M. & Webster, R. L. 2002, MNRAS, 334, 621
- Tully et al. (1996) Tully, R. B., Verheijen, M. A. W., Pierce, M. J., Huang, J., & Wainscoat, R. J. 1996, AJ, 112, 2471 [UMa]
- Tully & Pierce (2000) Tully, R. B. & Pierce, M. J. 2000, ApJ, 533, 744
- van den Bosch (1998) van den Bosch, F. C. 1998, ApJ, 507, 601
- van den Bosch (2000) van den Bosch, F. C. 2000, ApJ, 530, 177 [vdB00]
- van den Bosch (2002) van den Bosch, F. C. 2002a, MNRAS, 332, 456
- van den Bosch (2002) van den Bosch, F. C., Abel, T., Croft, R. A. C., Hernquist, L., & White, S. D. M. 2002b, ApJ, 576, 21
- Verheijen (2001) Verheijen, M. A. W. 2001, ApJ, 563, 694 [Ver01]
- Vogt et al. (1997) Vogt, N., et al. 1997, ApJ, 479L, 121
- Willick (1999) Willick, J. A. 1999, ApJ, 516, 47
- Willick et al. (1996) Willick, J. A., Courteau, S., Faber, S. M., Burstein, D., Dekel, A., & Kolatt, T. 1996, ApJ, 457, 460
- Willick et al. (1997) Willick, J. A., Courteau, S., Faber, S. M., Burstein, D., Dekel, A., & Strauss, M. A. 1997, ApJS, 109, 333
- York et al. (2000) York, D. G. et al. 2000, AJ, 120, 1579 [SDSS]
- Zwaan et al. (1995) Zwaan, M. A., van der Hulst, J. M., de Blok, W. J. G., & McGaugh, S. S. 1995, MNRAS, 273, L35
| Sample | Gal. type | Phot. bands | Mag/Diam. limits | Redshift limits | Rot. measure | |
|---|---|---|---|---|---|---|
| (1) | (2) | (3) | (4) | (5) | (6) | (7) |
| MAT | 845 | field | 17 | km s-1 | HI | |
| SCII | 521 | cluster | [5000–19,000] | H , HI | ||
| Shellflow | 340 | field | [4500,7000] | H | ||
| UMa | 44 | cluster | 18.6 Mpc | HI |
| MAT | SCII | Shellflow | UMa | |
|---|---|---|---|---|
| MAT | SCII | Shellflow | UMa | |
|---|---|---|---|---|