Imaging and Demography of the Host Galaxies of High-Redshift Type Ia Supernovae11affiliation: Based on observations with the NASA/ESA Hubble Space Telescope obtained at the Space Telescope Science Institute, which is operated by the Association of Universities for Research in Astronomy, Inc., under NASA contract NAS5-26555. 22affiliation: Based on observations obtained at the Cerro-Tololo Inter-American Observatory, which is operated by the Association of Universities for Research in Astronomy, Inc., under NASA contract NAS5-26555.
Abstract
We present the results of a study of the host galaxies of high redshift Type Ia supernovae (SNe Ia). We provide a catalog of 18 hosts of SNe Ia observed with the Hubble Space Telescope (HST) by the High- Supernova Search Team (HZT), including images, scale-lengths, measurements of integrated (Hubble equivalent) BVRIZ photometry in bands where the galaxies are brighter than mag, and galactocentric distances of the supernovae. We compare the residuals of SN Ia distance measurements from cosmological fits to measurable properties of the supernova host galaxies that might be expected to correlate with variable properties of the progenitor population, such as host galaxy color and position of the supernova. We find mostly null results; the current data are generally consistent with no correlations of the distance residuals with host galaxy properties in the redshift range . Although a subsample of SN hosts shows a formally significant (3) correlation between apparent host color and distance residuals, the correlation is not consistent with the null results from other host colors probed by our largest samples. There is also evidence for the same correlations between SN Ia properties and host type at low redshift and high redshift. These similarities support the current practice of extrapolating properties of the nearby population to high redshifts pending more robust detections of any correlations between distance residuals from cosmological fits and host properties.
1 Introduction
The claimed discovery (Riess et al., 1998; Perlmutter et al., 1999) of the acceleration of the expansion of the Universe was originally based on the Hubble diagram of Type Ia supernovae (SNe Ia; Schmidt et al., 1998; Garnavich et al., 1998; Perlmutter et al., 1997, 1998). Diagnosed as Type Ia by the lack of hydrogen and increased Si II absorption in their spectra (see Filippenko, 1997 for a review), SNe Ia appear to belong to a largely one-parameter family, where differences in their intrinsic luminosities are correlated with differences in their light-curve decline rates (Phillips, 1993; Hamuy et al., 1996a, b, c, d; Riess et al., 1996). This relation was empirically determined from the Hubble diagram of a large sample of nearby SNe Ia, but is not well understood theoretically. For example, the relation may be affected by different chemical compositions (C/O ratios in the progenitor white dwarfs, e.g., Höflich et al., 1998; Umeda et al., 1999a, b; 56Ni content in the explosions, e.g., Pinto & Eastman, 2000; Mazzali et al., 2001; main-sequence mass and metallicity of progenitor, e.g., Domínguez et al., 2001). This lack of solid theoretical understanding inspires questioning whether there may be environmental and evolutionary trends of SNe Ia that could propagate into their distance estimates. The impact of these distance measurements on cosmological models requires that any and all possible indications of systematic trends of SN Ia properties with redshift be checked.
The morphologies of high-redshift galaxies differ significantly from those of low-redshift galaxies. The spiral arms are less developed and more chaotic (Abraham & van den Bergh, 2001), and the fraction of irregular galaxies increases (Brinchmann et al., 1998; van den Bergh, 2001). The possibility exists that these distant host galaxies have produced progenitor populations leading to intrinsic luminosities of SNe different from those seen in the nearby sample of SNe. For example, if the high-redshift hosts are in different phases of evolution from the low-redshift hosts, they could contain dust with different reddening laws (Totani & Kobayashi, 1999), or they could contain progenitor stars of different abundance ratios (Höflich et al., 2000; Drell et al., 2000). Unfortunately, we cannot look at the stellar populations of the hosts in detail because the individual stars cannot be resolved; however, we can observe other host-galaxy properties, such as their integrated colors, magnitudes, and the galactocentric distances (GCDs) of their SNe. These properties should correlate strongly with statistical variation in progenitor population and thereby serve as statistical proxies. We can then compare these properties to residuals of the fit of the SN Ia distances to the accelerating cosmological model. If any correlation is found in these comparisons, it will provide a hint that conclusions about the accelerating universe, and the implied cosmological constant, will require more sophisticated statistical analysis incorporating such trends. Conversely, a null result will constrain models of such possible systematic effects.
Since the empirical relation which allows SNe Ia to be used as precise distance indicators is not understood theoretically, the spread in luminosities could be due to differing ages and/or chemical compositions of the progenitors. Many previous studies have noted that the luminosities of SNe Ia are correlated with their distances from the centers of their host galaxies and their host galaxy type. In the low-redshift sample of SNe Ia, events in elliptical galaxies occur at larger GCDs and tend to be underluminous compared to events that occur in spiral galaxies (Hamuy et al., 1996b; Wang et al., 1997; Ivanov et al., 2000). This correlation suggests that the age of the SN Ia progenitor has an effect on the peak brightness, because events hosted by ellipticals likely come from older progenitors (Howell, 2001; Hamuy et al., 2000). The correlation could also be explained by a metallicity effect; recently, Timmes et al. (2003) have shown that metallicity affects the amount of 22Ne in the white dwarf, which affects the amount of Ni a SN Ia explosion should make. Since ellipticals are super solar, they have more 22Ne in their white dwarfs and less Ni produced. The correlation also leads to a selection bias, as seen by Hamuy & Pinto (1999). The most distant SNe Ia in the low-redshift sample tend to be those of the fainter variety, with higher GCD, hosted by ellipticals. Hamuy et al. (2000) found evidence that the faintest galaxies tend to host overluminous SNe Ia.
Fortunately, these correlations disappear when the estimated distances (rather than luminosities) of the SNe are compared. The effects of the progenitor population on SN Ia luminosity in the low-redshift sample are all accounted for through the decline rate vs. luminosity relation ( vs. ) without consideration for the host-galaxy properties (Riess et al., 1999). The Hubble diagram of low- SNe Ia displays no correlation of distance residuals with host population indicators (Schmidt et al., 1998). Since the present-day stellar populations include a range of stellar age and metallicity greater than that spanned between the present and , this has been one of the most powerful arguments to date that progenitor evolution does not lead to a systematic bias in the high- Hubble diagram.
Further possible problems with the high- sample have also been suggested. Drell et al. (2000) have found that incorporation of simple models of SN Ia evolution allows many possible interpretations of the high-redshift data, making it “virtually impossible to pin down the values of and ” without an understanding of the SN Ia process. There is also the possibility that “grey dust” in the intergalactic medium could be confused with a cosmic acceleration (Aguirre, 1999). These effects appear unlikely to greatly affect the Hubble diagram in light of the most recent data (Tonry et al., 2003), which suggest that SN Ia measurements are consistent with a cosmological constant out to , where the effects of a cosmological constant begin to diverge from those of a systematic trend of SN Ia properties with redshift. Nevertheless, the apparent differences between the high and low-redshift samples highlight the need for further study of the possible differences between the populations of SNe Ia at high and low redshift to see whether there may be a smooth systematic trend with redshift that could mimic a cosmological effect.
Recent tests for correlations between host-galaxy properties and SN Ia peak luminosities in the high-redshift sample have improved constraints on the differences between the samples. For example, Farrah et al. (2002) investigated 22 host galaxies at observed by HST, finding the positions of the SNe to be in conflict with the low extinction values measured for the events. These studies did not show any correlations between host-galaxy type and SN luminosity. Most recently, Sullivan et al. (2003) used the data from the Supernova Cosmology Project, along with newly acquired host images and spectra, to look for systematic differences between the high and low-redshift SN Ia samples. Their high-redshift sample, uncorrected for host reddening, suggested that SNe Ia hosted by late-type galaxies have a larger intrinsic scatter than those found in early-type galaxies, revealing the effects of dust in the high- sample. On the other hand, they measured a significant cosmological constant in both the early and late-type samples, concluding that the measurement is largely unaffected by host-galaxy dust.
In this paper, we study deep archival HST images of high-redshift SN Ia host galaxies in order to look for correlations between their properties and those of their SNe Ia. The catalog presented here comprises some of the highest quality imaging to date for a statistical sample of high- SN hosts at a large range of redshifts. Section 2 explains our data analysis technique, while §3 provides the detailed results of our photometry and discusses the search for correlations between the apparent photometric properties of the host-galaxies and the residuals of the measured distances from smooth cosmological Hubble diagrams. Finally, §4 gives our conclusions.
2 Data Acquisition and Analysis
The use of to obtain light curves for several of the high- SN Ia samples has created an archive of image data that allows the study of the host galaxies’ photometric properties at high resolution. We include all of the High- Supernova Search Team (HZT) proprietary and archival data used for the determination of the SN Ia light curves. Table 1 provides a list of all of the data used for this study, including the names of the SNe, the coordinates of the exposures, the filters used, the number of epochs measured, the total exposure time in each filter, and the total baseline covered by the data. These data were not taken with the idea that the different epochs would be combined to produce deep images of the host galaxies. The different epochs were taken at different roll angles and with slight offsets, and there were SNe contaminating the galaxy light. Preparing the images for galaxy photometry was therefore a significant challenge, as discussed below.
2.1 Image Alignment and Stacking
In most cases, the equatorial J2000 coordinate system (WCS) given to the image by the data pipeline was accurate enough to allow pixel-to-pixel alignment by geometrically transforming each pixel to the same physical position on a canvas with a previously determined WCS. In detail, we created blank images with WCS of one exposure epoch; this was the reference coordinate system. Then we determined the geometric transformations, including translations and rotations, necessary to match the pixel positions of the world coordinates of the images taken at the other epochs to the pixel positions of the reference world coordinates. After these transformations were accomplished, the images’ physical coordinates were aligned as were their world coordinates.
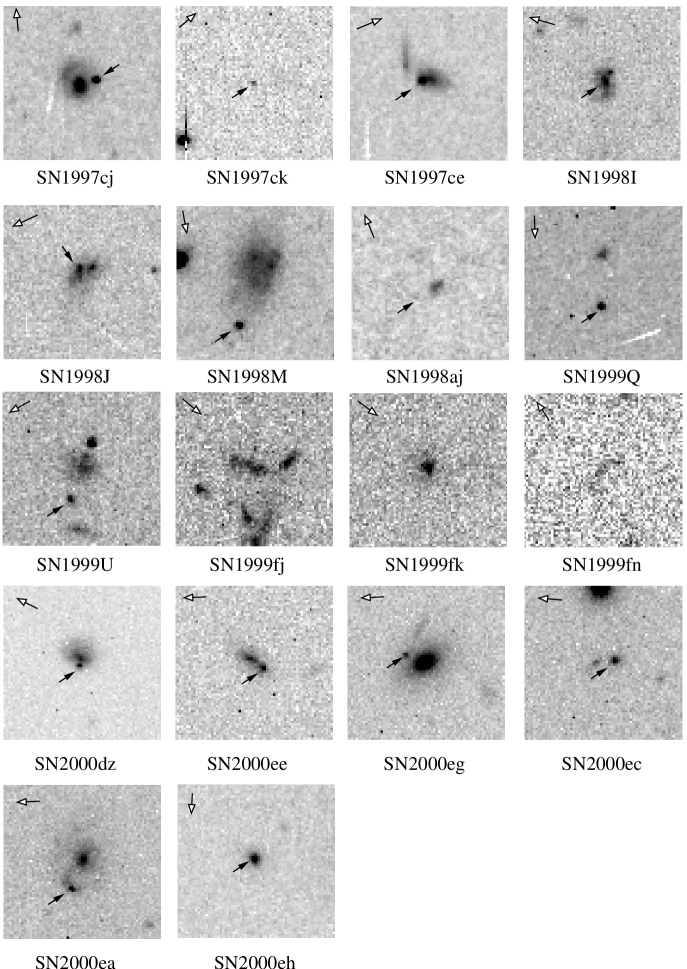
In some cases, the world coordinates of the images taken at different epochs were not exactly aligned. In these cases, the transformed images were misaligned by a few pixels, forcing an additional translation of the images to align the centers of the few point sources or compact galaxies in the images. Once these final adjustments were completed, the images were combined using the COMBINE routine in IRAF111IRAF is distributed by the National Optical Astronomy Observatory, which is operated by the Association of Universities for Research in Astronomy, Inc., under cooperative agreement with the National Science Foundation., allowing the rejection of cosmic rays with the CRREJECT algorithm. The final galaxy images are shown in Figure 1. These combined images provided our deepest views of the host galaxies of the high- supernovae observed by the HZT, comparable with many of the ground-based images of hosts in the low- sample. In a few cases, only galaxy template images were taken with . In these cases, the stacked images did not go as deep, but there was no light contamination from the SN. In all other cases the images were still contaminated by the light from the SNe. The images stacked from the multi-epoch supernova data have filled arrows in Figure 1 indicating the location of the supernova event.
2.2 Supernova Identification and Removal
Once the exposures were combined to create the deepest image possible in each case, the SNe and most probable hosts were identified using coordinates and finder charts supplied by the HZT. Because the SNe were still bright during most of the epochs that the data were taken, we adopted a procedure to remove the SNe with minimal impact on the galaxy photometry. Since reference HST images were not available for all of the hosts, we used a method that did not require a reference host image. Then we tested our method using the few hosts for which we had reference data. The most straightforward way to remove the SN contamination was by linearly interpolating across the SN in the final, combined images. This routine gave us pixel-by-pixel control over the area contaminated by the SN.
In four cases (SNe 1997ck, 2000dy, 2000ec, and 2000eh) no obvious galaxy could be seen near the SN, and we could not be sure if a compact galaxy was being completely overwhelmed by the SN light, or if the SN was in a very low surface brightness host. In three of these cases (SNe 2000dy, 2000ec, and 2000eh), we were able to use shallower template images of the galaxy taken at a later epoch by . For SN 1997ck no template images were taken and no host was seen down to mag within 7′′ of the event after the SN was removed from the image. In this case, there is a good chance that the host was simply overwhelmed by the event. For SN 1999Q, the only galaxy detected close enough to the event to be the host is 2.3′′ south of the event. For the events SNe 1999fj, 1999fk, and 1999fn the SN photometry was done from the ground; however, shallow galaxy template images were obtained from . In these cases, the template images, shown in Figure 1, were used for all of the host galaxy studies.
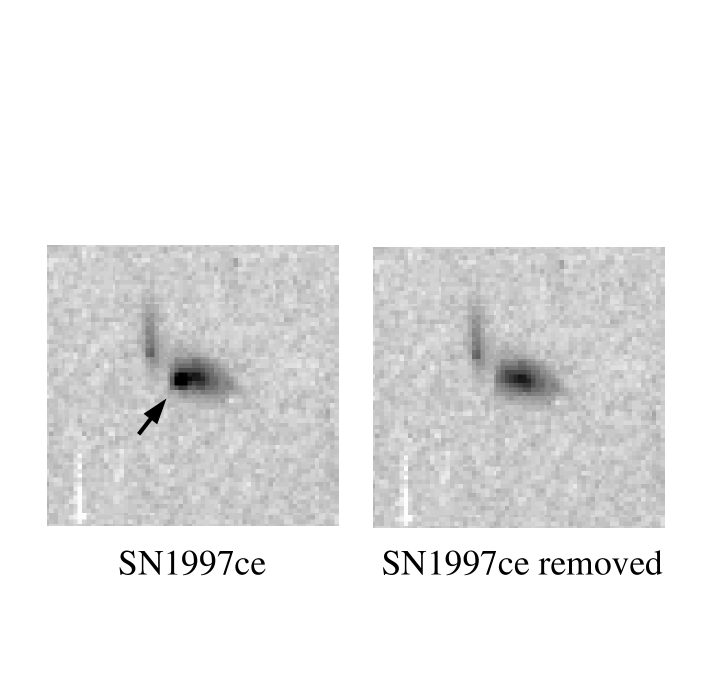
An example of the images before and after SN removal is shown in Figure 2. This removal caused additional error in our photometry. In order to set limits on the systematic error introduced by our removal process, we ran our photometry routines on template images of the host galaxies taken long after the decline of the SNe. These images were obtained by for use by the HZT to subtract the background contribution from the SN light while obtaining the light curves for the SNe. The templates were not as deep as the combined epochs from the light curves, and they were only made in all filters for a few of the SN hosts. We compared photometry done with the templates to that done with the SN-removed image stacks (cf. Table 2).
Even though we had template and multi-epoch images in all 5 filters for seven of the hosts, three of these hosts were, unfortunately, completely overwhelmed by the light of the SNe during the multi-epoch data. We treated these three cases (SNe 2000dy, 2000ec, and 2000eh) like all of the others, and the comparisons between the photometry extracted from the stacked epochs and the template images are given in Table 2. Because these were some of the faintest galaxies in the sample and the SN light was so dominant in the multi-epoch images, these comparisons mark the worst-case scenario for our SN removal method. In fact, these cases were so severe that we used the photometry from the shallower, template images for the catalog. On the other hand, the differences between the measurements taken using both methods for the other 4 galaxies (SNe 2000dz, 2000ee, 2000eg, and 2000ea) are shown in Table 2. In these cases, the light from the galaxies is not overwhelmed by the SNe. Most of the hosts in the sample, as shown in Figure 1, share this characteristic. Therefore, the effects of the SN removal technique for these four cases most likely mimic the effects of the technique on the rest of the sample. These tests revealed that our technique was causing no systematic offsets in the galaxies’ magnitudes in cases where the galaxy was brighter than the SN in the multi-epoch data. The most useful case was that of SN 2000dz, which had significant, but not dominant, SN contamination inside of one scale length. The photometry for this galaxy came out consistent within 1.5 for both the stacked, modified image and the template image obtained after the fading of the SN event.
2.3 Photometry
We performed aperture photometry for the host galaxies at 12 radii, from to using the IRAF package APPHOT. We measured the surface brightness fluctuations in the local background on each of these size scales in order to find the precision with which the photometry could be determined. The mean background level was subtracted from each pixel. The background-subtracted total counts in each aperture were transformed into instrumental magnitudes for each filter used by applying the zero-points of Holtzman et al. (1995). Since these galaxies are at high redshift, and their spectral energy distributions are not well constrained, we left these raw Space Telescope (ST) magnitudes alone for the purposes of this study, as any attempts to transform them to more standard Johnson-Cousins magnitudes or to rest-frame magnitudes would have added unknown systematic errors to our analysis. Instead, we plot in Figure 3 the galaxy colors versus redshift. The plot appears to show that higher redshift hosts are redder, but this correlation is most likely due to the systematic effects caused by the lack of imposing K-corrections on our data.
Surface brightness profiles were also determined using the counts in circular annuli. These profiles were used to determine the galaxy scale length and apparent magnitude. Total galaxy magnitudes were measured out to one scale length, the radius where the mean F814W surface brightness dropped by a factor of from the central surface brightness. The errors on these scale lengths were calculated from the measured radial surface brightness gradient of the galaxy and the surface brightness errors from fluctuations in the surrounding sky brightness. Since the radial surface brightness often fell steeply, more than one standard deviation in one pixel, we were often able to calculate the scale length to a precision of less than one pixel.
3 Discussion
Table 3 provides a catalog of data for each galaxy, including the radii of the galaxies used to measure their integrated magnitudes, the projected distances from the galaxies’ centers to their SNe, the integrated magnitudes measured in all filters observed, the galaxy redshift, the distance moduli () determined from the SN light curves, and the determined from the galaxy redshift assuming an and universe. The calculations necessary to acquire these numbers are described below.
3.1 Projected Galactocentric Distances
The SNe and their hosts were all imaged on the WF3 chip, which has an angular pixel scale of 0.1 arcsec/pixel. We measured the pixel positions of the galaxies’ centers of light and the centers of the SN point-spread functions (PSFs) using the IRAF task IMEXAM where there was a well-defined center. In cases where the galaxy was too extended for IMEXAM to find a reliable galaxy center, we estimated the center position by eye. These measurements were used to calculate the GCDs in units of host-galaxy radii. Environmental parameters within a galaxy change as a function of distance from the galactic center, and population properties change more quickly in a more compact galaxy than in a less compact one. A consistent way to compare the different GCDs of the events is to normalize them to galaxy size.
3.2 Distances
The homogeneous sample of luminosity distances for the SNe Ia was obtained from their light curves by the HZT (Tonry et al., 2003, and references therein). For our tests, we use the final distances measured by the HZT, including their absorption corrections. If there are no other systematics affecting the high- sample (e.g. progenitor population, chemical evolution), then we do not expect to find any correlation between any parameter and distance residual. We therefore are not searching for correlations we would expect; instead we are searching for correlations we would not expect. The distance moduli shown in Table 3 were obtained from the log() distances in Table 15 of Tonry et al. (2003) using the formula
In this equation, the is the distance value given in Table 15 of Tonry et al. (2003) and is the distance modulus in Table 3, assuming a value of . The distance errors in Table 3 were obtained using , where is the error value in Table 15 of Tonry et al. (2003). No distance has been measured for SN 2000dy because this event was later determined not to be a SN Ia; however, this event was useful to study because it provided a test of our analysis technique, discussed in §2.2. Two other HZT events (SN 1999fo and SN 1999fu) were also later determined not to be SNe Ia, and they have been removed from this study entirely.
In order to look for correlations between the host-galaxy properties and the discrepancy between these distance measures and those predicted from theory, we calculated the host distances predicted from their redshifts using a “flat-lambda” model (Carroll et al., 1992), where the luminosity distance, , is given by
where is the speed of light and is the redshift of the galaxy. For the analysis below, we adopt a reference model with , , consistent with the concordance of other current databases (e.g., WMAP; Spergel et al., 2003). Finally, the distance residuals used in our analysis were calculated by subtracting the redshift distance from the distance measured by the SN photometry.
The point should be made that for the distance-residual demographics, the exact choice of cosmological parameters (, , ) hardly matters to first order. The measurement of the cosmological constant is based on comparing the low-redshift distances to the high-redshift distances. Although we have used the concordance values for these parameters, the high-redshift data alone are not sensitive to these values, and therefore neither are the distance residuals from the Hubble fit. This insensitivity is demonstrated in Figure 4, where we show the distance residuals for a variety of different flat universe models, ranging from to . In each case we set the Hubble constant to minimize the sum of the squares of the residuals. The distance errors are shown for the , case to compare the errors with the spread over the possible cosmology choices. The spread in residuals for various models for any individual galaxy is always significantly smaller than the distance errors for the galaxy, even covering this large amount of parameter space. Figure 5 shows the Hubble fit for our sample and our adopted cosmology. Events with early-type hosts are marked by open squares, those with late-type hosts by closed squares, and those with no host by open stars.
3.3 Galaxy Classification
High-redshift galaxy classification has long been difficult because high-redshift galaxies often do not share the same kinds of morphological properties as the low-redshift galaxies used to create the classification system (e.g., Abraham & van den Bergh, 2001; van den Bergh, 2001). Our sample is no different, with host galaxies like those of SNe 1997ce, 1998M, and 1999fj having confused, irregular, and merging morphologies which look quite different from those of the nearby sample.
Therefore, in classifying our sample of galaxies, we thought any classifications beyond simply early and late types would be rather arbitrary and could lead to confusion. It was important, however, to break down the sample into at least these two types of galaxies in order to draw comparisons to previous studies of low and high-redshift hosts. These broad classifications are used because of the differences in galaxy morphologies at high redshift, not because of the quality of our images. All hosts were imaged through the F814W or F850LP filters. These images probe the rest-frame or , revealing the distribution of young stars and providing reliable morphology information. Our subjective criteria were simple. Galaxies which showed circular symmetry and lacking a disk were classified as early, and all others (merger remnants, spirals, and irregulars) were classified as late. Table 3 gives our classifications for each galaxy.
The morphologies of the hosts of 10 supernovae (SNe 1997ce, 1997cj, 1998J, 1998M, 1999U, 2000dz, 2000ea, 2000ec, 2000ee, 2000eg) were examined independently by Farrah et al. (2002). We classify the host of SN 1997cj as a late galaxy because of the appearance of an arm just above the bulge in our image; Farrah et al. (2002) classify this galaxy as early. We classify the host of SN 1998M as a late galaxy because of the irregular appearance; Farrah et al. (2002) classify this galaxy as early. While these examples of disagreement underscore the subjective nature of even these rough classifications, the rest of our classifications agree. In fact, the relative numbers of early and late galaxies are the same in both of our studies.
With the small number of galaxies of each type in our sample (5 early and 12 late), we could not draw any strong conclusions about the differences between the two populations of SNe Ia. In our sample, the distance residuals of the SNe Ia in the early-type galaxies from the Hubble fit are slightly larger than those of the SNe Ia in late galaxies, unlike the results of the SN Cosmology Project (SCP; Sullivan et al., 2003), but the difference is not statistically significant. Sullivan et al. (2003) found that the scatter of the distance residuals was larger for SNe Ia with late-type hosts: their measured dispersion was 0.159 mag in early-type hosts and 0.235 mag in late-type hosts. This result is to be expected as late-type galaxies tend to contain more dust, increasing the uncertainty in converting apparent magnitudes to absolute magnitudes. With our smaller sample, we calculate a dispersion for the late-type hosts of 0.30 mag (12 galaxies), similar to the value measured by Sullivan et al. (2003). However, we find a dispersion in the early-type hosts of 0.37 mag (5 galaxies), larger than that seen in the SCP sample, but this difference is insignificant given our small sample size. If the distance residuals are converted to units of by dividing by the measured distance error, and the mean dispersion is calculated, values of 1.42 and 0.98 are found for the early and late-type samples, respectively. Figure 6 shows a histogram of the distance residuals for the early and late host populations. One possible reason for the large scatter may be the HZT absorption corrections, which could introduce additional uncertainty. At the same time, the large spread in early types is consistent with statistical expectation if there is no intrinsic difference between the early and late-type samples, suggesting that the HZT absorption corrections are accurate and recover the correct zero-point.
In contrast, the GCD distribution of the events in the early-type galaxies appears to be more skewed to larger radii than in the late-type galaxies, in agreement with the trend seen in low-redshift samples. Ivanov et al. (2000) found that late-type hosts dominated the low-redshift SN Ia events with deprojected GCD 7.5 kpc, and early-type hosts dominated those events with deprojected GCD 7.5 kpc. The distribution of GCDs in our sample is shown in Figure 7. With such a small sample, we can note only coarse measures of the differences between the populations. Zero out of 12 SNe in late-type hosts lie outside of 5 host radii, whereas 2 of the 5 SNe in early-type hosts do. Two out of 12 late types lie outside of 8 kpc, whereas 2 out of 5 early types do. The mean GCD of the early hosts is 2.8 and that of the late hosts is 1.9 in units of scale radii. Conversion of the GCDs to units of kpc yields a similar result. The mean GCDs of the events are 8.0 and 5.6 kpc for early and late-types, respectively. The rms scatter of the galactocentric distances is 3.3 host radii in early types, and it is 1.4 host radii in late types. When calculated in kpc, these values are 8.3 and 4.5 for the early and late samples, respectively. In the low-redshift sample early-type galaxies tend to host events with higher GCDs (Hamuy et al., 1996b; Wang et al., 1997; Ivanov et al., 2000). Although the scatter is large, the higher mean GCD measured for ellipticals in this sample is consistent with the trend found in the low-redshift sample.
Finally, we find, in agreement with Farrah et al. (2002), a similar ratio of the numbers of events in early and late-type galaxies as that seen in the low-redshift sample (e.g., 23/62; Ivanov et al., 2000), with about one third of the events taking place in early-type galaxies. If extinction of events in spiral hosts were high owing to dust, we should expect the high- samples to be biased against events in late-type hosts. The similarity in numbers of events in both types of galaxies is consistent with previous findings that the effects of extinction in spirals do not significantly hinder the SN Ia surveys (Hatano et al., 1998; Sullivan et al., 2003). In addition, the similarity between the ratios of host types in the low and high-redshift samples suggests that the same trends between SN Ia properties and host type in the low-redshift sample are going to be seen in the high-redshift sample; larger numbers of events will make this much clearer.
3.4 Looking for Correlations: Plots of Host-Galaxy Properties
In preparing this sample of host galaxies, our aim was to search for correlations between host galaxy properties and residuals of the fit to the Hubble diagram. Objective tests were performed between each host property that we measured and the properties of the SNe to look for empirical correlations that may not exist in the low-redshift sample or may not be well understood theoretically. If no new correlations are found, the case for using SNe Ia as standard candles will be strengthened. On the other hand, any new correlations will need to be explained and further tested to assess their affect on the measurement of the cosmological constant.
Figures 8-12 show plots correlating the host-galaxy properties and the properties of the SNe. Figure 8 shows the relation between the distance residuals and the normalized angular GCD of the SNe in units of host radii. Figure 9 tests for a correlation between the galaxies’ apparent colors and the distance residuals, where each panel provides a test for an observed color. Figure 10 shows distance residuals vs. host magnitude in the filters observed. We have subtracted the distance modulus from the hosts’ apparent magnitudes. Each panel provides a test for a different filter, except the upper left, which combines the and results. The Figure 11 plot shows the galactocentric distances vs. the integrated apparent colors, where each panel provides a test for a different color. Finally, Figure 12 investigates whether the visual extinction of the events is influenced by the GCD.
We performed fits to the plots shown in Figures 8-12. These fits allowed quantitative constraints to be placed on the possibility of correlations between the properties of the host galaxies and the residuals to the cosmological fits. The results of the fits are given in Table 4, where the first column is the parameter tested on the abscissa, and the second column is the measurement that may be correlated to the parameter. The third column gives the number of degrees of freedom in the fits, and the slope of the best-fitting line is then given with errors in column 4. The error values provided contain all linear fits with consistent with at least a 1% chance of matching the distribution. Any value outside of this range is therefore unacceptable at the 99% confidence level. A value of is given where no reasonable straight-line fit was obtained. The high values for these parameters reveal that the scatter is too large for some subsamples, probably indicating that some SN Ia distance errors have been underestimated.
A slope of zero is acceptable at the 99% confidence level for all but two of the linear fits (cf. Table 4), suggesting no correlation. The only parameters which show possible correlations with distance residual are those of and color. The best fits to the residual vs. plot and the residual vs. plot have slopes of and , respectively. Slopes of 0 for these parameters are ruled out at 99% confidence. This subsample of hosts are all at similar redshifts (), so that the lack of K-corrections is unlikely to explain the scatter seen here. On the other hand, with only 5 and 6 data points, these detections are not robust. For example, the data points, while being best fit by a line with slope , has a Spearman rank coefficient of 0.1, suggesting no correlation. The correlation is more severe and shows a consistent Spearman rank coefficient; however, neither of these correlations is consistent with the tests performed on the largest samples in and . All of the galaxies with and measurements are from the same subsample, events measured in the year 2000. Further suspicion on this correlation is cast by the large (i.e., goodness of fit) for the small subsample (cf. Fig. 9).
While a possible correlation is seen between distance residuals and apparent host colors in the year 2000 subsample, this subsample of distances shows significantly greater scatter in the Hubble fit than the rest of the distances used in this study. The values for the Hubble fits to the SN Ia distances measured before the year 2000 and distances measured in the year 2000 are 0.9 and 3.8, respectively. The large value for the 2000 events are also responsible for the large values for the plots of distance residual vs. and because those plots contain exclusively year 2000 events. It is of concern that the results from these events are also responsible for the correlation detections described above. The data set for these events is comprised of 5-filter photometry, allowing a detailed analysis on dust and SN colors which is in progress and will provide more discussion on this issue (Jha et al., 2004).
Inspired by all of the interesting results regarding the extinction measures () for SNe Ia from previous studies (see §1), we checked for a correlation between the GCD of the events and the measured extinction. Figure 12 shows a plot of these measurements using the extinction values of Tonry et al. (2003). These values are measured by simultaneously and iteratively fitting the observed colors to a reddening-free set of synthetic light curves. The extinction measurements are all assigned errors of 0.1 mag, as measured by Schmidt et al. (1998). The plot reveals no correlation; a least-squares fit to the data gives a slope of 0.02. A jack-knife test, where the one obvious outlier is removed from the data set, yields a slope of . There is no evidence for any correlation between event GCD and extinction at high . No significant difference is seen between extinction values of the early and late samples, again suggesting that extinction is not of great concern in late-type hosts, although it should be pointed out that the 4 highest extinction events were in late-type hosts and 2 of these events occur less than half of a scale length out.
4 Conclusions and Future Work
We have supplied a catalog of high-quality images and measured the photometric properties of 19 high-redshift SN candidate host-galaxies (but one of these was not a true SN Ia). Simple tests show hints of a correlation between host-galaxy apparent and color and SN Ia distance determinations. The scatter of the distance measurements appears to exceed the measured errors for events studied in the year 2000. These hints are currently based on just a handful of galaxies with large distance residuals, but they need to be further investigated. Although we have used the best currently available distances to the Fall 2000 events, their light curves were fit using data alone and the calibration has not been exhaustively verified. Our results suggest that both the distances and the error estimates on these points may be revised upon closer examination. Such an examination is currently being performed by Jha et al. (2004).
We find trends between host type and location of the SNe, as well as the relative numbers of SNe in different host types, in excellent agreement with the low- sample. The extinction measurements, galactocentric distances, and host types for the events in our sample are consistent with previous studies that suggest host extinction does not have a strong effect on SN properties even for events in late-type hosts. These similarities support the current practice of extrapolating properties of the nearby population to high redshifts pending more robust detections of any correlations between distance residuals from cosmological fits and host properties. Further testing will be required to determine if significant reduction in distance error can be achieved using such demographic correlations.
Our catalog contains galaxy photometry that can be used for more sophisticated analysis methods seeking systematic evolution of the SN Ia population with redshift including models of the galaxy progenitor population. More accurate measurements of galaxy colors, including accurate transformations to intrinsic colors, will allow more stringent constraints to be placed on correlations between residuals of the SN Ia distances to the Hubble fit and host galaxy color.
Support for this work at the University of Washington was provided by NSF grant AST-009855 and by NASA grant AR-09201 from the Space Telescope Science Institute (STScI), which is operated by the Association of Universities for Research in Astronomy, Inc., under NASA contract NAS5-26555. A.C. aknowledges the support of CONICYT (Chile) through FONDECYT grants 1000524 and 7000524. A.V.F.’s group at U.C. Berkeley is supported by NSF grant AST-0206329 and by NASA grant GO-09118 from STScI. We thank the anonymous referee for many very helpful suggestions.
References
- Abraham & van den Bergh (2001) Abraham, R. G., & van den Bergh, S. 2001, Science, 293, 1273
- Aguirre (1999) Aguirre, A. 1999, ApJ, 525, 583
- Brinchmann et al. (1998) Brinchmann, J., et al. 1998, ApJ, 499, 112
- Carroll et al. (1992) Carroll, S. M., Press, W. H., & Turner, E. L. 1992, ARA&A, 30, 499
- Domínguez et al. (2001) Domínguez, I., Höflich, P., & Straniero, O. 2001, ApJ, 557, 279
- Drell et al. (2000) Drell, P. S., Loredo, T. J., & Wasserman, I. 2000, ApJ, 530, 593
- Farrah et al. (2002) Farrah, D., Meikle, W. P. S., Clements, D., Rowan-Robinson, M., & Mattila, S. 2002, MNRAS, 336, L17
- Filippenko (1997) Filippenko, A. V. 1997, ARA&A, 35, 309
- Garnavich et al. (1998) Garnavich, P. M., et al. 1998, ApJ, 493, L53
- Hamuy et al. (1996a) Hamuy, M., et al. 1996a, AJ, 112, 2408
- Hamuy et al. (1996b) Hamuy, M., Phillips, M. M., Suntzeff, N. B., Schommer, R. A., Maza, J., & Aviles, R. 1996b, AJ, 112, 2391
- Hamuy et al. (1996c) Hamuy, M., Phillips, M. M., Suntzeff, N. B., Schommer, R. A., Maza, J., & Aviles, R. 1996c, AJ, 112, 2398
- Hamuy et al. (1996d) Hamuy, M., Phillips, M. M., Suntzeff, N. B., Schommer, R. A., Maza, J., Smith, R. C., Lira, P., & Aviles, R. 1996d, AJ, 112, 2438
- Hamuy & Pinto (1999) Hamuy, M., & Pinto, P. A. 1999, AJ, 117, 1185
- Hamuy et al. (2000) Hamuy, M., Trager, S. C., Pinto, P. A., Phillips, M. M., Schommer, R. A., Ivanov, V., & Suntzeff, N. B. 2000, AJ, 120, 1479
- Hatano et al. (1998) Hatano, K., Branch, D., & Deaton, J. 1998, ApJ, 502, 177
- Höflich et al. (2000) Höflich, P., Nomoto, K., Umeda, H., & Wheeler, J. C. 2000, ApJ, 528, 590
- Höflich et al. (1998) Höflich, P., Wheeler, J. C., & Thielemann, F.-K. 1998, ApJ, 495, 617
- Holtzman et al. (1995) Holtzman, J. A., Burrows, C. J., Casertano, S., Hester, J. J., Trauger, J. T., Watson, A. M., & Worthey, G. 1995, PASP, 107, 1065
- Howell (2001) Howell, D. A. 2001, ApJ, 554, L193
- Ivanov et al. (2000) Ivanov, V. D., Hamuy, M., & Pinto, P. A. 2000, ApJ, 542, 588
- Jha et al. (2004) Jha, S., et al. 2004, in prep.
- Mazzali et al. (2001) Mazzali, P. A., Nomoto, K., Cappellaro, E., Nakamura, T., Umeda, H., & Iwamoto, K. 2001, ApJ, 547, 988
- Perlmutter et al. (1997) Perlmutter, S., et al. 1997, ApJ, 483, 565
- Perlmutter et al. (1998) Perlmutter, S., et al. 1998, Nature, 391, 51
- Perlmutter et al. (1999) Perlmutter, S., et al. 1999, ApJ, 517, 565
- Phillips (1993) Phillips, M. M. 1993, ApJ, 413, L105
- Pinto & Eastman (2000) Pinto, P. A., & Eastman, R. G. 2000, ApJ, 530, 757
- Riess et al. (1996) Riess, A. G., Press, W. H., & Kirshner, R. P. 1996, ApJ, 473, 88
- Riess et al. (1998) Riess, A. G., et al. 1998, AJ, 116, 1009
- Riess et al. (1999) Riess, A. G., et al. 1999, AJ, 117, 707
- Schmidt et al. (1998) Schmidt, B. P., et al. 1998, ApJ, 507, 46
- Spergel et al. (2003) Spergel, J., et al. 2003, astro-ph, 0302209
- Sullivan et al. (2003) Sullivan, M., et al. 2003, MNRAS, 340, 1057
- Timmes et al. (2003) Timmes, F. X., Brown, E. F., & Truran, J. W. 2003, ApJ, 590, L83
- Tonry et al. (2003) Tonry, J. L., et al. 2003, ApJ, in press (astro-ph/0305008)
- Totani & Kobayashi (1999) Totani, T., & Kobayashi, C. 1999, ApJ, 526, L65
- Umeda et al. (1999a) Umeda, H., Nomoto, K., Kobayashi, C., Hachisu, I., & Kato, M. 1999a, ApJ, 522, L43
- Umeda et al. (1999b) Umeda, H., Nomoto, K., Yamaoka, H., & Wanajo, S. 1999b, ApJ, 513, 861
- van den Bergh (2001) van den Bergh, S. 2001, AJ, 122, 621
- Wang et al. (1997) Wang, L., Höflich, P., & Wheeler, J. C. 1997, ApJ, 483, L29
| SNe | RA (2000) | DEC (2000) | Filter | Epochs | Exp. (sec) | Baseline |
|---|---|---|---|---|---|---|
| SN1997ce | 17:07:48 | 44:00:39 | F675W | 7 | 6200 | 1997-05-15 - 1998-06-29 |
| SN1997ce | 17:07:48 | 44:00:39 | F814W | 7 | 8000 | 1997-05-15 - 1998-06-29 |
| SN1997cj | 12:37:10 | 62:26:01 | F675W | 6 | 4800 | 1997-05-25 - 1998-05-18 |
| SN1997cj | 12:37:10 | 62:26:01 | F814W | 6 | 6700 | 1997-05-25 - 1998-05-18 |
| SN1997ck | 16:53:00 | 35:02:59 | F850LP | 6 | 14000 | 1997-05-14 - 1997-06-21 |
| SN1998I | 08:04:55 | 05:16:01 | F675W | 6 | 4800 | 1998-02-02 - 1999-02-08 |
| SN1998I | 08:04:55 | 05:16:01 | F814W | 6 | 7400 | 1998-02-02 - 1999-02-08 |
| SN1998J | 09:31:13 | -04:45:18 | F675W | 6 | 4800 | 1998-02-03 - 1999-02-14 |
| SN1998J | 09:31:13 | -04:45:18 | F814W | 6 | 7000 | 1998-02-03 - 1999-02-14 |
| SN1998M | 11:33:47 | 04:04:48 | F675W | 5 | 4000 | 1998-02-03 - 1998-03-30 |
| SN1998M | 11:33:47 | 04:04:48 | F814W | 5 | 5800 | 1998-02-03 - 1998-03-30 |
| SN1998aj | 09:27:59 | -05:00:02 | F850LP | 6 | 19600 | 1998-04-09 - 1998-10-16 |
| SN1999Q | 08:00:48 | 05:31:45 | F675W | 6 | 4800 | 1999-02-01 - 1999-03-07 |
| SN1999Q | 08:00:48 | 05:31:45 | F814W | 6 | 7200 | 1999-02-01 - 1999-03-08 |
| SN1999U | 09:26:46 | -05:37:39 | F675W | 6 | 4800 | 1999-02-01 - 1999-03-08 |
| SN1999U | 09:26:46 | -05:37:39 | F814W | 6 | 6600 | 1999-02-01 - 1999-03-08 |
| SN1999fj | 02:28:20 | 00:39:08 | F814W | 1 | 2400 | 2000-09-21 |
| SN1999fj | 02:28:20 | 00:39:08 | F850LP | 1 | 2600 | 2000-09-21 |
| SN1999fk | 02:28:55 | 01:16:26 | F814W | 2 | 6600 | 2000-09-17 - 2001-02-24 |
| SN1999fk | 02:28:55 | 01:16:26 | F850LP | 2 | 6800 | 2000-09-17 - 2001-02-24 |
| SN1999fn | 04:14:07 | 04:17:52 | F675W | 1 | 2400 | 2000-04-03 |
| SN1999fn | 04:14:07 | 04:17:52 | F814W | 1 | 2400 | 2000-04-03 |
| SN1999fn | 04:14:07 | 04:17:52 | F850LP | 1 | 2600 | 2000-04-03 |
| SN2000dy | 23:25:37 | -00:22:31 | F555W | 3 | 3000 | 2000-12-07 - 2001-05-05 |
| SN2000dy | 23:25:37 | -00:22:31 | F675W | 4 | 5600 | 2000-12-07 - 2001-05-05 |
| SN2000dy | 23:25:37 | -00:22:31 | F814W | 4 | 7800 | 2000-12-06 - 2001-05-05 |
| SN2000dz | 23:30:42 | 00:18:45 | F450W | 3 | 3000 | 2000-11-13 - 2001-05-10 |
| SN2000dz | 23:30:42 | 00:18:45 | F555W | 5 | 4400 | 2000-11-13 - 2001-05-10 |
| SN2000dz | 23:30:42 | 00:18:45 | F675W | 7 | 9600 | 2000-11-13 - 2001-05-10 |
| SN2000dz | 23:30:42 | 00:18:45 | F814W | 7 | 14900 | 2000-11-13 - 2001-05-10 |
| SN2000dz | 23:30:42 | 00:18:45 | F850LP | 3 | 7700 | 2000-11-13 - 2001-05-10 |
| SN2000ea | 02:09:55 | -05:28:12 | F450W | 4 | 3600 | 2000-11-10 - 2001-06-08 |
| SN2000ea | 02:09:55 | -05:28:12 | F555W | 6 | 5200 | 2000-11-10 - 2001-06-08 |
| SN2000ea | 02:09:55 | -05:28:15 | F675W | 8 | 10400 | 2000-11-10 - 2001-07-01 |
| SN2000ea | 02:09:55 | -05:28:15 | F814W | 8 | 16300 | 2000-11-10 - 2001-07-01 |
| SN2000ea | 02:09:55 | -05:28:12 | F850LP | 5 | 10400 | 2000-11-10 - 2001-06-08 |
| SN2000ec | 02:11:33 | -04:13:51 | F450W | 4 | 3800 | 2000-11-10 - 2001-06-21 |
| SN2000ec | 02:11:33 | -04:13:51 | F555W | 6 | 5200 | 2000-11-10 - 2001-06-21 |
| SN2000ec | 02:11:33 | -04:13:53 | F675W | 8 | 10400 | 2000-11-10 - 2001-06-21 |
| SN2000ec | 02:11:33 | -04:13:53 | F814W | 8 | 16300 | 2000-11-10 - 2001-06-21 |
| SN2000ec | 02:11:33 | -04:13:51 | F850LP | 4 | 10500 | 2000-11-10 - 2001-06-21 |
| SN2000ee | 02:27:35 | 01:11:55 | F450W | 4 | 3800 | 2000-11-12 - 2001-06-22 |
| SN2000ee | 02:27:35 | 01:11:55 | F555W | 6 | 5200 | 2000-11-11 - 2001-06-22 |
| SN2000ee | 02:27:35 | 01:11:55 | F675W | 7 | 8400 | 2000-11-11 - 2001-06-22 |
| SN2000ee | 02:27:35 | 01:11:55 | F814W | 7 | 12000 | 2000-11-11 - 2001-06-22 |
| SN2000ee | 02:27:35 | 01:11:55 | F850LP | 5 | 9900 | 2000-11-11 - 2001-06-22 |
| SN2000eg | 02:30:22 | 01:03:54 | F450W | 4 | 3800 | 2000-11-12 - 2001-06-20 |
| SN2000eg | 02:30:22 | 01:03:54 | F555W | 6 | 5200 | 2000-11-12 - 2001-06-20 |
| SN2000eg | 02:30:22 | 01:03:54 | F675W | 7 | 8400 | 2000-11-12 - 2001-06-20 |
| SN2000eg | 02:30:22 | 01:03:54 | F814W | 7 | 12000 | 2000-11-12 - 2001-06-20 |
| SN2000eg | 02:30:22 | 01:03:54 | F850LP | 4 | 9900 | 2000-11-12 - 2001-06-20 |
| SN2000eh | 04:15:02 | 04:23:27 | F450W | 3 | 3000 | 2000-11-15 - 2001-07-19 |
| SN2000eh | 04:15:03 | 04:23:24 | F555W | 5 | 4000 | 2000-11-15 - 2001-07-19 |
| SN2000eh | 04:15:03 | 04:23:23 | F675W | 6 | 8100 | 2000-11-15 - 2001-07-19 |
| SN2000eh | 04:15:03 | 04:23:23 | F814W | 6 | 10500 | 2000-11-15 - 2001-07-19 |
| SN2000eh | 04:15:02 | 04:23:27 | F850LP | 3 | 6900 | 2000-11-15 - 2001-07-20 |
| SN | Rad. (′′)bbScale length of the host galaxy. Measurement technique described in text. | ) | ) | ) | ) | ) |
|---|---|---|---|---|---|---|
| 2000dz | -0.010.02 | 0.030.15 | 0.110.08 | 0.020.03 | 0.060.04 | 0.000.11 |
| 2000ee | -0.060.05 | 0.450.50 | 0.080.20 | -0.030.09 | 0.120.09 | 0.130.21 |
| 2000eg | 0.000.04 | -0.260.15 | -0.080.05 | -0.040.05 | -0.020.07 | -0.010.12 |
| 2000ez | 0.010.04 | -0.180.22 | -0.040.15 | -0.020.06 | -0.030.06 | 0.050.12 |
| 2000dy | -0.200.17 | — | 1.010.72 | 0.080.52 | 0.230.43 | — |
| 2000ec | -0.140.08 | — | -0.690.72 | -0.100.31 | -0.190.21 | -0.160.65 |
| 2000eh | -0.263.57 | 1.680.82 | 0.050.49 | -0.030.31 | 0.090.32 | -0.132.12 |
| SNe | GCD (′′) | Rad. (′′) | Z | ()SN | ()Z | Type | |||||
|---|---|---|---|---|---|---|---|---|---|---|---|
| SN1997ce | 0.41 | 0.460.07 | – | – | 22.800.13 | 22.390.15 | – | 0.44 | 42.080.21 | 42.13 | late |
| SN1997cj | 0.76 | 0.350.02 | – | – | 22.420.03 | 21.940.04 | – | 0.50 | 42.550.23 | 42.46 | late |
| SN1997ck | – | – | – | – | – | – | – | 0.97 | 44.130.38 | 44.21 | – |
| SN1998I | 0.10 | 0.640.12 | – | – | 23.320.31 | 22.300.23 | – | 0.89 | 43.810.26 | 43.98 | late |
| SN1998J | 0.23 | 0.620.04 | – | – | 23.360.09 | 22.300.06 | – | 0.83 | 44.010.26 | 43.80 | late |
| SN1998M | 2.39 | 1.290.27 | – | – | 20.940.13 | 20.510.19 | – | 0.63 | 42.920.23 | 43.06 | late |
| SN1998aj | 1.69 | 0.320.73 | – | – | – | – | 23.350.15 | 0.83 | 44.430.35 | 43.80 | early |
| SN1999Q | 2.27 | 0.310.07 | – | – | 24.360.14 | 23.760.14 | – | 0.46 | 42.620.21 | 42.24 | early |
| SN1999U | 0.41 | 0.590.07 | – | – | 23.160.08 | 22.730.10 | – | 0.50 | 42.540.35 | 42.46 | early |
| SN1999fj | 0.95 | 0.520.17 | – | – | – | 22.940.17 | 22.290.23 | 0.82 | 43.760.26 | 43.76 | late |
| SN1999fk | 1.32 | 0.290.02 | – | – | – | 22.730.09 | 22.190.08 | 1.06 | 44.230.27 | 44.45 | late |
| SN1999fn | 0.32 | 0.330.97 | – | – | 25.630.59 | 24.780.38 | 25.160.94 | 0.49 | 42.180.20 | 42.40 | late |
| SN2000dy | 0.1 | 0.280.09 | – | 25.950.65 | 24.560.40 | 23.990.32 | – | 0.61 | – | 42.97 | early |
| SN2000dz | 0.35 | 0.440.01 | 23.500.10 | 22.870.04 | 22.010.01 | 21.640.01 | 21.480.08 | 0.50 | 42.700.26 | 42.46 | late |
| SN2000ea | 1.49 | 0.360.01 | 24.450.14 | 23.870.07 | 22.900.03 | 22.380.02 | 21.990.05 | 0.42 | 41.390.27 | 42.01 | late |
| SN2000ec | 0.10 | 0.290.04 | – | 25.140.32 | 24.840.23 | 24.170.15 | 23.830.43 | 0.47 | 42.640.21 | 42.30 | early |
| SN2000ee | 0.67 | 0.450.02 | 24.760.26 | 24.150.08 | 23.310.05 | 22.770.03 | 22.480.10 | 0.47 | 42.650.21 | 42.30 | late |
| SN2000eg | 0.96 | 0.280.01 | 24.220.11 | 23.100.03 | 21.750.01 | 21.010.01 | 20.590.01 | 0.54 | 42.120.24 | 42.66 | late |
| SN2000eh | 0.10 | 0.240.01 | 26.750.79 | 25.230.29 | 23.890.07 | 23.180.05 | 22.720.11 | 0.49 | 42.060.21 | 42.40 | early |
| X axis | Y axis | d.o.f. | Best SlopeaaError ranges contain all linear fits with at least a 1% chance of matching the distribution. Values outside this range are ruled out at 99% confidence. | Best | |
|---|---|---|---|---|---|
| GCD | Distance Residual (mag) | 16 | 0.020.05 | 1.836 | 0.0 |
| Distance Residual (mag) | 5 | 3.677 | |||
| Distance Residual (mag) | 5 | 3.716 | |||
| Distance Residual (mag) | 13 | 0.000.06 | 1.979 | 0.0 | |
| Distance Residual (mag) | 15 | 0.010.07 | 1.751 | 0.1 | |
| Distance Residual (mag) | 9 | 2.655 | 0.2 | ||
| Distance Residual (mag) | 4 | 0.510.42 | 2.723 | 0.1 | |
| Distance Residual (mag) | 5 | 0.830.68 | 1.584 | ||
| Distance Residual (mag) | 13 | 0.280.51 | 1.916 | ||
| Distance Residual (mag) | 8 | 0.040.11 | 2.490 | ||
| GCD | 5 | 0.080.10 | 2.222 | ||
| GCD | 5 | 8.369 | 0.5 | ||
| GCD | 13 | 10.663 | |||
| GCD | 8 | 0.050.07 | 1.013 | 0.0 | |
| GCD | (mag) | 0.020.03ccErrors for vs. GCD were determined by a jack-knife test. | 0.1 |