A survey for water maser emission towards planetary nebulae. New detection in IRAS 17347-3139
Abstract
We report on a water maser survey towards a sample of 27 planetary nebulae (PNe) using the Robledo de Chavela and Medicina single-dish antennas, as well as the Very Large Array (VLA). Two detections have been obtained: the already known water maser emission in K 3-35, and a new cluster of masers in IRAS 17347-3139. This low rate of detections is compatible with the short life-time of water molecules in PNe ( yr). The water maser cluster at IRAS 17347-3139 are distributed on a ellipse of size , spatially associated with compact 1.3 cm continuum emission (simultaneously observed with the VLA). From archive VLA continuum data at 4.9, 8.4, and 14.9 GHz, a spectral index () is derived for this radio source, which is consistent with either a partially optically thick ionized region or with an ionized wind. However, the latter scenario can be ruled out on mass-loss considerations, thus indicating that this source is probably a young PN. The spatial distribution and the radial velocities of the water masers are suggestive of a rotating and expanding maser ring, tracing the innermost regions of a torus formed at the end of the AGB phase. Given that the 1.3 cm continuum emission peak is located near one of the tips of the major axis of the ellipse of masers, we speculate on a possible binary nature of IRAS 17347-3139, where the radio continuum emission could belong to one of the components and the water masers would be associated with a companion.
1 Introduction
Nowadays we know that planetary nebulae (PNe) are the result of the evolution of carbon- and oxygen-rich red giants, after going through the AGB and a brief ( 1000 yr) proto-PN phase (Kwok, 1993). In a simplified picture, a PN forms when the remnant (central) star reaches an effective temperature (Teff) of 30 000 K and the envelope ejected during the AGB phase is ionized. However, the transformation of an AGB star into a PN is much more complex. The spherical symmetry typical of AGB envelopes is lost in the transition, and most PNe exhibit elliptical and bipolar shells (Balick, 1987). In addition, highly collimated outflows develop in the proto-PN and/or PN phase, which may play a crucial role in the dynamical and shaping processes of PNe (Sahai & Trauger, 1998).
Envelopes of evolved stars with oxygen-rich chemistry are characterized by strong OH, H2O and SiO maser emission (Reid & Moran, 1981; Elitzur, 1992; Habing, 1996). Because of its high intensity and the possibility to be observed at high spatial and spectral resolution, maser emission is ideal to study dynamical and physical conditions of circumstellar envelopes (Habing, 1996; Engels, 2002). Masers are stratified in these envelopes with SiO masers located close to the stellar surface, water masers at about 10–100 AU, and OH masers further away, up to AU (Lane et al., 1987). In the transformation of an AGB star into a PN, masers disappear sequentially (Lewis, 1989). When pulsation and mass loss cease at the tip of the AGB, SiO masers disappear (Gómez et al., 1990; Nyman, Hall, & Olofsson, 1998; Engels, 2002), while water and OH masers can still be found in the proto-PN phase (Likkel & Morris, 1988; Marvel & Boboltz, 1999; Sahai et al., 1999a, b). As the star enters its PN phase, water molecules are rapidly destroyed by the ionizing radiation (Lewis, 1989; Gómez et al., 1990). Thus, water masers are not expected in PNe, and only OH masers seem to persist at the very early stages of their evolution.
Surprisingly, water maser emission has recently been found in the PN K 3-35 (Miranda et al. 2001, hereafter MGAT01). K 3-35 is a young bipolar PN that contains a bright compact core, a dense equatorial torus and a bipolar precessing jet, with all these structures surrounded by a faint elliptical envelope (Aaquist & Kwok, 1989; Aaquist, 1993; Miranda et al., 1998, 2000, 2001). Water maser emission was detected in two different regions of K 3-35: in the torus, at a distance of about 85 AU from the center (assuming a distance of 5 kpc to K 3-35, Zhang 1995), and at the tips of the bipolar radio jet, at 5,000 AU from the central star. The time scale over which water molecules are expected to survive destruction by the ionization front is very short, years (Gómez et al., 1990). Thus, it was inferred that K 3-35 had been caught at the very moment of its transformation into a PN (MGAT01). In addition, water maser emission was not expected so far away from the central star, because of the lack of physical conditions to provide the energy to pump the water maser (Marvel, 1997). The bipolar jet in K 3-35 was proposed as the excitation agent of the distant water masers, because of the former’s spatial and kinematic association with the latter. For this source, some unknown and local shielding mechanism against ionizing radiation was invoked to explain why water molecules still survive. Some recent models of gas-phase chemistry, however, predict the production of water and other molecules in the envelopes of PN, long after the original molecules were photodissociated (Ali et al., 2001; Hasegawa et al., 2000).
To better understand the phenomenon of water emission in PNe, and to determine whether K 3-35 is representative of this kind of sources, or an extremely rare case, we have undertaken a survey of water maser emission towards PNe. In this paper we present the results of our survey. A technical description of the observations is presented in §2. Our results are presented in §3 and their discussion in §4. Finally, we summarize our conclusions in §5.
2 Observations
We observed the 6523 transition of the water molecule (rest frequency 22235.080 MHz) towards a sample of planetary nebulae (see Table 1), using the NASA 70-m antenna (DSS-63) at Robledo de Chavela (Spain), the 32-m antenna111The Medicina VLBI radio telescope is operated by the Radioastronomy Institute of the Italian National Research Council (CNR) at Medicina (Italy), and the Very Large Array (VLA) of the National Radio Astronomy Observatory222The National Radio Astronomy Observatory is a facility of the National Science Foundation operated under cooperative agreement by Associated Universities, Inc. (USA). Several sources were observed with more than one telescope. Further simultaneous water maser and 1.3 cm continuum observations were made with the VLA towards IRAS 17347-3139, the source where maser emission was first detected at Robledo de Chavela. We also analyzed VLA archive continuum data of this source. Technical details of these observations are described below.
The observed sources were chosen with the criterion of showing some sign of being associated with molecular gas and/or dust, e.g., CO or OH lines, or (far or near) infrared emission.
2.1 Robledo de Chavela 70-m
The 1.3 cm receiver of this antenna was a cooled HEMT. Water maser observations were carried out using a 256-channel autocorrelation spectrometer, covering a bandwidth of 10 MHz, which provides a velocity resolution of 0.5 km s-1. At this frequency, the half-power beamwidth of the telescope is . Spectra were taken in frequency switching mode, with a switch of 5 MHz, thus providing an effective velocity coverage of 202.4 km s-1 (15 MHz) centered at the of each source. Only left circular polarization was processed. Calibration was performed using a noise diode. These observations were carried out between 2002 April and August, with system temperatures between 45 and 135 K, and a total integration time of 20 min per source. The rms pointing accuracy was better than 15′′. A total of 15 sources were observed with this antenna (see Table 1). The data reduction was performed using the CLASS package, which is part of the GAG software package developed at IRAM and Observatoire de Grenoble.
2.2 Medicina 32-m
Observations with the Medicina 32-m antenna were carried out in several periods from March to October 2002, making use of a digital autocorrelator spectrometer with a bandwidth of 8 MHz (108 km s-1 at the frequency of the H2O 616–523 line) and a spectral resolution of 9.77 kHz. A GaAs FET amplifier was used as a front-end, which allows for zenith system temperatures of 120 K under good weather conditions. During the observations the system temperature varied from 130 to 290 K depending on weather conditions and elevation. Observations were made in total power mode, with integrations of 5 min on- and 5 min off-source. Then the observation was repeated as many times as needed to reach typical 1 rms noise levels of 0.5 Jy. For each source, all spectra taken on the same day were averaged and smoothed to a spectral resolution of 0.263 km s-1. The antenna gain as a function of elevation was determined by total power integrations on DR21 (adopted flux density 18.8 Jy) repeated every 1–2 hours. Pointing was checked on strong water maser sources and the resulting accuracy is 20′′. Nine sources were observed with this antenna. The data reduction was performed with CLASS.
2.3 Very Large Array
The VLA observations were made in two different periods. As part of our water maser survey, on 2002 May 5 we observed 14 planetary nebulae in the A configuration. The integration time for each source was 15 minutes. We sampled 63 channels with 97.7 kHz resolution (1.3 km s-1 at the observed frequency), in both right and left circular polarizations. The source 3C 48 (catalog ) was used as the primary calibrator for flux density, for which we adopted a flux density of 1.13 Jy using the latest VLA values (1999.2). Amplitude calibration was performed using the model of 3C 48 downloaded from the NRAO web site. Phase calibrators used for each target source are listed in Table 2. The calibration and data reduction were carried out using the Astronomical Image Processing System (AIPS) of NRAO. Maps were produced setting the “robust” weight parameter to 0, to optimize the tradeoff between angular resolution and sensitivity, and deconvolved using the CLEAN algorithm. The resulting synthesized beams are also shown in Table 2. In K 3-35, self-calibration was performed, given its strong water maser emission. To mitigate the Gibbs ringing, spectral Hanning smoothing was applied to all sources, giving a final velocity resolution of 2.6 km s-1.
On 2002 July 9 we made simultaneous observations of 1.3 cm continuum and water maser towards IRAS 17347-3139 with the B configuration, using the 4IF spectral line mode of the VLA. For the continuum measurements, we used two of the four IFs, with a bandwidth of 25 MHz, and seven channels 3.125 MHz wide each, centered at 22285.080 MHz. For the maser emission observations (made with the other two IFs) we used a bandwidth of 3.125 MHz, sampled with 63 channels of 48.8 kHz each (0.66 km s-1). Spectral Hanning smoothing was applied, with a final velocity resolution of 1.3 km s-1. The source 3C 286 (catalog ) was used as the primary calibrator for flux density (adopted flux density = 2.53 Jy), while the source J1745-290 was used as phase calibrator (bootstrapped flux density = 0.9860.008 Jy). The on-source integration time was 1 h. Initial calibration was done separately for each pair of IFs to remove electronic phase differences between IFs. Self-calibration was performed using the strongest water maser component identified in the narrow bandwidth. The phase and amplitude corrections were then applied to both the narrow and broad bandwidth, removing both atmospheric and instrumental errors. Cleaned maps for both line and continuum were produced by setting the “robust” weight parameter to 0, resulting in a synthesized beam of (P.A = 26).
Finally, we have analyzed VLA archive continuum data at 4.9, 8.4, and 14.9 GHz in IRAS 17347-3139 (from VLA project AP192). These data were observed in DnC configuration on 1991 February 24. Two independent IFs of 50 MHz bandwidth were used, providing an effective bandwidth of 100 MHz. Both right and left circular polarizations were observed. The on-source integration time at each of the observed frequecies was 10 minutes. The source 3C 286 was used as flux calibrator, with adopted flux densities of 3.45 Jy (14.9 GHz), 5.21 Jy (8.4 GHz), and 7.48 Jy (4.9 GHz). The phase calibrator was B1730-130, with bootstrapped flux densities of 7.020.20 Jy (14.9 GHz), 6.660.06 Jy (8.4 GHz) and 6.630.02 Jy (4.9 GHz). Data were self calibrated, and cleaned images were obtained setting the “robust” weight parameter to 0, resulting in synthesized beams of (P.A. = 44), (P.A.= 40) and (P.A.= 61) at 14.9, 8.4, and 4.9 GHz respectively.
3 Results
3.1 Survey of water masers
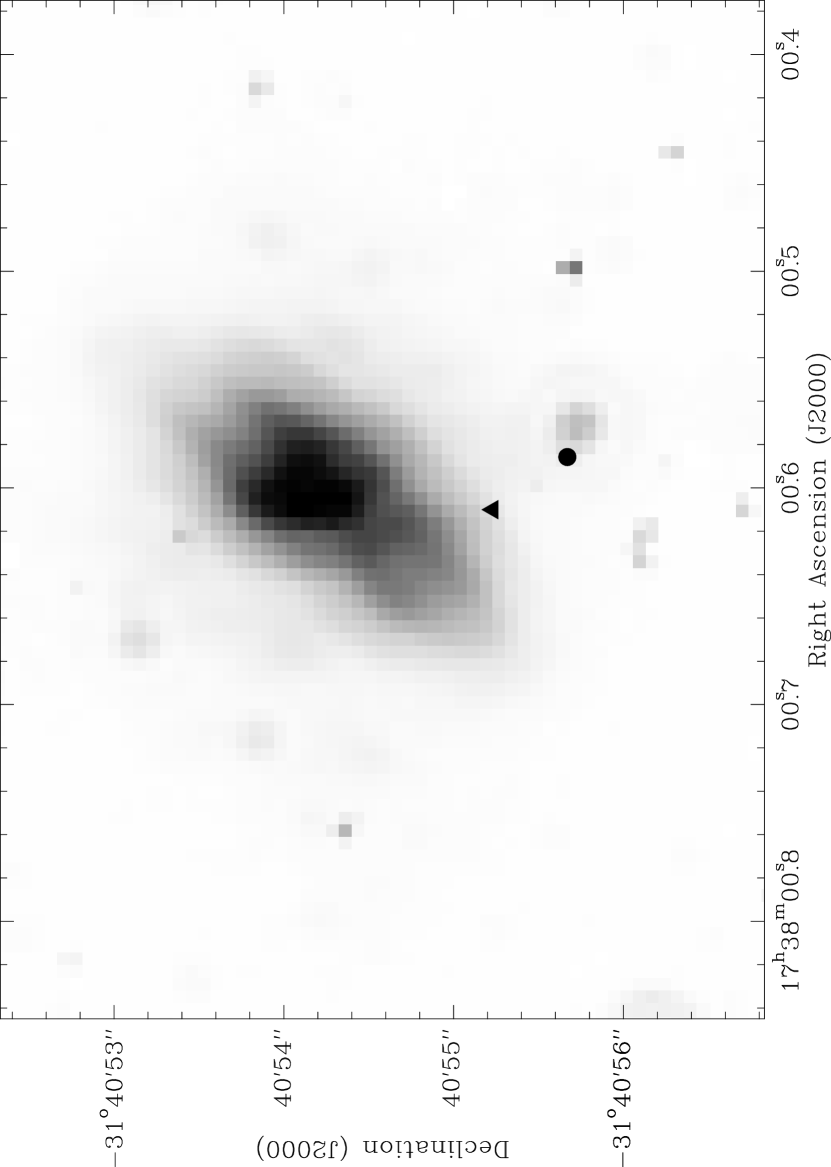
Table 1 shows the result of our survey of water maser emission towards a sample of 27 planetary nebulae. Emission was detected in two sources of the sample. One of them, K 3-35, was previously known to harbor a water maser, being the first confirmed case of a bona-fide planetary nebula showing this kind of emission (MGAT01). We have also obtained a new detection towards IRAS 17347-3139 with the Robledo antenna, on day 131 of 2002 (and confirmed with the VLA, on day 189 of 2002, see Fig. 1), which could represent the second case of a planetary nebula associated with water maser emission.
3.2 IRAS 17347-3139
3.2.1 Radio continuum emission
Radio continuum emission associated with IRAS 17347-3139 is detected at all four observed frequencies, unresolved at 4.9, 8.4, and 14.9 GHz, and marginally resolved at 22.3 GHz (deconvolved size ). This continuum emission is located at , (estimated from the 22.3 GHz image, absolute position error ). From the measured flux densities (Table 3), we derive a spectral index () of between 4.9 and 14.9 GHz (see Fig. 4), indicating a thermal nature for this radio source. The measured 22.3 GHz flux density is a factor of two lower than its extrapolation using this spectral index ( versus mJy). Part of this loss of flux density could be due to source variability, since the 22.3 GHz data were observed at a different epoch. Another possibility is that the 22.3 GHz observations, being obtained with a more extended VLA configuration than at lower frequencies, resolve out weak, extended emission due to the lack of short spacings in the interferometer, thus resulting in a net decrease of flux density. We also note that these data were observed at low elevation, which makes the absolute flux calibration at this wavelength more uncertain. However, it is also likely that a significant fraction of the difference can be explained by the spectral index becoming flat between 14.9 and 22.3 GHz. This could indicate that the continuum emission becomes optically thin between these frequencies. Quasi-simultaneous, matching-beam observations around this frequency range would be needed to test this possibility, ruling out variability, resolution, and calibration effects.
Extended and weaker radio continuum emission, located southeast from the unresolved source, is also detected in the 4.9 and 8.4 GHz maps. With such a large separation, this extended emission is not likely to be related to IRAS 17347-3139.
3.2.2 Water maser emission
Thirteen water maser spots were detected with the VLA on day 189 of 2002 (see Table 4 and Fig. 2). The spectrum of the whole maser emission, integrated over an area of , can be seen in Fig. 1b. The maser spots trace an elliptical structure, with the radio continuum peak near one of the tips of its major axis. A least-square fit of the maser positions to an ellipse gives axes of , with its major axis oriented at PA . From the axis ratio of the ellipse, if we assume that this ellipse is tracing a circular ring, the axis of the ring would be oriented at with respect to the line of sight.
In addition, an analysis of the variation of the radial velocities in the ellipse reveals some trends. If we assume that the mean value of the observed velocities ( km s-1) represents the “systemic velocity” of the maser spots, the maximum (redshifted) radial velocities of 3-4 km s-1 tend to cluster towards the west of the maser distribution, while the maximum (blueshifted) velocities of 3 km s-1 are at the east. This would suggest the presence of rotational motions, although the kinematic trend is not compatible with pure rotation, since the maximum velocities are not exactly at the tips of the major axis of the ellipse. A combination of both rotation and expansion in a toroidal structure is necessary to explain this kinematic trend (see §4.2.4).
3.3 K 3-35
With the VLA, we have detected four maser spots at the central region of this source (see Table 4 and Fig 3). In order to compare the positions of the two sets of water maser observations (MGAT01 and this paper), we have obtained a continuum map at 1.3 cm by averaging 51 channels free of water maser emission. The peak of the continuum emission is located at , (absolute position error ), which is consistent, within the errors, with the position reported by MGAT01. The two sets of water masers where then aligned with respect to the 1.3 cm continuum peak position, assuming it coincident for the two epochs, since the relative positional accuracy between continuum and masers within each map () is better than their absolute position accuracy (). However, we cannot discard the presence of small variations in the ionized structure of the source, that can produce slight changes in the position of the continuum peak. The overlay (Fig. 3) shows that the position and velocity distributions of the maser spots in 2002 are different from those observed in 1999 by MGAT01, which is not surprising giving the typical variability of this kind of emission. In particular, no maser emission was detected at the tips of the bipolar lobes of the PN at a 3 level of 7 mJy, which was instead detected in MGAT01. The maser spots observed in 2002 seem to correspond to the northwestern masers of the central region C detected in 1999, but shifted by toward the west. However, the time difference between the two epochs ( 2.5 yr) is too long to make an unambiguous identification of the same water maser spots in the two epochs. Therefore a derivation of proper motions is probably meaningless. The observed positional variations would also be compatible with destruction of the water maser shell zone observed in 1999 by an ionization/shock front and the creation of a new maser zone ahead of the shock. New, more closely spaced multi-epoch observations, and with high S/N for the continuum emission (to use it as an accurate position reference for the masers), are crucial to interpret the observed positional variations of the water maser spots in K 3-35.
4 Discussion
4.1 The lifetime of water molecules in PN
Two out of 27 PNe observed present water maser emission. This low rate of detection seems to indicate that water molecules are destroyed in a very short time after the star enters the PN phase, or that the excitation conditions for maser emission cease rapidly. The destruction time of water molecules in PNe has been estimated to be yr (Gómez et al., 1990). It is difficult to make a quantitative statistical study since we do not know the exact age range of our sample (the selection criteria were of qualitative nature and the sample is probably biased towards young PNe), and the sensitivities of the telescopes used are significantly different. Nevertheless, if we assume that our sample of PNe is homogeneously distributed in age, along the yr that the PN phase lasts, our observed detection rate of 1 out of 26 would be compatible with the estimated yr survival time of water molecules.
In the following we will concentrate the discussion on IRAS 17347-3139, whose maser emission is reported for the first time in this paper.
4.2 IRAS 17347-3139
4.2.1 The distance to IRAS 17347-3139
As far as we know, there is no published information about the distance to this source. A crude estimate for this distance can be obtained taking into account that water maser shells in red giants are located at a radius of 10–100 AU (e.g., Spencer et al. 1979; Bowers et al. 1993). In addition, there is evidence that the water maser shell moves outwards as the star evolves and the mass loss rate increases (Yates & Cohen 1994). Therefore, if the angular radius of of the water maser ring in IRAS 17347-3139 corresponds to a linear radius of AU, a distance of kpc is obtained for the nebula.
As an independent estimate, from the observed flux density at 4.8 GHz and assuming a size of (the deconvolved size of the 22.3 GHz image) for the ionized region, we can use the statistical distance scale for galactic PN proposed by Zhang (1995). We obtain with this method a value of kpc, which is consistent with the lower limit mentioned above.
4.2.2 The nature of IRAS 17347-3139 as a planetary nebula
IRAS 17347-3139 is a source with a large infrared excess (Zijlstra et al., 1989). It shows OH maser emission (Zijlstra et al., 1989) but no SiO maser emission (Nyman, Hall, & Olofsson, 1998). Its IRAS two-color diagram indicates that it is an evolved object (García-Lario et al., 1997). However, this diagram cannot discriminate between proto-PNe and PNe. The classification of IRAS 17347-3139 as a PN was based on the presence of radio continuum emission attributed to an ionized nebula (Zijlstra et al., 1989). Before this classification is conclusively established, other possibilities to explain the radio continuum emission should be ruled out.
Strong radio continuum emission at centimeter wavelengths is observed in the Egg Nebula (catalog ), a well known proto-PN, although its spectral index (2.6), too large to be due to free-free emission, suggests dust as the origin of the radio continuum emission (Jura et al., 2000). However, in IRAS 17347-3139, the spectral index of 0.8, being lower than 2, rules out dust as the origin of the radio continuum emission.
A second possibility to explain the radio continuum emission would be an ionized wind from the central star. In order to test this possibility, we estimated the mass-loss rate required to explain the observed radio continuum emission as arising from an ionized wind, which can be compared with typical values of central stars of proto-PNe and PNe. Assuming a spherical wind with a constant velocity of 1000 km s-1 and an electronic temperature of 10000 K, from the observed flux density at 3.6 cm (Table 4) we obtain a value for the ionized mass-loss rate of yr-1 (Wright & Barlow 1975, Panagia & Felli 1975). For the same set of parameters, collimated winds would require smaller mass-loss rates. For example, a biconical wind (corresponding to a spectral index of 0.6) would require a mass-loss rate ten times smaller, for an angle of aperture of , and a collimated wind with a variable angle of aperture (corresponding to the observed value of the spectral index of between 4.9 and 14.9 GHz) a mass-loss rate three times smaller than a spherical wind (see Reynolds 1986). Therefore, in all cases, the derived mass-loss rates are much larger than those observed in central stars of PNe and proto-PN ( M⊙ yr-1, Patriarchi & Perinotto 1993; Vassiliadis & Wood 1994), which seems to exclude that the radio continuum emission arises in an ionized stellar wind.
All this suggests that the radio continuum emission in IRAS 17347-3139 arises in a partially optically thick ionized nebula and that it is probably a very young PN. If we assume that the radio continuum emission is optically thin for frequencies above GHz, we derive an electronic density of cm-3 for an homogeneous HII region at a distance of 0.8 kpc. The ionizing photon rate required to mantain such an HII region is s-1, that would correspond to a star with T 26 000 K, according to Panagia (1973). This temperature is higher than the T 15 000 K deduced by Zijlstra et al. (1989), but it is more typical of young PNe.
Finally, this source presents also infrared lines of [Ne II] and Br (P. García-Lario 2003, private communication), which confirms its identification as a PN.
4.2.3 Relationship between masers and infrared emission
It is interesting to compare the water maser data with the K-band image of the object, taken with the NICMOS instrument of the Hubble Space Telescope. We have retrieved this image from the HST archive and it is shown in Fig. 5. A preliminary description can be found in Bobrowsky, Greeley, & Meixner (1999). In addition to a faint envelope of in size, the brightest regions of this source trace a clear bipolar structure with a size of and the main nebular axis oriented at PA . The NW lobe is brighter than the SE one and they are separated by a dark lane that suggests the presence of an equatorial torus-like structure.
We also note that there is a positional shift between the nominal infrared position of the nebula given by the HST and the peak position of the radiocontinuum emission, the latter being displaced 1′′ south from the center of the nebula. This angular separation might cast some doubts on the relationship of the radiocontinuum and the water masers with the infrared nebula. However, the 2MASS catalog lists an infrared point source at , (absolute position error ), which is northeast of the radio continuum position, i.e., closer to the latter than the HST image center. An offset of is reasonable even if it is larger than the formal radio continuum position error (), since we do not expect the maximum of the unresolved infrared 2MASS image to exactly coincide with the radio emission, taking into account that the resolved HST image has its maximum in the northern part of the nebula. Therefore, the discrepancy with the HST position is probably due to errors in the HST Guide Star Catalog, which can be of the order of . Moreover, the association between the radio and infrared emissions is reinforced by two further arguments: (1) The thermal nature of the radio source (see §4), which seems to exclude the presence of a background extragalactic source, and (2) the distribution of the water maser spots, with the major axis of the ellipse oriented almost perpendicular to the main nebular axis. This indicates a close relationship and that the water maser emission could arise in the dense equatorial ring related to the dark lane observed in the K-band infrared image.
4.2.4 The ring of water masers
As we mentioned above, to explain the kinematics of the water masers, we need to assume the presence of both rotation and expansion in a ring. The uncertainty in the distance to the source makes it difficult to estimate the velocity component due to Keplerian rotation. If we assume that the expansion and rotation velocity are of the same order, we obtain a reasonable fit for a torus radius of , with a velocity of 2.4 km s-1. For such a rotational velocity, the central mass should be M⊙, where is the distance from the Sun to the source, in kpc. This implies a central mass of M⊙, assuming a distance of 0.8 kpc. The water maser ring could trace the innermost regions of the torus-like density enhancement formed at the very end of the AGB evolution of the precursor star of IRAS 17347-3139.
As already mentioned, the radio continuum emission peak is located out of the ellipse traced by the water maser spots. An explanation for this could be the presence of inhomogeneities in the ionized region. Nevertheless, we also speculate on the possible nature of IRAS 17347-3139 as a binary system, so that the position of the continuum peak represents the true central star, while the water maser ellipse is associated with a companion. Our observations have not enough resolution to confirm the binary nature of this source, since the center of the water maser ellipse and the continuum peak are separated a distance of , smaller than the beam size (see Fig. 2). This interpretation might be confirmed by resolving the ionized region, which would allow us to determine its small-scale geometry, and whether a double source is indeed present.
The water maser emission in both K 3-35 (see MGAT01) and IRAS 17347-3139 (this paper) are suggestive of equatorial ring-like structures which have been formed at the end of the AGB phase. In the case of IRAS 17347-3139, the kinematics of the ring suggests the presence of both rotating and expanding motions, while the observations of K 3-35 are compatible with only expansion in the equatorial plane. In addition, the effective temperature for the central star of K 3-35 should be 60 000 K, as indicated by the He ii emission (Miranda et al., 2000), larger than that obtained for the central star of IRAS 17347-3139 ( 26 000 K). Therefore, it is possible that IRAS 17347-3139 represents an earlier stage in PN formation than K 3-35. The fast wind in IRAS 17347-3139 has not yet been able to sweep up enough material in the (dense) equatorial plane and the water maser zone still preserves in part its original kinematics.
5 Conclusions
In this paper, we present a survey for water maser emission towards a sample of 27 planetary nebulae, using the antennas at Robledo de Chavela, and Medicina, as well as the VLA. Our main conclusions are as follow:
-
1.
Besides the known water maser in K 3-35 (MGAT01), we have detected a new source of maser emission towards IRAS 17347-3139 using the Robledo antenna (and later confirmed it with the VLA).
-
2.
The low rate of new detections (1 out of 26) is compatible with the assumption that water molecules are rapidly destroyed ( yr) after the star enters the PN phase.
-
3.
Water masers in IRAS 17347-3139, observed with the VLA, show an elliptical distribution. This spatial distribution, and their radial velocities are suggestive of a rotating and expanding maser ring, tracing the innermost regions of a torus formed at the end of the AGB phase.
-
4.
The continuum emission in IRAS 17347-3139 seems to arise from a partially optically thick ionized region, since the mass loss rate obtained under the assumption of a wind is much larger than the values observed in PNe and proto-PNe.
-
5.
We speculate on the possible nature of IRAS 17347-3139 as a binary star, where the peak of the radio continuum emission represents one of the components, and the maser ellipse is associated with a companion.
References
- Aaquist (1993) Aaquist, O. B. 1993, A&A, 267, 260.
- Aaquist & Kwok (1989) Aaquist, O. B., & Kwok, S. 1989, A&A, 222, 227
- Ali et al. (2001) Ali, A., Shalabiea, O. M., El-Nawawy, M. S., & Millar, T. J. 2001, MNRAS, 325, 881
- Balick (1987) Balick, B. 1987, AJ, 94, 671.
- Bobrowsky, Greeley, & Meixner (1999) Bobrowsky, M., Greeley, B., & Meixner, M. 1999, BAAS, 31, 1536
- Bowers et al. (1993) Bowers P.F., Claussen, M.J., Johnston K.J. 1993, AJ, 105, 284
- Elitzur (1992) Elitzur, M. 1992, ARA&A, 30, 75.
- Engels (2002) Engels, D. 2002, A&A, 388, 252
- García-Lario et al. (1997) Garcia-Lario, P., Manchado, A., Pych, W., & Pottasch, S. R. 1997, A&AS, 126, 479
- Gómez et al. (2003) Gómez, Y., Miranda, L. F., Anglada, G., & Torrelles, J. M. 2003, in IAU Symp 209, Planetary Nebulae. Their Evolution and Role in the Universe, eds. S. Kwok, M. Dopita, & R. Sutherland (San Francisco: ASP), in press
- Gómez et al. (1990) Gómez, Y., Moran, J. M., & Rodriguez, L. F. 1990, RevMexAA, 20, 55.
- Habing (1996) Habing, H. J. 1996, A&A Rev., 7, 97.
- Hasegawa et al. (2000) Hasegawa, T., Volk, K., & Kwok, S. 2000, ApJ, 532, 994
- Jura et al. (2000) Jura, M., Turner, J. L., Van Dyk, S., & Knapp, G. R. 2000, ApJ, 528, L105
- Kwok (1993) Kwok, S. 1993, ARA&A, 31, 63
- Lane et al. (1987) Lane, A. P., Johnston, K. J., Bowers, P. F., Spencer, J. H., & Diamond, P. J. 1987, ApJ, 323, 756
- Lewis (1989) Lewis, B. M. 1989, ApJ, 338, 234.
- Likkel & Morris (1988) Likkel, L., & Morris, M. 1988, ApJ, 329, 914.
- Marvel (1997) Marvel, K. B. 1997, PASP, 109, 1286.
- Marvel & Boboltz (1999) Marvel, K. B., & Boboltz, D. A. 1999, AJ, 118, 1791.
- Miranda et al. (2000) Miranda, L. F., Fernández, M., Alcalá, J. M., Guerrero, M. A., Anglada, G., Gómez, Y., Torrelles, J. M., & Aaquist, O. B. 2000, MNRAS, 311, 748
- Miranda et al. (2001) Miranda, L. F., Gómez, Y., Anglada, G., & Torrelles, J. M. 2001, Nature, 414, 284 (MGAT01)
- Miranda et al. (1998) Miranda, L. F., Torrelles, J. M., Guerrero, M. A., Aaquist, O. B., & Eiroa, C. 1998, MNRAS, 298, 243
- Nyman, Hall, & Olofsson (1998) Nyman, L.-A., Hall, P. J., & Olofsson, H. 1998, A&ASS, 127, 185
- Panagia (1973) Panagia, N. 1973, AJ, 78, 929
- Panagia & Felli (1975) Panagia, N., & Felli, M. 1975, A&A, 39,1
- Patriarchi & Perinotto (1993) Patriarchi, P., & Perinotto, M. 1993, A&ASS, 325, 335
- Reid & Moran (1981) Reid, M. J. & Moran, J. M. 1981, ARA&A, 19, 231
- Reynolds (1986) Reynolds, S. P. 1986, ApJ, 304, 713
- Sahai & Trauger (1998) Sahai, R., & Trauger, J. T. 1998, AJ, 116, 1357
- Sahai et al. (1999a) Sahai, R., Te Lintel Hekkert, P., Morris, M., Zijlstra, A., Likkel, L. 1999a, ApJ, 514, L115
- Sahai et al. (1999b) Sahai, R., Zijlstra, A., Bujarrabal, V., Te Lintel Hekkert, P. 1999b, AJ, 117, 1408
- Spencer et al. (1979) Spencer J.H., Johnston K.J., Moran J.M., Reid M.J., Walker R.C. 1979, ApJ, 230, 449
- Vassiliadis & Wood (1994) Vassiliadis, E., & Wood, P. R. 1994, ApJS, 92, 125
- Wright & Barlow (1975) Wright, A. E., & Barlow, M. J. 1975, MNRAS, 170, 41
- Yates & Cohen (1994) Yates J.A., Cohen R.J., 1994, MNRAS, 270, 958
- Zhang (1995) Zhang, C. Y., 1995, ApJS, 98, 659
- Zijlstra et al. (1989) Zijlstra, A. A. te Lintel Hekkert, P., Pottasch, S. R., Caswell, J. L., Ratag, M., & Habing, H. J. 1989, A&A, 217, 157


| Source | Right AscensionaaCoordinates of phase center in VLA observations, or pointing position of single-dish data. Units of right ascension are hours, minutes, and seconds. Units of declination are degrees, arcminutes, and arcseconds | DeclinationaaCoordinates of phase center in VLA observations, or pointing position of single-dish data. Units of right ascension are hours, minutes, and seconds. Units of declination are degrees, arcminutes, and arcseconds | bbVelocity of the strongest detected maser components. For non-detections, the central velocity of the observed bandwidth is given between parentheses | ccVelocity range covered by the observational bandwidth | ccVelocity range covered by the observational bandwidth | Flux densityddFor non-detections, upper limits are . For detections, uncertainties are | DoYeeObservation date, day of year in 2002 | Telescope |
|---|---|---|---|---|---|---|---|---|
| (J2000) | (J2000) | (km s-1) | (km s-1) | (km s-1) | (mJy) | (of 2002) | ||
| PK 130-10.1 (catalog ) | 01 42 19.90 | 51 34 37.0 | (-21.5) | -122.7 | +79.7 | 400 | 225 | Robledo |
| K 3-94 (catalog ) | 03 36 08.10 | 60 03 46.6 | (-71.0) | -111.5 | -30.5 | 11 | 125 | VLA |
| IC 2149 (catalog ) | 05 56 23.90 | 46 06 17.0 | (-23.6) | -76.2 | +28.9 | 900 | 114 | Medicina |
| (-38.0) | -78.5 | +2.5 | 11 | 125 | VLA | |||
| NGC 2440 (catalog ) | 07 41 55.40 | -18 12 31.0 | (+52.2) | 0.2 | +104.2 | 2200 | 275 | Medicina |
| (+39.6) | -13.3 | +92.6 | 1400 | 300 | Medicina | |||
| NGC 4361 (catalog ) | 12 24 30.90 | -18 47 05.0 | (+20.0) | -81.2 | +121.2 | 300 | 107 | Robledo |
| (+20.0) | -81.2 | +121.2 | 230 | 108 | Robledo | |||
| (+33.6) | -19.8 | +86.9 | 5000 | 178 | Medicina | |||
| (+27.0) | -20.1 | +74.2 | 1200 | 276 | Medicina | |||
| (+19.6) | -34.0 | +73.1 | 1400 | 300 | Medicina | |||
| M 2-9 (catalog ) | 17 05 37.80 | -10 08 32.0 | (+101.4) | +47.8 | +154.9 | 1400 | 81 | Medicina |
| (+87.9) | +34.9 | +140.9 | 1300 | 301 | Medicina | |||
| IRAS 17106-3046 (catalog ) | 17 13 51.70 | -30 49 40.0 | (0.0) | -101.2 | +101.2 | 1000 | 218 | Robledo |
| NGC 6309 (catalog ) | 17 14 03.60 | -12 54 37.0 | (-33.8) | -87.6 | +20.0 | 1700 | 109 | Medicina |
| (-34.0) | -87.4 | +19.4 | 11000 | 179 | Medicina | |||
| (-40.0) | -86.9 | +7.0 | 1100 | 276 | Medicina | |||
| (-47.1) | -100.9 | + 6.7 | 1400 | 301 | Medicina | |||
| IRAS 17207-2856 (catalog ) | 17 23 55.80 | -28 59 32.0 | (-18.0) | -119.2 | +83.2 | 1000 | 218 | Robledo |
| IRAS 17347-3139 (catalog ) | 17 38 00.70 | -31 40 54.0 | -62.10.5 | -226.2 | +81.2 | 2100300 | 131 | Robledo |
| -68.00.5 | 2100300 | 131 | Robledo | |||||
| -68.10.5 | -168.2 | +34.2 | 700400 | 140 | Robledo | |||
| -61.81.3 | -95.7 | -54.3 | 136060 | 189 | VLA | |||
| -68.20.5 | -166.2 | +36.2 | 1700600 | 218 | Robledo | |||
| IRAS 17375-3000 (catalog ) | 17 40 44.80 | -30 02 00.0 | (-25.0) | -126.2 | +76.2 | 1200 | 218 | Robledo |
| IRAS 17423-1755 (catalog ) | 17 45 14.20 | -17 56 47.0 | (+35.0) | -66.2 | +136.2 | 190 | 108 | Robledo |
| (+35.0) | -66.2 | +136.2 | 800 | 218 | Robledo | |||
| NGC 6572 (catalog ) | 18 12 06.28 | 06 51 12.6 | (-10.0) | -111.2 | +91.2 | 110 | 110 | Robledo |
| (-10.0) | -50.5 | +30.5 | 12 | 125 | VLA | |||
| Cn 3-1 (catalog ) | 18 17 34.09 | 10 09 03.4 | (+38.0) | -63.2 | 139.2 | 140 | 110 | Robledo |
| (+38.0) | -2.5 | +78.5 | 13 | 125 | VLA | |||
| M 3-27 (catalog ) | 18 27 48.27 | 14 29 06.2 | (-24.0) | -64.5 | +16.5 | 13 | 125 | VLA |
| M 2-43 (catalog ) | 18 26 40.10 | -02 42 57.0 | (0.0) | -101.2 | +101.2 | 140 | 108 | Robledo |
| (0.0) | -101.2 | +101.2 | 300 | 167 | Robledo | |||
| (+11.8) | -40.9 | +64.4 | 1200 | 274 | Medicina | |||
| M 1-57 (catalog ) | 18 40 20.30 | -10 39 47.0 | (+92.0) | -9.2 | 193.2 | 110 | 108 | Robledo |
| (+92.0) | -9.2 | 193.2 | 130 | 131 | Robledo | |||
| Hu 2-1 (catalog ) | 18 49 47.56 | 20 50 39.4 | (+46.8) | -6.5 | +100.0 | 900 | 81 | Medicina |
| (+33.0) | -7.5 | +73.5 | 13 | 125 | VLA | |||
| IC 4846 (catalog ) | 19 16 28.23 | -09 02 36.6 | (-168.0) | -269.2 | -66.8 | 100 | 108 | Robledo |
| (-168.0) | -269.2 | -66.8 | 130 | 131 | Robledo | |||
| (-156.2) | -208.8 | -103.5 | 1700 | 274 | Medicina | |||
| Vy 2-2 (catalog ) | 19 24 22.20 | 09 53 56.0 | (-64.0) | -104.5 | -23.5 | 14 | 125 | VLA |
| K 3-35 (catalog ) | 19 27 44.02 | 21 30 03.4 | 22.40.5 | -76.2 | +126.2 | 27050 | 108 | Robledo |
| 22.61.3 | -20.5 | +60.5 | 9335 | 125 | VLA | |||
| 22.40.5 | -76.2 | +126.2 | 133090 | 131 | Robledo | |||
| 22.40.5 | -76.2 | +126.2 | 1410130 | 140 | Robledo | |||
| 22.40.5 | -76.2 | +126.2 | 1330120 | 246 | Robledo | |||
| 22.40.5 | -76.2 | +126.2 | 2100400 | 284 | Robledo | |||
| M 2-48 (catalog ) | 19 50 28.00 | 25 54 28.0 | (0.0) | -40.5 | +40.5 | 13 | 125 | VLA |
| NGC 6884 (catalog ) | 20 10 23.59 | 46 27 39.4 | (-21.0) | -61.5 | +19.5 | 12 | 125 | VLA |
| NGC 6881 (catalog ) | 20 10 52.40 | 37 24 42.0 | (-14.0) | -115.2 | +87.2 | 150 | 110 | Robledo |
| ( 14.0) | -54.5 | +26.5 | 13 | 125 | VLA | |||
| IC 4997 (catalog ) | 20 20 08.80 | 16 43 53.0 | (-66.0) | -106.5 | -25.5 | 15 | 125 | VLA |
| IC 5117 (catalog ) | 21 32 30.90 | 44 35 47.0 | (0.0) | -101.2 | +101.2 | 200 | 131 | Robledo |
| (0.0) | -40.5 | +40.5 | 12 | 125 | VLA | |||
| KjPn 8 (catalog ) | 23 24 10.45 | 60 57 30.5 | (-21.8) | -75.4 | +31.8 | 1000 | 109 | Medicina |
| (-35.0) | -75.5 | +5.5 | 12 | 125 | VLA |
| Source | Phase calibrator | Flux densitybbBootstrapped flux density of the phase calibrator | Beam sizeccSize and position angle of the synthesized beams of the images | Beam P.A.ccSize and position angle of the synthesized beams of the images |
|---|---|---|---|---|
| (Jy) | ||||
| K 3-94 | J0244+624 | 1.230.05 | 36 | |
| IC 2149 | J0555+398 | 2.620.12 | 57 | |
| IRAS 17347-3139 | J1745290 | 0.9860.008 | 26 | |
| NGC 6572 | J1849+005 | 0.7230.003 | 45 | |
| Cn 3-1 | J1849+005 | 0.7230.003 | 48 | |
| M 3-27 | J1849+005 | 0.7230.003 | 53 | |
| Hu 2-1 | J1925+211 | 2.9790.130 | 56 | |
| Vy 2-2 | J1950+081 | 0.3340.014 | 48 | |
| K 3-35 | J1925+211 | 2.9790.130 | 52 | |
| M 2-48 | J2023+318 | 0.6340.025 | 59 | |
| NGC 6884 | J2012+464 | 0.4850.018 | -85 | |
| NGC 6881 | J2015+371 | 3.560.11 | 73 | |
| IC 4997 | J2031+123 | 0.5290.017 | 56 | |
| IC 5117 | J2202+422 | 2.330.08 | 90 | |
| KjPn 8 | J2322+509 | 0.6790.020 | -45 |
| Frequency | Flux densityaaUncertainties are |
|---|---|
| (GHz) | (mJy) |
| 4.86 | 61.671.2 |
| 8.44 | 93.91.8 |
| 14.94 | 1454 |
| 22.29 | 9714 |
| Source | aaVelocity of water maser emission | Flux densitybbUncertainties are | Right Ascension | Declination | Position uncertaintyb,cb,cfootnotemark: |
|---|---|---|---|---|---|
| (km s-1) | (mJy) | (J2000) | (J2000) | () | |
| IRAS 17347-3139 | -61.2 | 44050 | 17 38 00.589 | -31 40 55.66 | 0.04 |
| -61.8 | 131060 | 17 38 00.5903 | -31 40 55.632 | 0.017 | |
| -62.5 | 136060 | 17 38 00.5907 | -31 40 55.628 | ddReference feature. Absolute position error is | |
| -63.1 | 72050 | 17 38 00.594 | -31 40 55.62 | 0.03 | |
| -63.8 | 54050 | 17 38 00.598 | -31 40 55.60 | 0.04 | |
| -64.5 | 41050 | 17 38 00.601 | -31 40 55.58 | 0.05 | |
| -65.1 | 26050 | 17 38 00.603 | -31 40 55.57 | 0.07 | |
| -65.8 | 18050 | 17 38 00.597 | -31 40 55.62 | 0.10 | |
| -66.4 | 15050 | 17 38 00.589 | -31 40 55.71 | 0.13 | |
| -67.1 | 33050 | 17 38 00.603 | -31 40 55.64 | 0.06 | |
| -67.8 | 102050 | 17 38 00.6052 | -31 40 55.615 | 0.021 | |
| -68.4 | 94050 | 17 38 00.6041 | -31 40 55.626 | 0.022 | |
| -69.1 | 22050 | 17 38 00.597 | -31 40 55.73 | 0.09 | |
| K 3-35 | 23.9 | 3516 | 19 27 44.02296 | 21 30 03.4404 | 0.0012 |
| 22.6 | 9335 | 19 27 44.02308 | 21 30 03.4412 | eeReference feature. Absolute position error is | |
| 21.3 | 7146 | 19 27 44.02322 | 21 30 03.4422 | 0.0006 | |
| 20.0 | 1256 | 19 27 44.0234 | 21 30 03.444 | 0.004 |