Direct measurement of the size and shape of the present-day stellar wind of Carinae††thanks: Based on observations obtained at the European Southern Observatory
We present new high angular resolution observations at near-IR wavelengths of the core of the Luminous Blue Variable Carinae, using NAOS-CONICA at the VLT and VINCI at the VLT Interferometer (VLTI). The latter observations provide spatial information on a scale of 5 milli-arcsec or 11 AU at the distance of Carinae. The present-day stellar wind of Carinae is resolved on a scale of several stellar radii. Assuming spherical symmetry, we find a mass loss rate of 1.610-3 M⊙/yr and a wind clumping factor of 0.26. The VLTI data taken at a baseline of 24 meter show that the object is elongated with a de-projected axis ratio of approximately 1.5; the major axis is aligned with that of the large bi-polar nebula that was ejected in the 19th century. The most likely explanation for this observation is a counter-intuitive model in which stellar rotation near the critical velocity causes enhanced mass loss along the rotation axis. This results from the large temperature difference between pole and equator in rapidly rotating stars. Carinae must rotate in excess of 90 per cent of its critical velocity to account for the observed shape. The large outburst may have been shaped in a similar way. Our observations provide strong support for the existence of a theoretically predicted rotational instability, known as the limit.
Key Words.:
Stars: circumstellar matter: stellar winds: mass loss, stars: individual: Carinaevboekel@science.uva.nl
1 Introduction
The Luminous Blue Variable Carinae is the most luminous star known in the galaxy (Davidson & Humphreys 1997). Its extreme properties make it an interesting laboratory to study the physics of the most massive stars in galaxies. Not much is known about the life of such stars, including their birth and post-main-sequence evolution. Carinae has already left the main sequence and is now in an unstable phase; it experienced a large outburst in the 19th century which created the beautiful bi-polar nebula seen in many images (referred to as the homunculus). As much as 10 M⊙ may have been ejected during that event (Smith et al. 2003b). A smaller outburst seems to have occurred around 1890, creating a smaller, but similarly shaped nebula hidden inside the larger one (Ishibashi et al. 2003).
The origin of the highly bi-polar shape of the homunculus is a matter of debate. Model calculations show that a spherical explosion into a massive equatorial torus can explain the observed geometry (Frank et al. 1995). Indeed, evidence for the presence of a 15 M⊙ torus was found from ISO spectroscopy (Morris et al. 1999). Note however, that Smith et al. (2003b) argue that most of this mass is actually located in the lobes. Other models reproduce the shape of the nebula by assuming a non-spherical outburst that runs into a spherical envelope. Recently, several authors proposed that luminous stars rotating close to their critical speed have stellar winds with a higher wind density and expansion velocity at the poles (Owocki et al. 1996, Maeder & Desjacques 2001, Dwarkadas & Owocki 2002). Therefore, the shape of the homunculus may be a natural consequence of the combined effects of rapid rotation and the high luminosity of Carinae. Note that the extreme luminosity of Carinae implies that even a modest amount of rotation causes the star to be close to its critical velocity (Langer 1997). Evidence in support of a polar enhanced wind was recently inferred from Hubble Space Telescope (HST) spectroscopy of starlight scattered off dust grains in the homunculus (Smith et al. 2003a).
In this Letter we present the first results of an extensive high angular resolution near-IR study of the core of the homunculus, revealing for the first time the shape of the present-day stellar wind on a scale of 5 milli-arcsec.
2 Observations
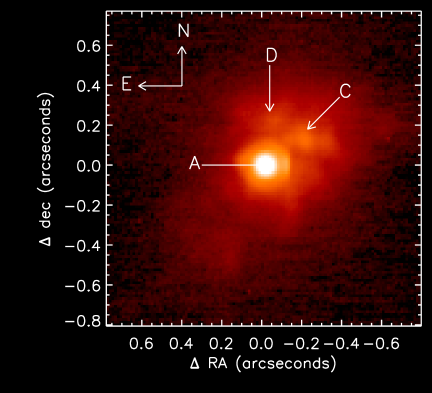
We have observed Carinae with the adaptive optics camera NAOS-CONICA (Lenzen et al. 1998, Rousset et al. 2000) attached to Yepun, one of the 8.2 meter Unit Telescopes of the Very Large Telescope (VLT) of the European Southern Observatory (ESO), located at Cerro Paranal, Chile. NAOS was in the visual wavefront sensor configuration with 14 14 subapertures used for wavefront sensing. CONICA was used with the S13 camera (13.25 milli-arcsec/pixel) and the NB_239 intermediate band filter with a central wavelength of 2.39 m and a width of 60 nm. We employed a neutral density filter with an attenuation factor of 70 at the observing wavelength in order to avoid saturating the central peak of the point spread function. Individual exposures were 0.16 s long, and 20 exposures were co-added, resulting in a total exposure time of 3.6 s per frame. Four such frames were obtained. The reduced image, diffraction limited at 70 milli-arcsec, is shown in figure 1.
The central 1.5 arcsecond region of the nebula is dominated by a point source and shows a complex morphology of blobs in the immediate vicinity. The brightest blobs were previously discovered using speckle imaging techniques (Weigelt & Ebersberger 1986, Hofmann & Weigelt 1988). There is a clear asymmetry in the emission, which is brightest in the north-west. Approximately 57 per cent of the flux seen inside a region with a diameter of 1.4 arcsec, centered on the core of the nebula and corresponding to the Airy disk of the siderostats, is concentrated in the unresolved point source. We use recent literature data (Smith & Gehrz 2000) to flux calibrate our observations and find that the unresolved central source has a flux of about 200 Jy.
We used the two 35 cm test telescopes of the VLT Interferometer (Glindemann et al. 2003) and the test instrument VINCI (Kervella et al. 2000) to obtain interferometric measurements at baselines ranging from 8 to 62 meters in length. The observations were carried out in the first half of 2002 in four different nights, and again in early 2003. For a full description of the observations, and analysis of the data we refer to Schöller et al. (submitted to A&A). The baselines used, have a ground length of 8, 16, 24, and 66 m respectively. In particular observations with the 24 m baseline cover a wide range of projected baseline orientations.
In figure 2 we show the VINCI observations, given as squared visibility points. The visibility curves were corrected for the emission in the siderostat beams on scales larger than 70 milli-arcsec, by adding the resolved component seen in our NAOS-CONICA images. This results in a reduction of the visibilities by a factor (1-fres), where fres is the fraction of the total flux in the siderostat beams that does not come from the central source (0.43). For each baseline, the top panel of figure 2 shows the average visibilities at that baseline, while the bottom panel shows the variations of visibility with projected baseline orientation for the 24m baseline.
3 Analysis
3.1 Nature of the emission
Figure 2 shows that the visibility decreases with increasing baseline, indicating that the interferometer is resolving the central source. The near-IR emission seen in the central region of Carinae must come from an object that emits half of its flux in an area of 5 milli-arcsec or 11 AU diameter, assuming circular symmetry and adopting a distance of 2300 parsec (Davidson & Humphreys 1997). Using the measured size and flux of 200 Jy (Smith & Gehrz 2000), a lower limit to the temperature of the object can be derived, assuming that at a wavelength of 2.2 m there is no extinction. We find a minimum temperature of 2300 K. Allowing for a foreground extinction of one (two) magnitudes (Hillier et al. 2001), this temperature goes up to 3200 (5000) K. The minimum temperature is too high to be caused by thermal emission from dust. We conclude that we have spatially resolved the ionized stellar wind.
3.2 Mass loss rate
We constructed a simple physical model for the observed size and flux of Carinae, assuming that it is due to a spherical star with a dense, ionized and isothermal stellar wind that reaches a terminal flow velocity of 500 km/s (Hillier et al. 2001). The wind is further assumed to be clumpy, with the clumping factor defined as and where is the unclumped wind density. For a more detailed description of the model assumptions, we refer to de Koter et al. (in preparation).
A range of mass loss rates and clumping factors are consistent with the data. When combined with optical spectra of the central star taken with the HST (Hillier et al. 2001), a unique determination of the mass loss rate and the wind clumping factor is possible. The HST spectrum can be fitted using a non-local thermodynamic equilibrium (non-LTE) model for the star and wind (Hillier et al. 2001) which is degenerate in the ratio , where is the wind clumping factor as defined above. A good fit to the HST observations is obtained for a ratio = 0.00316 M⊙/yr. We finally arrive at a mass loss rate of 1.60.310-3 Myr and a wind clumping factor = 0.26 (figures 2 and 3). The spatial light distribution of the non-LTE model yields a somewhat better fit to the data than the LTE model.

3.3 Asymmetry of the emission
The 24 m baseline (figure 2) data show a variation of visibility with projected baseline orientation, which is inconsistent with a spherical distribution of light at 2.2 m. Deviations from spherical symmetry will introduce additional uncertainty in the derivation of the mass loss rate given above. To determine the axis ratio of the emission, a gaussian shape was fit to the observations at each projected baseline orientation. Note that the actual light distribution is not gaussian. Therefore, the typical size of 7 milli-arcsec derived from the gaussian fits differs from the 5 milli-arcsec derived from our (spherical) physical model. We find a major to minor axis ratio of 1.25 0.05, and a position angle of 134 7 degrees. This position angle is within errors equal to the position angle of 132 degrees (Davidson et al. 2001) found for the homunculus. We therefore have conclusive evidence that the density contours in Carinae’s wind are elongated along the major axis of the Homunculus. The chance that the two prolate structures - i.e. the core and the Homunculus - have different orientation in 3 dimensions but still show the observed alignment when projected on the plane of the sky is about 10 percent, given the uncertainties in our measurements. The core on a scale of 101 AU, and the Homunculus reaching out several times 104 AU, must be truly aligned in space. Adopting an angle between the major axis of the Homunculus and the line of sight of 41 degrees (Davidson et al. 2001), the observed aspect ratio of major over minor axis of 1.25 implies a de-projected aspect ratio of roughly 1.5 (in detail this de-projection depends on the actual three dimensional structure of the object).

4 Discussion
It has been thought (e.g. Lamers & Pauldrach 1991, Poe & Friend 1986) that stellar rotation enhances mass loss in the equatorial regions, resulting in disk-like winds. However, this would imply that Carinae’s rotation axis is perpendicular to the major axis of the bi-polar homunculus, which is unlikely. A recent model (Owocki et al. 1996, Dwarkadas & Owocki 2002) for line-driven winds from luminous hot stars rotating near their critical speed predicts a higher wind speed and density along the poles than in the equator. This counter-intuitive effect is caused by the increased polar temperature (von Zeipel 1924) and associated radiation pressure. Our data clearly favour the polar wind model. The VLT data do not provide information about the velocity field. However, recent HST spectroscopy (Smith et al. 2003a) of starlight reflected by dust in the Homunculus indicates a latitude-dependent wind outflow velocity, with the highest velocities near the pole; this is expected for a wind which is stronger at the poles. These data also suggest a polar enhanced wind density. Applying the model of Dwarkadas & Owocki (2002, see also Maeder & Desjacques 2001), we find that Carinae must rotate at about 90 per cent of its critical velocity to account for the observed shape.
The question arises whether the model assumptions (line-driven wind, radiative envelope) made by e.g. Dwarkadas & Owocki (2002) are applicable to Carinae. We note that Carinae is almost certainly fully convective (Langer 1997), due to its near-Eddington luminosity (defined as the luminosity where surface gravity is compensated by radiation pressure). Therefore the difference between polar and equatorial temperatures in Carinae will likely be smaller (Lucy 1967) than in polar wind models, that adopt radiative envelopes. For such a convective envelope to produce a substantial temperature contrast, Carinae must rotate in excess of 0.9 of the critical speed. The observed mass loss rate of 1.610-3 M⊙/yr can be explained in terms of radiation driven wind theory (C. Aerts, private communication).
The alignment of the homunculus and the present-day wind suggests a common physical cause. Rotation may then also be responsible for the shape of the homunculus (Dwarkadas & Owocki 2002). An outburst in 1890 probably produced a bipolar nebula with a present-day size of 2 arcsec (Ishibashi et al. 2003), which is aligned with, and inside the larger homunculus. There is thus strong evidence that the wind geometry is similar over a wide range of mass loss rates. It is not likely however that line-driven wind models are applicable to the outbursts. Nevertheless, our data underpin the importance of rotation for the post-main-sequence evolution of very massive stars such as Carinae; it seems inevitable that as the star evolves, it will run into a rotational instability, referred to as the limit (Langer et al. 1999).
Acknowledgements.
We would like to thank C. Aerts, P. Morris and N. Langer for useful discussions. DJH acknowledges partial support from NASA grant NAGW 3838.References
- Davidson & Humphreys (1997) Davidson, K. & Humphreys, R. M. 1997, ARA&A, 35, 1
- Davidson et al. (2001) Davidson, K., Smith, N., Gull, T. R., Ishibashi, K., & Hillier, D. J. 2001, AJ, 121, 1569
- Dwarkadas & Owocki (2002) Dwarkadas, V. V. & Owocki, S. P. 2002, ApJ, 581, 1337
- Frank et al. (1995) Frank, A., Balick, B., & Davidson, K. 1995, ApJ, 441, L77
- Glindemann et al. (2003) Glindemann, A., Algomedo, J., Amestica, R., et al. 2003, in Interferometry for Optical Astronomy II. Edited by Wesley A. Traub. Proceedings of the SPIE, Volume 4838, pp. 89-100 (2003)., 89–100
- Hillier et al. (2001) Hillier, D. J., Davidson, K., Ishibashi, K., & Gull, T. 2001, ApJ, 553, 837
- Hofmann & Weigelt (1988) Hofmann, K.-H. & Weigelt, G. 1988, A&A, 203, L21+
- Ishibashi et al. (2003) Ishibashi, K., Gull, T. R., Davidson, K., et al. 2003, AJ, 125, 3222
- Kervella et al. (2000) Kervella, P., Coude du Foresto, V., Glindemann, A., & Hofmann, R. 2000, in Proc. SPIE Vol. 4006, p. 31-42, Interferometry in Optical Astronomy, Pierre J. Lena; Andreas Quirrenbach; Eds., 31–42
- Lamers & Pauldrach (1991) Lamers, H. J. G. & Pauldrach, A. W. A. 1991, A&A, 244, L5
- Langer (1997) Langer, N. 1997, in ASP Conf. Ser. 120: Luminous Blue Variables: Massive Stars in Transition, 83–+
- Langer et al. (1999) Langer, N., García-Segura, G., & Mac Low, M. 1999, ApJ, 520, L49
- Lenzen et al. (1998) Lenzen, R., Hofmann, R., Bizenberger, P., & Tusche, A. 1998, in Proc. SPIE Vol. 3354, p. 606-614, Infrared Astronomical Instrumentation, Albert M. Fowler; Ed., 606–614
- Lucy (1967) Lucy, L. B. 1967, Zeitschrift fur Astrophysics, 65, 89
- Maeder & Desjacques (2001) Maeder, A. & Desjacques, V. 2001, A&A, 372, L9
- Morris et al. (1999) Morris, P. W., Waters, L. B. F. M., Barlow, M. J., et al. 1999, Nature, 402, 502
- Owocki et al. (1996) Owocki, S. P., Cranmer, S. R., & Gayley, K. G. 1996, ApJ, 472, L115+
- Poe & Friend (1986) Poe, C. H. & Friend, D. B. 1986, ApJ, 311, 317
- Rousset et al. (2000) Rousset, G., Lacombe, F., Puget, P., et al. 2000, in Proc. SPIE Vol. 4007, p. 72-81, Adaptive Optical Systems Technology, Peter L. Wizinowich; Ed., 72–81
- Smith et al. (2003a) Smith, N., Davidson, K., Gull, T. R., Ishibashi, K., & Hillier, D. J. 2003a, ApJ, 586, 432
- Smith & Gehrz (2000) Smith, N. & Gehrz, R. D. 2000, ApJ, 529, L99
- Smith et al. (2003b) Smith, N., Gehrz, R. D., Hinz, P. M., et al. 2003b, AJ, 125, 1458
- von Zeipel (1924) von Zeipel, H. 1924, MNRAS, 84, 665
- Weigelt & Ebersberger (1986) Weigelt, G. & Ebersberger, J. 1986, A&A, 163, L5