Very Large Array Observations of Winds from Massive Stars
El modelo estándar para la emisión libre-libre de vientos ionizados se basa en la suposición de un viento estacionario, isotrópico y homogéneo. Sin embargo, durante la última década estas suposiciones han sido cuestionadas. Existen objetos cuyo viento no se comporta como lo predice el modelo estándar. En este trabajo presentamos resultados para tres fuentes brillantes: P Cyg, Cyg OB2 No. 12 y WR 147. Se ha reportado que estos objetos poseen vientos que se desvían de lo esperado. Reportamos el flujo observado y derivamos el tamaño, el índice espectral y la tasa de pérdida de masa para cada uno de ellos. Estos parámetros nos permiten detectar la presencia de posibles asimetrías, inhomogeneidades y variaciones en la densidad de flujo. Estas desviaciones confirman un comportamiento distinto al clásico en estos vientos.
Abstract
The classical model for free-free emission from ionized stellar winds is based on the assumption of a stationary, isotropic and homogeneous wind. However, since there exist objects whose wind behaviour deviates from the standard model, during the last decade these assumptions have been questioned. In this work, we present results for 3 bright sources: P Cyg, Cyg OB2 No. 12 and WR 147. These objects have been reported to possess winds that deviate from the basic assumptions. We have obtained flux densities, sizes, spectral indices and mass loss rates for each of the targets. These parameters allow us to analyze possible asymmetries, inhomogeneities and time variations in the flux densities. These features confirm the nonclassical behaviour of these winds.
keywords:
STARS: INDIVIDUAL (WR147, P Cygni, Cygnus OB2 No. 12) – STARS: MASS LOSS0.1 Introduction
Since winds from massive stars are ionized by the ultraviolet radiation from the underlying star, they can be studied observationally at radio wavelengths through their free-free emission. Until recently, massive star winds were treated as isotropic and homogeneous flows with constant velocity and known electron temperature, degree of ionization and chemical composition. In this way, based on the classic work of Panagia & Felli (1975) and Wright & Barlow (1975), it was possible to obtain a value for the mass loss rate from radio observations. However, since the work of Abbott, Bieging & Churchwell (1981), who found that in some cases these assumptions are not valid, various authors have found firm evidence for deviations from these basic assumptions.
| Source | (PA) | (PA) | (PA) | |||
|---|---|---|---|---|---|---|
| [arcsec][deg] | [arcsec][deg] | [arcsec][deg] | [mJy] | [mJy] | [mJy] | |
| P Cyg | (42) | (160) | (29) | 9.7 | 8.0 | 6.0 |
| Cyg OB2 No. 12 | (32) | (103) | (176) | 9.0 | 5.9 | 4.2 |
| WR 147 S | 0.06 0.05(22) | 0.25 0.21(120) | 0.46 0.35(163) | 36.6 | 24.5 | 22.1 |
| WR 147 N | 0.37 0.30(110) | 0.49 0.21(93) | 9.3 | 10.8 |
Note. Deconvolved size errors are .
The existence of possible inhomogeneities has been studied, both observationally and theoretically. Radio observations seem to detect (marginally) blobs of material moving with the wind (Skinner et al. 1998; Contreras & Rodríguez 1999; Exter et al. 2002). In the optical region, peaks superposed on emission lines are suggested to represent individual blobs (Moffat & Robert 1994). Theoretically, Cherepashchuck (1990) studied the discrepancy between the expected and the observed X-ray luminosity. He concluded that a model including inhomogeneities can explain this discrepancy and suggests that as much as 80% of the mass of the wind could be in the form of blobs. In fact, Williams et al. (1997) reported firm evidence of an asymmetric wind in WR 147, making the WR star of this binary system a very good example of a non-classical wind source.
Variable radio emission has been detected from several massive stars including P Cyg (Abbott, Bieging & Churchwell 1981; Contreras et al. 1996; Williams et al. 1997). This variability suggests that we are not dealing with a stationary wind. It has been proposed that these variations are due to a changing mass loss rate. However, the variability in the observed optical emission lines can be explained by the presence of an asymmetric stellar wind in rotation. In the case of a binary system, where there is an interaction surface between the two stellar winds, the variability can be due to the orbital sweeping of this interaction surface even in the absence of intrinsic variability of the stellar winds (Girard & Willson 1987; Luehrs 1997; Georgiev & Koenigsberger 2002).
The study of the main assumptions of the classical wind model is very important because mass loss rate values are usually derived assuming a classical thermal wind. Thus, in order to determine reliable mass loss rates, we should take into account possible deviations (hacer algo en cada fuente). In this paper, we present new VLA observations at 0.7, 3.5 and 6 cm of three bright radio sources: P Cyg, Cyg OB2 No. 12 and WR 147.
0.2 Observations

We present two sets of observations taken with the Very Large Array (VLA) of the NRAO111The National Radio Astronomy Observatory is operated by Associated Universities Inc. under cooperative agreement with the National Science Foundation on 1999 June 28 and September 3 at 0.7, 3.6 and 6-cm. During both epochs the array was in the “A” configuration giving angular resolutions of , and for each wavelength, respectively. During the first observing run all three sources were observed, while during the second only WR 147 was observed. The total on-source integration time was 1 hour for each source for the first run and 1.5 hours for the second. Amplitude calibrators were 1328+307 and 0137+331 and phase calibrators were 2005+403 and 2015+371 on each observing run. For the first season, the observed bootstrapped flux densities for 2005+403 were: 1.18, 2.01 and 2.54 mJy at 0.7, 3.6 and 6 cm respectively and for 2015+371: 1.35 at 6 cm. For the second run only 2005+403 was observed and a flux density of 1.99 at 3.6 cm was obtained.
Data reduction was performed using the Astronomical Image Processing System (AIPS) software of the NRAO. At 3.5 and 6 cm we have followed standard VLA procedures for editing, calibrating and imaging. At 0.7 cm, we have applied a small correction to the data for atmospheric extinction using a zenithal optical depth of = 0.1. In this way, we presume to have minimized the expected tropospheric opacity dependence of the aperture efficiency.
CLEANed maps were obtained using different data weighting schemes according to the source. For P Cyg and Cyg OB2 No. 12, an intermediate weight between Natural and Uniform was used (ROBUST=0, Figures 1 and 2). While for WR 147, pure uniform weighting was preferred (Figure 3). In order to obtain flux densities and source sizes, we have used the AIPS IMFIT procedure. Based on a 2D-Gaussian fit to the source, we have determined integrated flux densities (Table 1) and deconvolved sizes (Table 2) for all sources. Distances and wind terminal velocity values were taken from the literature (Contreras et al. 1996); these data, together with the relation derived by Panagia & Felli (1975) and Wright & Barlow (1975), allowed us to derived mass-loss rates for each object (Table 2). Our values are not corrected for the effects of possible asymmetries or inhomogeneities, but they are expected to be correct to an order of magnitude.

| Source | |||
|---|---|---|---|
| [10] | |||
| P Cyg | 0.12 | 0.50 | 0.50.2 |
| Cyg OB2 No. 12 | 0.26 | 0.63 | 2.71.0 |
| WR 147 S | 0.25 | 0.18 | 1.00.4 |
| WR 147 N | -0.25 |
0.3 Results
0.3.1 P Cyg
This B1 Ia star has been studied in the radio since the early 1980’s when Abbott, Bieging & Churchwell (1981) reported for the first time variable radio emission. Radio emission variations are as large as 50% without considerable changes in the spectral indices (Contreras et al. 1996). Several explanations related to wind parameters (ionization degree, wind velocity, mass-loss rate) have been proposed, but none of them seems to fit the observed behaviour. In this work we have determined flux densities at 0.7, 3.6 and 6 cm, based on our 2D Gaussian fits. Comparing these new flux densities with previous ones, we found that they have decreased by 70%, 35% and 34%, respectively, from their 1995 values (Contreras et al. 1996). This kind of behaviour has been observed by Skinner et al. (1998) in their long-term deep radio study. They found that P Cyg shows important changes in its flux density where variations of 20-50% are frequently observed.
Regarding spectral indices, Skinner et al. (1998) found two different values corresponding to two distinct regions around P Cyg: the inner region (about in radius) presents a spectral index of 0.8 while the outer region of the nebula shows a spectral index close to zero. In our case the spectral index behaviour seems to be the opposite: the 0.7-3.6 cm spectral index, coming from a region closer to the star, is almost flat (Table 2) while the 3.6-6 cm spectral index, coming from regions farther out from the star, is consistent with the 0.6 value for a thermal wind. The 0.7-3.6 cm spectral index has been altered by the decrease of the 0.7 cm flux density. As Skinner et al. (1998) proposed, since different wavelengths sample different regions in the wind, each one with a completely different time-scale variation, one can expect that flux density changes may be poorly correlated or entirely uncorrelated. Then, we are observing a rapid change in the wind emission at 0.7 cm ocurring in the inner region but not observed in the outer regions of the wind. Wind variability has been observed at other wavelengths. Recently, long-term optical photometric studies by van Genderen, Sterken & De Groot (2002) and de Jager (2000) have described various types of stellar oscillations that P Cyg undergoes which could be related to changes in the wind parameters. Thus, in light of these new studies, it would be useful to examine again the proposed explanations mentioned above.
Regarding morphology, we present 0.7, 3.6 and 6 cm maps shown in Figure 1. From these maps, P Cyg seems to have a non-isotropic wind at all three wavelengths being more obviously elongated at 0.7 cm where its major/minor axis ratio is 2 (Table 2). The observed wind asymmetry is consistent with the results of Skinner et al. (1998), who found a slightly asymmetric structure surrounding the compact stellar wind source. Moreover, they found that the nebula around P Cyg is very inhomogeneous or filamentary at various scales: a compact core of a few tenths of an arcsec in diameter, an inner nebula of in diameter and an outer nebula extending to . Although, in our 0.7 and 6 cm maps we can hardly see what could be emission from a blob denser than the surrounding wind, evidence of a blob is more obvious in our 3.6 cm map. Here we can see emission at a -level of a small condensation to the NE of P Cyg. This inhomogeneity is about away from the central star which indicates that at an intermediate scale between the central core and the inner nebula (as defined by Skinner et al.) the wind is also inhomogeneous.
The derived mass-loss rate for P Cyg, while somewhat lower than that reported by Contreras et al. (1996), is still consistent within the error, and consistent with the value of M⊙ yr-1 reported in the literature (Skinner et al. 1998). Since our two values were obtained using the 0.7 cm flux density, to avoid possible non-thermal emission contamination (which showed a very important decrease in 1999), it is not surprising that the 1999 mass-loss rate is lower than the previous one. P Cyg’s wind and associated nebula, require more detailed study because the radio variability has yet to be explained.
0.3.2 Cyg OB2 No. 12
Although no variable radio emission has been reported for this source, our new VLA observations show some variation in its 0.7, 3.6 and 6 cm flux densities. Both, 0.7 and 3.6 cm fluxes have decreased by 60% and 18%, respectively, while its 6 cm flux has increased by 12%. Our flux densities were obtained from a 2D Gaussian fit to the source. These fluxes are shown in Table 1. The flux variations have caused the spectral indices to change as well. The 3.6-6 cm index has decreased from those reported by Contreras et al. (1996), becoming more consistent with the classical value for a thermal wind of 0.6, while the 0.7-3.6 cm index has decreased to a rather flat value of 0.30.1.
Maps at the three observing wavelengths are shown in Figures 1 and 2. Based on its morphology, Cyg OB2 No. 12 does not show any deviation from a spherical wind at 0.7 and 3.6 cm (Figures 1 and 2), however, at 6 cm its shape is obviously elongated (Figure 1). From a 2D Gaussian fit, we have obtained its angular size at all three wavelengths; it is clear that at 6 cm, the source has a major to minor axis ratio of 2 (Table 1). The contour map shows that the 6 cm emission does not have a smooth oval shape but rather shows a kind of enhaced emission region to the south. Furthermore, if the source had an asymmetric wind, its shape would be elongated at all wavelengths, which is not the case. Since free-free emission depends on density as , we propose that this protuberance could be explained as a blob denser than its surroundings. Thus, the wind of Cyg OB2 No. 12 deviates from the standard assumption of a homogeneous wind.
0.3.3 WR 147
This very interesting system is now considered the archetype of colliding wind binaries. It clearly shows the presence of a wind interaction region curving away from the Wolf-Rayet(WR) star, and emitting non-thermal radiation (north radio component). Its southern radio component (WR star) shows time-variable radio emission as well as inhomogeneities (Contreras & Rodríguez 1999; Watson et al. 2002). In this work, we present new maps obtained from our 0.7, 3.6 and 6 cm data (Figures 2 and 3). In these maps we can see both components and some of their fine structure.
Flux density variability has been reported for both radio components (Williams et al. 1997; Setia Gunawan et al. 2001). Although Setia Gunawan et al. (2001) find variability at 6 and 21 cm for the north component of the system, from our new values (Table 1), we cannot see any significant variation in the 3.6 cm flux density of WR 147N, compared to its 1996 values. Thus, its 3.6 cm flux density may have remained constant, within the error, over an interval of 3 yr. On the other hand, the WR 147S 3.6 cm flux density shows a decrease of 14% from its 1996 value. Since the 3.6 cm flux reported here is the combination of two observing runs for WR 147, we can take this value as a highly reliable one. Then, this variation confirms the suggestion of WR 147S variability proposed by Williams et al. (1997) and the variation reported previously by Contreras & Rodríguez (1999). However, this latter paper reports an increase of the radio emission while the present work reports a decrease in the same radio flux density. As Watson et al. (2002) have suggested for the variations in the radio flux at 6 cm, the presence of inhomogeneities in the wind of the WR star can cause quite random variations in the radio emission. A precise comparison of our 6 cm flux density with the 1995 value (Contreras et al. 1996) cannot be made because those data were taken at a lower angular resolution. However, this new value is consistent with the 1998 flux reported by Watson et al. (2002) at the same wavelength. Thus, it may be that flux variations observed at 3.6 cm, which traces material inner in the wind, cannot yet be observed at 6 cm, which traces the outer regions.
Morphologically, the high resolution MERLIN observations of Williams et al. (1997) and Watson et al. (2002) showed that at 6 cm both sources, WR 147S and WR 147N, are asymmetric. However, Contreras & Rodríguez (1999) found no clear elongation in the wind of WR 147S while the northern source was clearly asymmetric. With our new VLA observations we still do not find any clear asymmetry in the southern source, and again the shocked region (northern component) is obviously elongated. As discussed by Contreras & Rodríguez (1999), although we confirm that the northern source is elongated in the E-W direction, the dimensions derived using MERLIN data are smaller than ours because they resolve out extended emission. In Table 1 we report the deconvolved sizes for both sources at all three observed wavelengths. At present, it is quite clear that both radio sources show inhomogeneities. Based on MERLIN observations at 6 cm, Watson et al. (2002) have found that both radio components show radio emission structure. In fact, both emission structures are highly variable as in the case of P Cyg’s wind, but on a larger time-scale. In our maps we can see a slightly independent emitting region at the N-E side of the northern source that has not been detected in previous VLA observations. Giving the high resolution structure observed with MERLIN, we suggest that this small region could be a clump entering the colliding-wind zone as suggested by Setia Gunawan et al. (2001). Besides, we detect, at a 3-4 level, two quite conspicuous condensations in the southern radio component located to the South at 3.6 cm (Figure 3). Besides, the clump directly to the south seems to be have a counterpart at 6 cm (Figure 2), and additionally in the 6 cm map we can see another clump in the S-W direction, which does not coincide well with one any of the two detected at 3.6 cm. What is most surprising about the 3.6 cm blobs is that they seem to lie almost in the same direction and position as those reported by Contreras & Rodríguez (1999), based on data taken 3 years earlier. Since we do not expect them to be the same ones previously observed, then it may be that as Watson et al. (2002) have suggested, the WR wind is directed in a north-south preferential outflow axis.
Derived spectral indices are shown in Table 2. The northern source possesses a negative index indicative of non-thermal emission, which is consistent with previous results. Based on these values, we can see that both spectral indices for the southern component are lower than the expected value for a classical thermal wind. This behaviour can be explained if we consider the extreme flux variability at all wavelengths.
0.3.4 Fitting the WR 147 Bow Shock
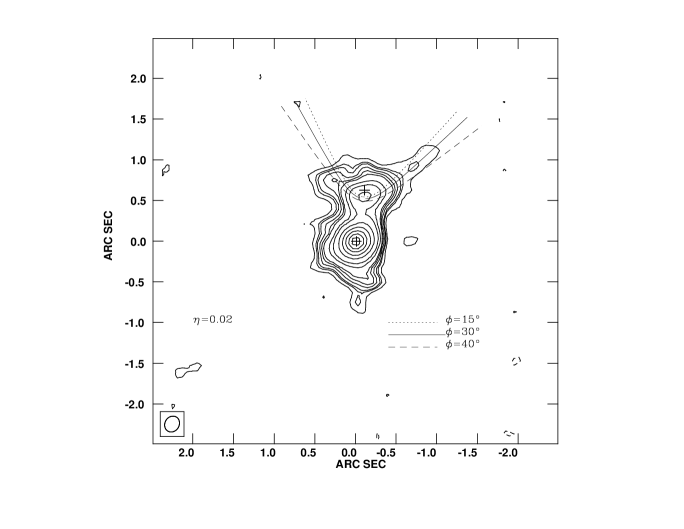
We have previously fitted a colliding wind model to the radio morphology of WR 147N (Contreras & Rodríguez 1999). Given the improved quality of our new maps, we now rederive parameters for the system. In order to apply an analytic model, we will neglect inhomogeneities and possible mass loss variations, as well as the orbital motion of the driving stars. The latter assumption is valid because the wind speeds are much greater than the orbital speeds. A thin shell model for the wind collision has two fundamental parameters under the assumption of steady, isotropic winds: the ratio of momentum loss rates , and the angle between the symmetry axis of the collision surface and the plane of the sky. We adopt the exact solutions of Cantó, Raga & Wilkin (1996) for the collision surface, and apply the projection method described by Wilkin (1997) (see also, Raga et al. 1997). Along the line joining the centers of the two stars, the winds collide head-on at the stagnation point. If the stars are separated by a distance , and the stagnation point is at distance from the source of the weaker wind, may be obtained from the ratio This ratio is independent of the angle at which we view the system. In our fit, we assume that the peak emission of WR 147N corresponds to the stagnation point, and measure its position relative to WR 147S, The observed separation of the two stars, was taken from Williams et al. (1997). We obtain . This new value of differs from the one obtained by Contreras & Rodríguez (1999) of 0.01, but is still consistent within error. Our revised value is also in agreement with that used by Dougherty et al. (2003) to reproduce the observed 5 GHz radio synchrotron and thermal emission. Our assumption that the brightest part of the wind collision surface corresponds to the stagnation point is intuitive, since the normal shock velocity is greatest at this location, but is also supported by simulated images of colliding winds (Raga et al. 1997). Given a value of , we then calculated the projected shock surface for several values of (Fig. 3). Reasonable fits to the bow shock wings are obtained for , with a best fit of . Thus, a lower limit to the inclination angle of the orbit would be . Although our curve is in good agreement with the northwestern wing of the bow shock, the northeastern wing appears to be more open, suggesting a non-axisymmetric morphology. Although analytic models may be generated for non-axisymmetric bow shocks (Wilkin 2000), such models introduce too many free parameters to attempt a unique solution given the present maps (see Gaensler 2002). However, it would be interesting to constrain such a model with additional kinematic information derived from observations of spatially resolved line emission.
0.4 Summary
All of our observed objects are clear examples of non-classical winds. P Cyg deviates in at least two ways from the standard model: its wind is anisotropic and inhomogeneous. Additionally, it is a highly variable source, both in its radio flux density at all wavelengths observed and in its morphological structure. This variability has been previously reported based on high angular resolution observations. We confirm that at a lower resolution we still detect variations. We found that Cyg OB2 No. 12 is a non-spherical source at 6 cm and we suggest that the observed elongation is due to a blob denser than the surrounding wind material. Thus, we report Cyg OB2 No. 12 as an inhomogeneous wind source for the first time. WR 147 is one of the most interesting binary systems. A highly structured wind has been reported at high angular resolution. In this work, we detect two possible clumps in the wind of the WR star. These blobs are almost in the same direction and position as those reported previously by Contreras & Rodríguez (1999). This confirms the suggestion of Watson et al. (2002) of a north-south preferential outflow axis. The shock region (north radio component) seems to possess a faint emission peak located to its N-E side which could be a clump crossing this zone. We have fitted a theoretical bow shock curve to the northern radio component based on our new VLA data. These data give a higher wind momentum ratio, , than the one derived previously but it is still consistent within error. Our new best fitting curve corresponds to an angle of degrees which gives a lower limit to the inclination angle of the orbit.
In this way, our new VLA data confirm the non-standard wind behaviour of these three interesting sources.
Acknowledgements.
We thank Luis F. Rodríguez for his valuable comments on several versions of the manuscript. M.E.C, F.P.W. and G.M. thank financial support from DGAPA-PAPIIT and CONACyT-Ciencias Básicas. F.P.W. also wishes to thank the NSF-International Researchers Fellows Program for financial support.References
- (1) Abbott, D. C., Bieging, J. H., & Churchwell, E. 1981, ApJ, 250, 645
- (2) Cantó, J., Raga, A. & Wilkin, F. P. 1996, ApJ, 469, 729
- (3) Contreras, M. E., Rodríguez, L. F., Gomez, Y., & Velazquez, A. 1996, ApJ, 469, 329
- (4) Contreras, M. E. & Rodríguez, L. F. 1999, ApJ, 515, 762
- (5) Cherepashchuk, A. M. 1990, Soviet Astronomy, 34, 481
- (6) de Jager, C. 2001, in P Cyg 2000: 400 Years of Progress, ASP Conf. Proc., Vol. 233, eds. M. de Groot and C. Sterken, (San Francisco), 215
- (7) Dougherty, S. M., Pittard, J. M., Kasian, L., Coker, R. F., Williams, P. M., & Lloyd, H. M. 2003, A&A, 409, 217
- (8) Exter, K.M., Watson, S.K., Barlow, M.J. & Davis, J. 2002, MNRAS, 333, 715
- (9) Gaensler, B. M., Jones, D. H., & Stappers, B. W. 2002, ApJ, 580, L137
- (10) Georgiev, L. & Koenigsberger, G. 2002, in ASP Conf. Ser. 260, Interacting Winds from Massive Stars, eds. A.F.J. Moffat & N. St-Louis, 393
- (11) Girard, T. & Willson, L. A. 1987, A&A, 183, 247
- (12) Luehrs, S. 1997, PASP, 109, 504
- (13) Moffat, A. F. J. & Robert, C. 1994, ApJ, 421, 310
- (14) Morris, P. W., van der Hucht, K. A., Crowther, P. A., Hillier, D. J., Dessart, L., Williams, P. M. & Willis, A. J. 2000, A&A, 353, 624
- (15) Panagia, N. & Felli, M. 1975, A&A, 39, 1
- (16) Raga, A. C., Cantó, J., Curiel, S., Noriega-Crespo, A., & Raymond, J. C. 1997, RMAA, 33, 157
- (17) Setia Gunawan, D. Y. A., de Bruyn, A.G., van der Hucht, K.A. & Williams, P.M. 2001, A&A, 368, 484
- (18) Skinner, C.J., Becker, R.H., White, R.L., Exter, M., Barlow, M.J. & Davis, R.J. 1998, MNRAS, 296, 669
- (19) van Genderen, A. M. 2002, Journal of Astronomical Data, 8, 8
- (20) Watson, S.K., Davis, R.J., Williams, P.M. & Bode, M.F. 2002, MNRAS, 334, 631
- (21) Williams, P. M., Dougherty, S. M., Davis, R. J., van der Hucht, K. A., Bode, M. F., & Setia Gunawan, D. Y. A. 1997, MNRAS, 289, 1
- (22) Wilkin, F. P. 1997, Ph.D. Thesis, University of California
- (23) Wilkin, F.P. 2000, ApJ, 532, 400
- (24) Wright, A. E. & Barlow, M. J. 1975, MNRAS, 170, 41