Potential Variations in the Interstellar N I Abundance11affiliation: Based on observations made with the NASA-CNES-CSA , which is operated for NASA by the Johns Hopkins University under NASA contract NAS 5-32985, and the NASA/ESA , obtained from the MAST data archive at the Space Telescope Science Institute. STScI is operated by the Association of Universities for Research in Astronomy, Inc. under the NASA contract NAS 5-26555.
Abstract
We present Far Ultraviolet Spectroscopic Explorer (FUSE) and Space Telescope Imaging Spectrograph observations of the weak interstellar N I 1160 doublet toward 17 high-density sightlines [(Htot) 1021 cm-2]. When combined with published data, our results reveal variations in the fractional N I abundance showing a systematic deficiency at large (Htot). At the FUSE resolution ( 20 km s-1) the effects of unresolved saturation cannot be conclusively ruled out, although O I 1356 shows little evidence for saturation. We investigated the possibility that the N I variability is due to the formation of N2 in our mostly dense regions. The 0-0 band of the c1 X1 transition of N2 at 958 Å should be easily detected in our data; for 10 of the denser sightlines N2 is not observed at a sensitivity level of a few times 1014 cm-2. The observed N I variations are suggestive of an incomplete understanding of nitrogen chemistry.
1 Introduction
Elemental abundance studies are important for models of Galactic chemical evolution. Studies of the interstellar oxygen abundance support a relatively constant value of O/Htot = (3.43 0.15) 10-4 out to 1000 kpc, with any variability less than the 1 measurement uncertainties (Meyer, Jura, & Cardelli 1998; Cartledge et al. 2001; André et al. 2003). The situation is not as clear for carbon and nitrogen. In this work, we focus specifically on the abundance of interstellar nitrogen.
It is generally believed that interstellar nitrogen is a product of the CNO cycle and recycled into the ISM through the winds of low and intermediate mass stars (e.g., red giant branch and/or asymptotic giant branch stars (AGB); Pilyugin, Thuan, & Vichez 2003). In contrast, oxygen is produced in stars during the He burning phase and is returned to the ISM via supernovae.
Early studies (Lugger et al. 1978; Ferlet 1981; York et al. 1983) of interstellar N I using the Copernicus satellite investigated moderately dense lines of sight and found that (N I) increases linearly with (Htot) [(Htot) = 2(H2) + (H I)]. Using high-quality Goddard High-Resolution Spectrograph (GHRS) data for seven sight lines with (Htot) 1021 cm-2, Meyer, Cardelli, & Sofia (1997) suggested that the interstellar nitrogen abundance is constant, N/Htot = (7.5 0.4) 10-5. However, Jenkins et al. (1999) and Sonneborn et al. (2000), using data from the Interstellar Medium Absorption Profile Spectrograph (IMAPS), show a factor-of-2 variation in the N I abundance between Ori [N I/Htot = (3.97 0.30) 10-5] and Vel [N I/Htot = (7.99 0.47) 10-5].
In the near interstellar medium (ISM), 100pc, N I is more affected by ionization than O I because O I is coupled more strongly to H I by charge exchange reactions (Sofia & Jenkins 1998; Jenkins et al. 2000; Lehner et al. 2003). Therefore, these near ISM sightlines (Lehner et al. 2003) will not be discussed here. The effects of ionization at larger column densities are thought to be insignificant. In addition, nitrogen is not incorporated into refractory interstellar dust grains (Sofia, Cardelli, & Savage 1994). Nitrogen bearing interstellar ices (Gibb, Whittet, & Chiar 2001; Chiar et al. 2002) are not expected along our moderately reddened ( 2.0) sight lines since interstellar ices do not form until 3 (Whittet et al. 2001). However, nitrogen chemistry and N2 formation should become important.
In order to probe the extent of potential variations in the interstellar nitrogen abundance, we have undertaken a survey of the weak interstellar N I doublet 1159.817, 1160.937. Use of this doublet removes uncertainty in oscillator strengths (-values) for different transitions and allows for a direct comparison to the work of Meyer et al. (1997). Our survey utilized archival data from the Far Ultraviolet Spectroscopic Explorer (FUSE; Moos et al. 2000) and the Space Telescope Imaging Spectrograph (STIS) on board the Hubble Space Telescope (HST) toward 17 high-density [(H) 1021 cm -2] sightlines.
2 Observations and Data Reduction
2.1 Data
The N I data for 16 of the stars studied here, shown in Table 1, were obtained throughout the Prime mission phase (November 1999 March 2003). All of the data were acquired with the star in the large aperture (30 x 30 ; LWRS) with the exception of HD 219188 for which the medium aperture (4 x 20 ; MDRS) was utilized. The data cover the wavelength range 905 1185 Å with a spectral resolution equivalent to 20 km s-1. The weak interstellar N I doublet at 1160 Å appears in both the LiF1 and LiF2 channels which provides a consistency check to rule out the possibility of detector artifacts.
The time-tagged and histogram data were reduced and calibrated with CalFUSE111The CalFUSE Pipeline Reference Guide is available at http://fuse.pha.jhu.edu/analysis/pipeline_reference.html. (version 2.2.2; Dixon & Sahnow 2003). CalFUSE provides the appropriate Doppler corrections to remove the effects of the spacecraft motion and places the data on the heliocentric velocity scale (). The wavelength solution provides good relative calibration across the LiF channels. In order to minimize the uncertainties in the relative wavelength calibration between exposures, the data were co-added with a cross correlation technique. We used interstellar H2 lines in several of the channels to fix the velocity scale (). The final summed spectra (near 1160 Å) have signal-to-noise (S/N) ratios between 20 and 300 per resolution element for all data sets. S/N ratios greater than 30 were obtained utilizing focal plane splits or other similar procedures.
2.2 STIS Data
STIS observed HD 147888 (N I 1161) for 1656 s on 2000 Aug 17, HD 24534 (O I 1356) for 2945 s on 2001 Mar 25, and HD 219188 (O I 1356) for 1200 s on 2001 Sept 27. The N I 1161 data for HD 147888 used the E140H grating centered at 1271 Å and the 0.2′′ x 0.09′′ aperture resulting in a resolving power () of about 100,000 ( 2.8 km s-1). The O I 1356 data utilized the same grating but with the 0.1′′ x 0.03′′ aperture centered on 1416 for HD 24534 and on 1271 for HD 219188 resulting in 200,000 ( 1.5 km s-1).
The E140H setup centered at 1271 used to measure N I toward HD 147888, is not ideal since the stronger N I line is not obtained. In addition, the MgF2 detector windows severely attenuates the flux below 1200 Å. The 1161 Å line can only be detected in relatively dense sightlines or with long exposure times. With the exception of HD 147888, examination of the archival data for other sightlines did not reveal evidence for the N I 1161 Å line due to the relatively low S/N ( 15 per resolution element).
The data were reduced and extracted with the CALSTIS pipeline (v2.13b). The subtraction of background and scattered light from the echelle data employs the algorithm of Lindler & Bowers (2000). CALSTIS provides the appropriate Doppler corrections to place the spectra on the scale. The spectrum of HD 147888 at N I 1161 has a S/N ratio of 12 per resolution element. For O I 1356 toward HD 24534 and HD 219188, we obtained a S/N of 70 and 48 per resolution element, respectively.
3 Results and Discussion
Figure 1 shows the apparent column density (ACD) profiles, , for both members of the weak interstellar N I doublet toward 2 stars of our stellar sample. See Savage & Sembach (1991) for a detailed discussion of the apparent optical depth method. The excellent overall agreement between the profiles for both members of the N I doublet implies that the apparent column densities are the true column densities. Table 1 presents our N I column densities, the average of both members of the doublet except HD 147888 (assumed to be unsaturated). Also presented are the measured equivalent widths (s) of the N I doublet for each star. Finally, Table 1 shows the available , , GHRS, IMAPS, and STIS measurements of (N I), (Htot), and (O I).
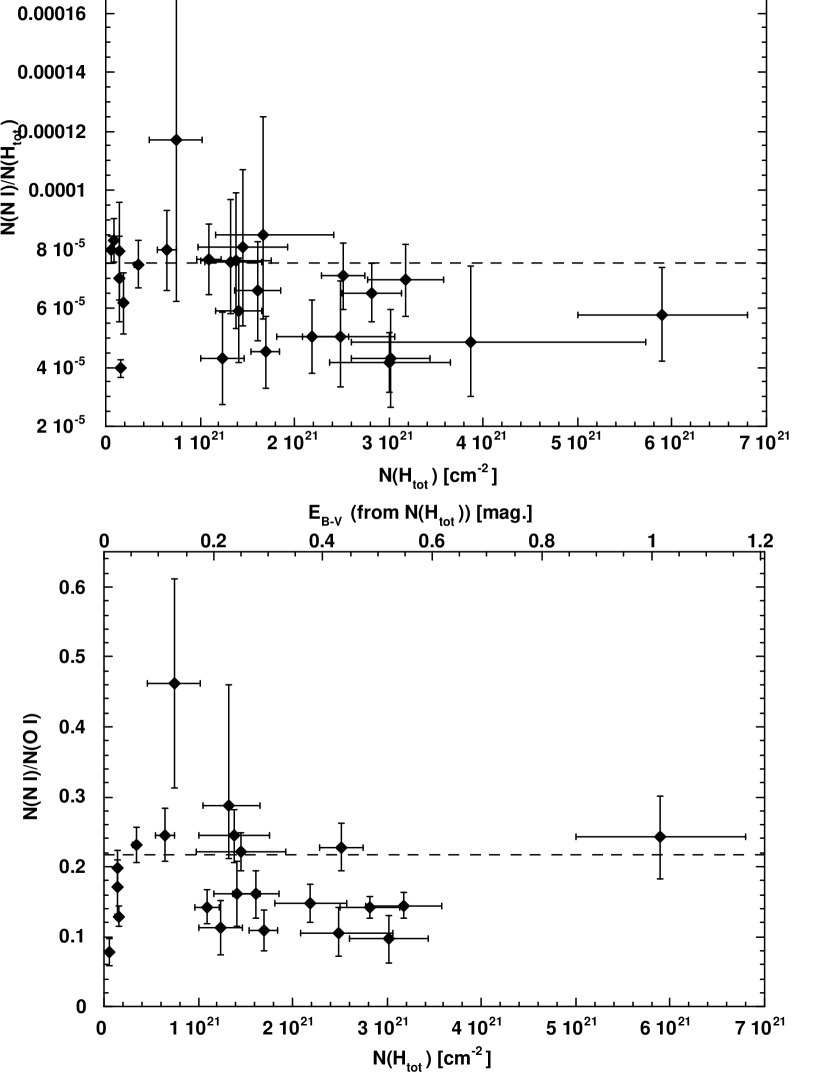
Figure 2 () shows (N I)/(Htot) versus (Htot) which reveals a departure from the average at high column densities. With the exception of Ori, the N I abundance appears to be constant for (Htot) 1021 cm-2, but an anticorrelation seems to be present for greater column densities. A Student t test yields a 7.6% probability that the data sets for (Htot) 1021 cm-2 and (Htot) 1021 cm-2 (including the outlier Ori) arise from the same parent population. If Ori is excluded, the probability is reduced to 1.3%. Therefore, we conclude that the observed variability is real. Figure 2 () depicts (N I)/(O I) as a function of (Htot). The data point for HD 147888, the densest sightline presented here, is high because O I is slightly depleted (Cartledge et al. 2001). The large scatter in N/O supports that the variation in N I is not an artifact introduced by the larger uncertainties for (Htot).
In order to test whether the observed N I variability is due to observational effects (i.e., saturation) we calculated curves-of-growth for four stars which exhibited deviant behavior (e.g., HD 179406) and six stars which did not. The curve of growth results agree with those obtained from the ACD method. Additionally, our results compare favorably to previous N I measurements (Hoopes et al. 2003; Sonnentrucker 2003, private communication). We believe saturation effects to be minimal since / = 1.4 and O I shows little evidence for saturation (e.g., Cartledge et al. 2001).
A second source of systematic error could arise if the instrinsic absorption profile consisted of a narrow, but unsaturated, feature plus broad shallow wings. In such a scenario, the weak N I doublet associated with the broad component could be too weak to be detected at low S/N. If enough H I column is located in the broad component, this could skew the N I/Htot ratio to systematically low values. We can investigate this possibility in two ways: 1.) through a comparison of the measured Doppler broadening parameter, -value, for the N I and hydrogen lines and 2.) comparing N I/Htot vs. distance to test whether systematically lower ratios are caused by additional weak kinematic components for the longer lines-of-sight (Spitzer 1985).
Unfortunately, both the Ly- line of H I and the = 0, 1 lines of H2 typically lie on the square-root part of the curve of growth for these sightlines and are insensitive to the -value. However, -values can nominally be measured for the 2 lines of H2. The published -values for HD 73882, HD 110432, HD 185418, and HD 192639 (Rachford et al. 2001; Sonnentrucker et al. 2002; Sonnentrucker 2003, private communication), all show comparable or smaller -values for H2 than for N I indicating that all the N I is detected. Additionally, no statistically significant slope of N I/Htot vs. stellar distance (125pc 2kpc) is found for our sample. These points argue against intrinsic line shape contributing to the N I/Htot deficiencies reported herein.
3.1 N2
Based on models of steady-state, gas-phase interstellar chemistry, N2 is expected to be the most abundant nitrogen-bearing molecule in dense clouds. Viala (1986) predicts that at the column densities of the sight lines studied here [(Htot) of a few times 1021 cm-2], the N2 column densities should be on the order of 15% of the N I abundance or (N2) 1016 cm-2. Inclusion of time dependence or depletion onto grain mantles (Bergin, Langer, & Goldsmith 1995) could result in a slightly smaller gas-phase N2 abundance. However, N2 is still predicted to be the most abundant nitrogen bearing molecule.
The strongest band of N2, covered by , is the 0-0 band of the c1 X1 transition of N2 at 958 Å. Other N2 bands reside in the far-ultraviolet, but are blended with more abundant species (e.g., H2). Utilizing the laboratory wavelengths and -values for the 0-0 band (Stark et al. 2000), we created several synthetic N2 spectra, assuming level populations for excitation temperatures between 10 1000 K (c.f., McCandliss 2003). Our synthetic spectrum is saturated for (N2) = 1016 cm-2. Therefore, we searched our data for the presence of N2.
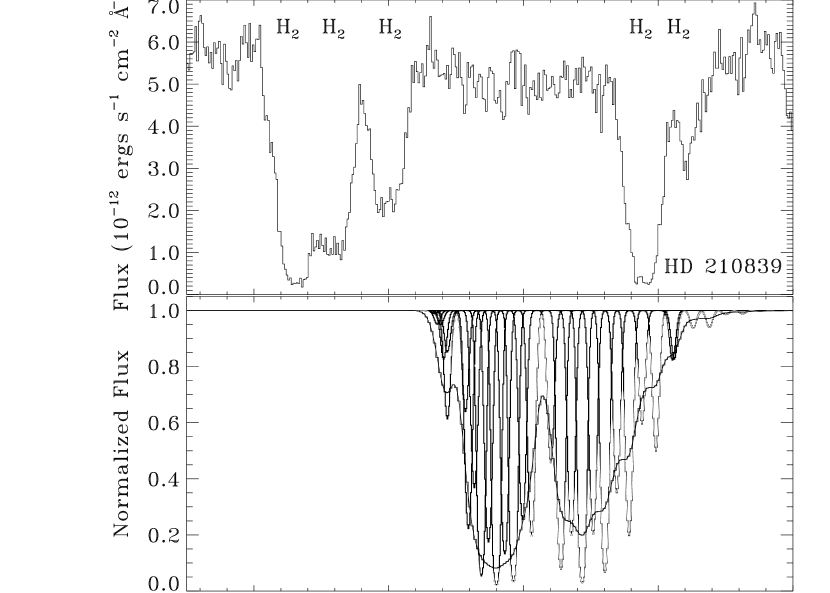
Figure 3 () exhibits the 958 Å portion of the spectrum toward HD 210839 [( ) = 0.62 mag.] and the bottom panel shows our synthetic N2 spectrum for (N2) = 1015 cm-2, 10% of that predicted. The lower column density incorporates the effects of four velocity components detected in O I 1356 (André et al. 2003) along the line of sight with similar amounts of material. There is no evidence for N2 in the spectrum of HD 210839 to a level of a few times 1014 cm-2. Examination of the ten densest sightlines that have data also show a similar dearth of N2. Hence, gas-phase N2 cannot explain the observed N I variability. Quantitative limits on N2 will be presented in a subsequent paper.
4 Summary
Our data show that the interstellar N I abundances relative to H I and O I appear to vary. Very high-resolution studies of these and other sight lines will help to verify and expand the findings reported here. Although N2 is expected to be the most abundant nitrogen-bearing molecule in moderately dense [log (H2) 1021 cm-2] clouds (e.g., Viala 1986), our data do not support the predicted abundances. The presence of an anticorrelation above (Htot) = 1021 cm-2 suggests that the mostly likely explanation of the interstellar N I variability is the need for a better understanding of nitrogen chemistry. However, differences in the mixing processes of products from AGB stellar outflows and SN may also contribute.
References
- André et al. (2003) André, M., et al. 2003, ApJ, 591, 1000
- Bergin, Langer, & Goldsmith (1995) Bergin, E. A., Langer, W. D., & Goldsmith, P. F. 1995, ApJ, 441, 222
- Bohlin, Savage, & Drake (1978) Bohlin, R. C., Savage, B. D., & Drake, J. F. 1978, ApJ, 224, 132
- Cartledge et al. (2001) Cartledge, S. I. B., Meyer, D. M., Lauroesch, J. T., & Sofia, U. J. 2001, ApJ, 562, 394
- Chiar et al. (2002) Chiar, J. E., Adamson, A. J., Pendleton, Y. J., Whittet, D. C. B., Caldwell, D. A., & Gibb, E. L. 2002, ApJ, 570, 198
- Diplas & Savage (1994) Diplas, A., & Savage, B. D. 1994, ApJS, 93, 211
- Dixon & Sahnow (2003) Dixon, W. V., & Sahnow, D. J. 2003, in ASP Conf. Ser. 295, Astronomical Data Analysis Software Systems XII, ed. H. E. Payne, R. I. Jedrzejewski, & R. N. Hook (San Francisco: ASP), 241
- Ferlet (1981) Ferlet, R. 1981, A&A, 98, L1
- Fitzpatrick & Spitzer (1994) Fitzpatrick, E. L., & Spitzer, L. 1994, ApJ, 427, 232
- Gibb, Whittet, & Chiar (2001) Gibb, E. L., Whittet, D. C. B., & Chiar, J. E. 2001, ApJ, 558, 702
- Hoopes et al. (2003) Hoopes, C. G., Sembach, K.R., Hébrard, G., Moos, H. W., & Knauth, D. C. 2003, ApJ, 586, 1094
- Jenkins et al. (1999) Jenkins, E. B., Tripp, T. M., Wozniak, P. R., Sofia, U. J., & Sonneborn, G. 1999, ApJ, 520, 182
- Jenkins et al. (2000) Jenkins, E. B., et al. 2000, ApJ, 538, L81
- Keenan, Hibbert, & Dufton (1985) Keenan, F. P., Hibbert, A., & Dufton, P. L. 1985, A&A, 147, 89
- Lehner et al. (2003) Lehner, N., Jenkins, E. B., Gry, C., Moos, H. W., Chayer, P., & Lacour, S. 2003, ApJ, in press
- Lindler & Bowers (2000) Lindler, D., & Bowers, C. 2000, BAAS, 32, 1418
- Lugger et al. (1978) Lugger, P. M., York, D. G., Blanchard, T., Morton, D. C. 1978, ApJ, 224, 1059
- McCandliss (2003) McCandliss, S. R. 2003, PASP, 115, 651
- Meyer, Cardelli, & Sofia (1997) Meyer, D. M., Cardelli, J. A., & Sofia, U. J. 1997, ApJ, 490, L103
- Meyer, Jura, & Cardelli (1998) Meyer, D. M., Jura, M., & Cardelli, J. A. 1998, ApJ, 493, 222
- Moos et al. (2000) Moos et al. 2000, ApJ, 538, L1
- Pilyugin, Thuan, & Vílchez (2003) Pilyugin, L. S., Thuan, T. X., & Vílchez, J. M. 2003, A&A, 397, 487
- Rachford et al. (2001) Rachford, B. L., et al. 2001, ApJ, 555, 839
- Rachford et al. (2002) Rachford, B. L., et al. 2002, ApJ, 577, 221
- Savage et al. (1977) Savage, B. D., Drake, J. F., Budich, W., & Bohlin, R. C. 1977, ApJ, 216, 291
- Savage & Sembach (1991) Savage, B. D., & Sembach, K. R. 1991, ApJS, 83, 147
- Sofia, Cardelli, & Savage (1994) Sofia, U. J., Cardelli, J. A., & Savage, B. D., 1994, ApJ, 430, 650
- Sofia & Jenkins (1998) Sofia, U. J. & Jenkins, E. B. 1998, ApJ, 499, 951
- Sonneborn et al. (2000) Sonneborn, G., Tripp, T. M., Ferlet, R., Jenkins, E. B., Sofia, U. J., Vidal-Madjar, A., & Wozniak, P. R. 2000, ApJ, 545, 277
- Sonnentrucker et al. (2002) Sonnentrucker, P., Friedman, S. D., Welty, D. E., York, D. G., & Snow, T. P. 2002, ApJ, 576, 241
- Spitzer (1985) Spitzer, L. 1985, ApJ, 290, L21
- Stark et al. (2000) Stark, G., Huber, K. P., Yoshino, K., Chan, M.-C., Matsui, T., Smith, P. L., & Ito, K. 2000, ApJ, 531, 321
- Viala (1986) Viala, Y. P. 1986, A & AS, 64, 391
- Welty et al. (1999) Welty, D. E., Hobbs, L. M., Lauroesch, J. T., Morton, D. C., Spitzer, L., & York, D. G. 1999, ApJS, 124, 465
- Whittet et al. (2001) Whittet, D. C. B., Gerakines, P. A., Hough, J. H., & Shenoy, S. S. 2001, ApJ, 547, 872
- York et al. (1983) York, D.G., Spitzer, L., Jenkins, E. B., Bohlin, R. C., Hill, J., Savage, B. D., & Snow, T. P. 1983, ApJ, 266, L55

| Star | 22footnotemark: | 22footnotemark: | (N I) | (N I)/(Htot) | (O I) | N I/O I | Ref | |
|---|---|---|---|---|---|---|---|---|
| [mÅ] | [mÅ] | [cm-2] | [cm-2] | |||||
| 2 Vel | (4.10 0.21) 1015 | (7.99 0.47) 10-5 | (5.23 1.27) 1016 | 0.08 0.02 | 3, 4 | |||
| Pup | (7.62 0.51) 1015 | (8.30 0.74) 10-5 | 17.70 | 0.02 | 3, 5 | |||
| Ori | 1.00 0.15 | 0.30 | (9.87 1.48) 1015 | (7.00 1.45) 10-5 | (5.8 1.0) 1016 | 0.17 0.04 | 6, 7, 8, 9 | |
| Cas | 1.15 0.12 | 0.40 0.12 | (1.15 0.11) 1016 | (7.93 1.66) 10-5 | (5.8 0.5) 1016 | 0.20 0.03 | 6, 7, 8, 9 | |
| Ori | (6.19 0.31) 1015 | (3.97 0.30) 10-5 | (4.8 0.5) 1016 | 0.13 0.02 | 4, 7, 10 | |||
| Sco | 1.10 0.15 | 0.40 0.15 | (1.11 0.14) 1016 | (6.17 1.04) 10-5 | 6, 8, 9 | |||
| Ori | 2.60 0.15 | 0.65 0.15 | (2.54 0.14) 1016 | (7.49 0.80) 10-5 | (1.1 0.1) 1017 | 0.23 0.03 | 6, 7, 8, 9 | |
| Ori | 4.95 0.20 | 1.45 0.20 | (5.15 0.30) 1016 | (7.97 1.37) 10-5 | (2.1 0.3) 1017 | 0.25 0.04 | 6, 7, 8, 9 | |
| HD 219188 | 8.4 1.3 | 2.5 0.8 | (8.72 2.43) 1016 | (1.17 0.55) 10-4 | (1.89 0.31) 1017 | 0.46 0.15 | 8, 9, 11 | |
| HD 195965 | 8.1 0.4 | 2.4 0.4 | (8.36 0.84) 1016 | (7.67 1.19) 10-5 | (5.89 ) 1017 | 0.14 | 11, 12 | |
| HD 88115 | 5.7 1.1 | 1.3 0.6 | (5.33 1.68) 1016 | (4.30 1.57) 10-5 | (4.7 0.6) 1017 | 0.11 0.04 | 11, 13 | |
| HD 191877 | 9.3 0.5 | 3.0 0.5 | (1.00 0.11) 1017 | (7.58 ) 10-5 | (3.47 ) 1017 | 0.29 | 11, 12 | |
| Oph | 7.56 0.74 | 2.68 0.99 | (1.05 0.13) 1017 | (7.61 2.30) 10-5 | (4.3 0.4) 1017 | 0.24 0.04 | 6, 7, 8, 9 | |
| HD 75309 | 8.4 1.3 | 2.2 0.8 | (8.37 2.07) 1016 | (5.94 1.78) 10-5 | (5.2 0.8) 1017 | 0.16 0.05 | 11, 13, 14 | |
| Sco | 11.20 0.30 | 3.30 0.30 | (1.17 0.06) 1017 | (8.07 2.65) 10-5 | (5.3 0.6) 1017 | 0.22 0.03 | 5, 6 | |
| HD 218915 | 11.9 1.2 | 2.5 1.0 | (1.06 0.22) 1017 | (6.58 1.68) 10-5 | (6.6 0.4) 1017 | 0.16 0.04 | 11, 13 | |
| HD 110432 | 10.5 0.7 | 4.8 0.9 | (1.42 0.21) 1017 | (8.50 ) 10-5 | 11, 15 | |||
| HD 94493 | 7.7 1.2 | 2.1 0.7 | (7.64 1.93) 1016 | (4.52 1.21) 10-5 | (7.0 0.6) 1017 | 0.11 0.03 | 11, 13 | |
| HD 24534 | 10.2 0.9 | 3.1 0.8 | (1.10 0.20) 1017 | (5.02 1.25) 10-5 | (7.43 0.28) 1017 | 0.15 0.03 | 11, 15 | |
| HD 185418 | 16.0 2.0 | 2.7 1.5 | (1.35 0.37) 1017 | (5.42 ) 10-5 | (1.20 ) 1018 | (0.11 ) | 11, 13, 14, 16 | |
| HD 99857 | 15.5 1.3 | 5.2 0.9 | (1.78 0.24) 1017 | (7.09 1.14) 10-5 | (7.8 0.5) 1017 | 0.23 0.03 | 11, 13 | |
| HD 210839 | 16.5 0.7 | 5.4 0.8 | (1.84 0.19) 1017 | (6.53 1.00) 10-5 | (1.30 0.06) 1018 | 0.14 0.02 | 11, 13 | |
| HD 179406 | 10.5 1.4 | 3.8 1.3 | (1.25 0.31) 1017 | (4.15 1.01) 10-5 | 8, 9, 11 | |||
| HD 192639 | 12.5 2.7 | 3.3 1.6 | (1.30 0.46) 1017 | (4.31 1.64) 10-5 | (1.35 0.06) 1018 | 0.10 0.03 | 11, 13, 17 | |
| HD 124314 | 19.5 1.2 | 6.5 1.1 | (2.21 0.27) 1017 | (6.95 1.21) 10-5 | (1.53 0.08) 1018 | 0.14 0.02 | 11, 13 | |
| HD 73882 | 16.0 1.6 | 5.6 1.6 | (1.88 0.38) 1017 | (4.87 ) 10-5 | 11, 15 | |||
| HD 147888 | 7.3 1.5 | (3.41 0.78) 1017 | (5.78 1.59) 10-5 | (1.41 0.11) 1018 | 0.24 0.06 | 11, 14 |
References (1) In order of increasing (Htot) with 1 measurement uncertainties; (2) Expected = 3.53 (3) Sonneborn et al. 2000; (4) Fitzpatrick & Spitzer 1994; (5) Keenan, Hibbert, & Dufton 1985; (6) Meyer et al. 1997; (7) Meyer et al. (1998) with updated O I 1356 -value (Welty et al. 1999); (8) H2 from Savage et al. 1977; (9) H I weighted mean of Bohlin, Savage, & Drake (1978) and Diplas & Savage (1994); (10) Jenkins et al. 1999; (11) This work; (12) Hoopes et al. 2003; (13) André et al. 2003; (14) Cartledge et al. 2001; (15) Rachford et al. 2002; (16) Sonnentrucker 2003, private communication; (17) Sonnentrucker et al. 2002.