Physical restrictions on the models of gamma-ray bursts
Abstract
The present common view about GRB origin is related to cosmology. There are two evidences in favor of this interpretation. The first is connected with statistics, the second is based on measurements of the redshifts in the GRB optical afterglows. Redshifts in optical afterglows had been observed only in long GRB. Comparison of KONUS and BATSE data about statistics and hard X-ray lines is done, and some differences are noted. Hard gamma-ray afterglows, prompt optical spectra and polarization measurements could be very important for farther insight into GRB origin. Possibility of galactic origin of short GRB is discussed as well as their possible connection with soft gamma repeaters.
1 Introduction
It is generally accepted now that cosmic gamma-ray bursts (GRB) discovered in 1973 [33] have a cosmological origin. The first cosmological model, based on explosions in active galactic nuclei (AGN) was suggested in [50]. A mechanism of the GRB origin in the vicinity of a collapsing object based on neutrino-antineutrino annihilation was analyzed in [6]. It was obtained that the efficiency of transformation of the neutrino flux energy ergs into -ray and -ray burst is , with the energy output in the GRB ergs. Numerical three-dimensional simulations of models of two colliding neutron stars (NS) [52] and of a hot torus around a black hole (BH) [53] gave larger efficiency of -ray and -ray production, up to in the first, and in the second model. This difference may be partly connected with more preferable geometry of the neutrino flux increasing the annihilation rate relative to estimations in the spherical geometry in [6]. Nevertheless, even these optimistic results, permitting GRB formation with a total -ray and -ray energy up to ergs are not enough for explanation of the energy output in some GRB, where only prompt optical energy emission reaches ergs, and the isotropic gamma-ray flux is about ergs: GRB 990123 with the red shift [3, 37].
Here we discuss different observational features of GRB, analyze difficulties and problems of their interpretation in the cosmological model, and physical restrictions to their model. At the end we are analyze some problems of soft gamma repeater (SGR) interpretation as magnetars.
2 GRB physical models
The restrictions to the model follow from the energy conservation law, but much stronger ones are imposed by the necessity to fulfill the physical laws: the weakly interacting neutrino can be transformed into the radiation only with a rather low efficiency. The GRB models may be classified by two levels. The upper one is related directly to the observational appearance, and include 3 main models.
1. Fireball.
2. Cannon ball (or gun bullet).
3. Precessing jets.
The main restrictions are connected with the next (basic) level of GRB model, which is related to energy source, producing a huge energy output necessary for a cosmological GRB model. These class contains 5 main models.
1. (NS+NS), (NS+BH) mergers.
This mechanism was investigated numerically in [52, 53], Gamma radiation is produced here by annihilation, and the energy output is not enough to explain most powerful GRB even with account of strong beaming. The energy emitted in the optical afterglow of GRB 990123 [3, 37] is about an order of magnitude larger than the total radiation energy output in this model.
2. Magnetorotational explosion.
Magnetorotational explosion, proposed in [46] for an explanation of the huge energy production in a cosmological GRB, had been suggested earlier for the supernova explosion in [7]. Numerical 1-D and 2-D calculations gave the efficiency of a transformation of the rotational energy into the kinetic one at the level of few percent [4, 5]. This is enough for an explanation of the supernovae energy output but is too low for cosmological GRB, because the energy lost by radiation is even less than in the merger model.
3. Hypernova.
This model, also suggested in [46] is rather popular now, because traces of the supernova explosions are believed to be found in the optical afterglows of several GRB [64, 16]. The restrictions of the ”hypernova” model had been analyzed in [13].
The first two models seems to be able to produce the energy output on the level of the ordinary supernova explosion, but there are no numerical simulations of these explosions, in which the energy output was enough for a cosmological GRB. The third model is more vaguely formulated and no numerical simulations have been done so far.
4. Magnetized disks around rotating (Kerr) black holes (RBH).
This model is based on extraction of rotating energy of RBH when magnetic field is connecting the RBH with the surrounding accretion disk or accretion torus [54, 12, 66].
5. GRB created by the pair-electromagnetic pulse from an electromagnetic black hole surrounded by a baryonic remnant. This model [55] is based on vacuum explosion in the dyadosphere, the region in which a supercritical field exists for the creation of e+e- pairs. The problem of formation of such region needs farther clarification.
3 Basement of a cosmological GRB origin:
statistics
The conclusion about the cosmological origin of GRB is based on the analysis of their statistical properties, and spectra of optical afterglows, showing highly redshifted lines.
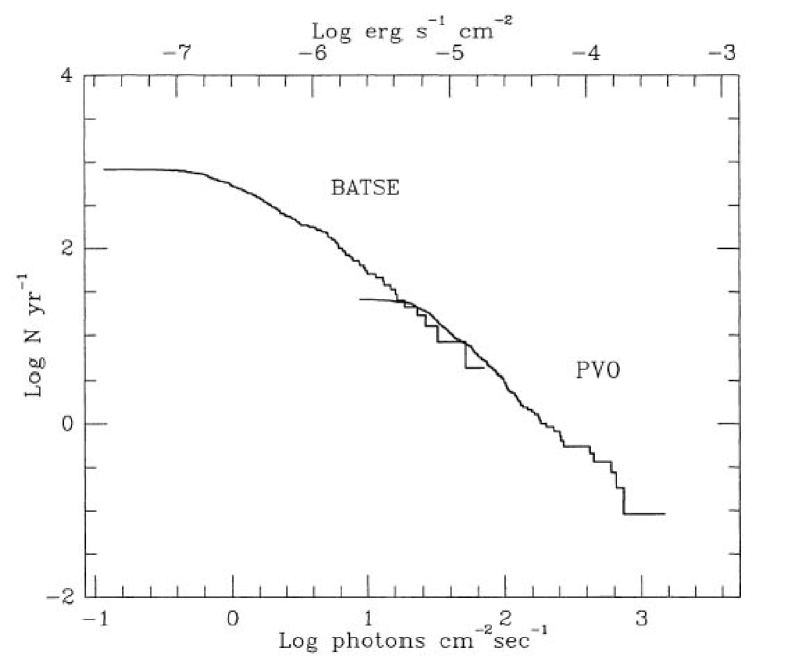
Statistical arguments in favor of the cosmological origin of GRB are based on a visual isotropy of GRB distribution on the sky in combination with a strong deviation of (or equivalent) distribution from the euclidian uniform distribution with the slope , obtained in BATSE observations [43]. This observational result is not new. Similar properties have been obtained in KONUS experiment [39] represented in fig.1.
=05.3cm
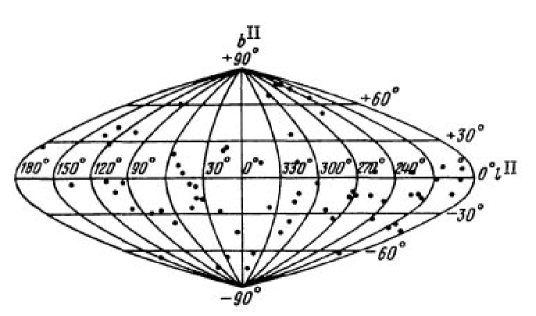
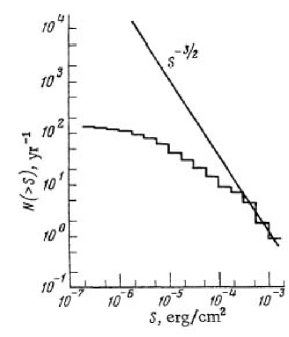
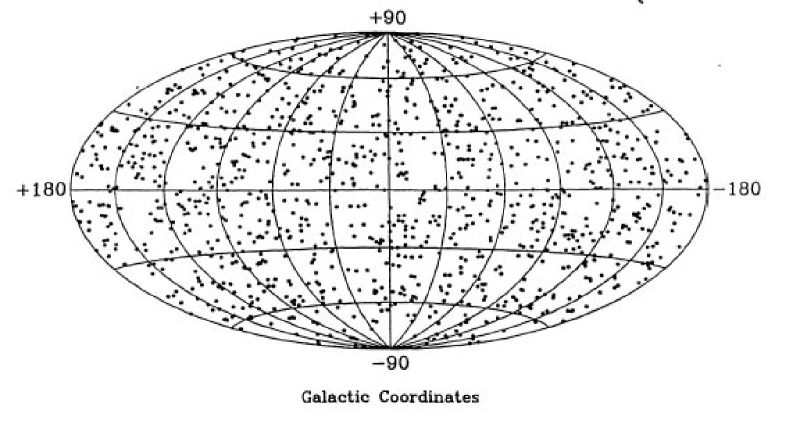
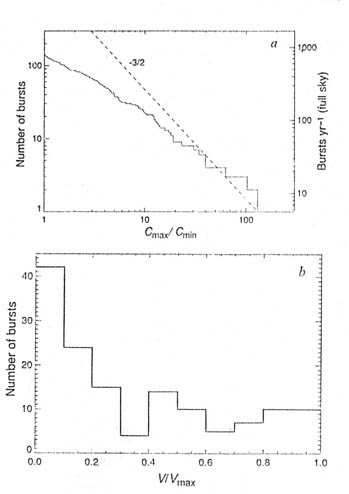
The authors suggested that properties of curve are connected with different selection effects, and the actual density of GRB is almost uniform in space. The account of selection effects in KONUS experiment made in [24] gave the average value ; the value 0.5 corresponds to the pure uniform distribution. KONUS data had been obtained in conditions of constant background. Similar analysis [57] of BATSE data, obtained in conditions of substantially variable background, gave resulting . The statistical analysis of BATSE data [43, 18] is represented in figs.2,3. These two results seems to be in contradiction, because KONUS sensitivity was only 3 times less than that of BATSE, where deviations from the uniform distribution in BATSE data are still rather large [18]. The results of combined BATSE - PVO data are represented in fig.4 from [18]. PVO data where the most luminous GRB are present show good uniformity with a nice slope of .
Detailed statistical analysis and calculation of of BATSE data, divided in 4 classes according to their hardness and calculation of for different classes have been done by M. Schmidt [58]. The results of this investigation are shown in Table 1, where determines the photon spectrum slope, derived from counts of BATSE channels 3 (100-300 keV) and 2 (50-100 keV). The columns ”obs” represent observational data corrected for the effects of statistical errors in the peak counts, and in the ”corr” columns the data had been reanalyzed under suggestion of existence of luminosity-hardness correlation.
| number | ||||
|---|---|---|---|---|
| 348 | ||||
| 348 | ||||
| 347 | ||||
| 348 |
In the cosmological model we may expect smaller value of for softer GRB in the case of a uniform sample, because larger red shifts would correspond to softer spectra. The result is quite opposite, and soft GRB have larger than the hard ones, 0.47 and 0.27 respectively.
=07cm
It is supposed in [58] such a strong excess of luminosity in hard GRB, which overcomes the tendency of the uniform sample. Another explanation in which the soft GRB sample is more complete than the hard one seems to me more preferable.
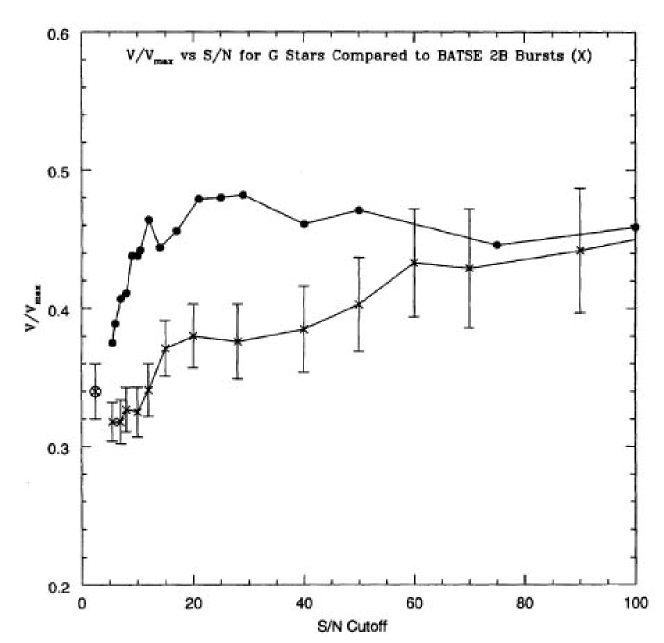
The possibility of decisive role of selection effects (incompleteness of data, statistical errors in estimation of luminosity in presence of the threshold) are illustrated in figs. 5,6. The incompleteness of data influences the distribution of such a well studied stars as solar type G stars, even larger effects are expected for such short transients as GRB. The comparative dependence of the average as a function of a cutoff for G stars and GRB is given in fig.5 [23]. They show a striking qualitative similarity.
=07cm
The influence of statistical errors in presence of the threshold was analyzed in [8]. The curves in presence of statistical errors on the level of average 10 thresholds are represented in fig.6a for the normal distribution of the counts, and in fig.6b for similar distribution of their logarithms. The distribution in fig.6a has a similarity with the BATSE distribution in fig.3.
=06cm
4 Basement of a cosmological GRB origin: optical afterglows and red shifted lines
The -ray afterglows detected by Beppo-SAX gave a possibility of optical identification and obtaining optical spectra. These spectra have shown a strikingly large red shifts , up to 4.5, indicating to the cosmological origin of GRB and their enormous energy outputs. In most cases the red shifts have been measured in the host galaxies which are very faint. The list of red shift measurements is given in the Table 2 from [17]. This table is completed by the trigger number and fluence from 4B catalogue [45], and fluence for the GRB from other references. The spatial position of the optical afterglow sources in the host galaxies can be found in [14].
=06cm
Huge energy output during a short time (0.1 - few 100 seconds) create problems for the cosmological interpretation. In some cases like GRB 990123 the isotropic energy of the burst ( ergs) exceeds the rest mass energy of the Sun. The mechanisms discussed above are able to produce much less that one percent of this amount.
4.1 Collimation
To avoid a huge energy production strong collimation is suggested in the radiation of GRB. In the ”cannon-ball” model [16] the bulk motion Lorentz factor is , leading to collimation factor . Analysis of GRB collimation have been done in [51]. The main restriction to the collimation angle follows from the analysis of the probability of appearance of the orphan optical afterglow, which most probably have low or no collimation. The absence of any variable orphan afterglow in a search poses the following restrictions. It was expected to detect afrerglows, if bursts are isotropic, so the absence of orphan afterglows suggests , which is enough to rule out the most extreme collimation scenarios. At radio wavelengths published source counts and variability studies have been used in [48] to place a limit on the collimation angle, . Because radio afterglows last into the non-relativistic phase of the GRB remnant evolution, the radio afterglows are expected to radiate essentially isotropically, and the orphan afterglow limits on radio immediately imply a limit on itself.
=06.5cm
 \epsfsize=05.5cm

| Trigger | GRB | mag | Redshift | Type a | Fluencee | Ref. |
|---|---|---|---|---|---|---|
| number | erg/cm2 | |||||
| 970228 | 25.2 | 0.695 | e | 10-5 | [27] | |
| 6225 | 970508 | 25.7 | 0.835 | a,e | (3+4) | |
| 6350 | 970828 | 24.5 | 0.9579 | e | [21] | |
| 6533 | 971214 | 25.6 | 3.418 | e | (3+4) | |
| 6659 | 980326 | 29.2 | 1? | (3+4) | ||
| 6665 | 980329 | 27.7 | 3.9 | (b) | (3+4) | |
| 6707 | 980425 c | 14 | 0.0085 | a,e | [19] | |
| 6764 | 980519 | 26.2 | (all 4) | |||
| 980613 | 24.0 | 1.097 | e | [67] | ||
| 6891 | 980703 | 22.6 | 0.966 | a,e | (3+4) | [62] |
| 7281 | 981226 | 24.8 | (3+4) | |||
| 7343 | 990123 | 23.9 | 1.600 | a,e | [34] | |
| 7457 | 990308 d | 28.5 | ||||
| 7549 | 990506 | 24.8 | 1.30 | e | [35] | |
| 7560 | 990510 | 28.5 | 1.619 | a | [36] | |
| 990705 | 22.8 | 0.86 | x | [38] | ||
| 990712 | 21.8 | 0.4331 | a,e | |||
| 991208 | 24.4 | 0.7055 | e | [26] | ||
| 7906 | 991216 | 24.85 | 1.02 | a,x | (3+4) | |
| 7975 | 000131 | 25.7 | 4.50 | b | [28] | |
| 000214 | 0.37–0.47 | x | [47] | |||
| 000301C | 28.0 | 2.0335 | a | [63] | ||
| 000418 | 23.9 | 1.1185 | e | [29] | ||
| 000630 | 26.7 | [30] | ||||
| 000911 | 25.0 | 1.0585 | e | [31] | ||
| 000926 | 23.9 | 2.0369 | a | [32] | ||
| 010222 | 24 | 1.477 | a | brightest of | [49] | |
| BeppoSAX |
Notes:
a e = line emission, a = absorption, b = continuum break, x = x-ray
c Association of this galaxy/SN/GRB is somewhat controversial
d Association of the OT with this GRB may be uncertain
eThe number of BATSE peak channel is indicated in brackets, from [45],
otherwise the estimation of bolometric fluence, and Reference are indicated
4.2 Prompt optical afterglow in GRB 990123
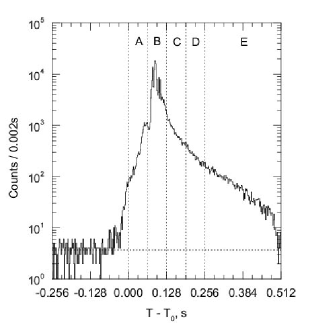
The light curve of the prompt optical afterglow looks similar to that of the main GRB itself. It may be seen in the afterglow of GRB 990123, which was catched by optical observations 22 seconds after the onset of the burst [2, 1]. GRB 990123 was detected by BATSE on 1999 January 23.407594 [34]. The event was strong and consisted of a multi-peaked temporal structure lasting 100 s, with significant spectral evolution. The T50 and T90 durations are 29.82 ( 0.10) s and 63.30 ( 0.26) s, respectively. So, optical emission of this GRB was detected before its maximum in gamma region, and moreover, the gamma ray maximum almost coincides with the optical one. The data from [2], representing unfiltered CCD optical data are given in the Table 3 for 23 January, the last 3 lines give R- magnitude of the transient from [20].
| time | collection time | magnitude |
|---|---|---|
| 9:47:18.3 | 5 secs. | 11.82 |
| 9:47:43.5 | 5 secs. | 8.95 |
| 9:47:08.8 | 5 secs. | 10.08 |
| 9:51:37.5 | 75 secs. | 13.22 |
| 9:54:22.8 | 75 secs. | 14.00 |
| 9:57:08.1 | 75 secs. | 14.53 |
| 13:37:20.3 | 18.70 0.04 | |
| 13:51:03.6 | 18.78 0.04 | |
| 14:02:56.5 | 18.75 0.06 |
That indicates to the structure in which radiation comes almost simultaneously in all energy bands, what is possible in the expanding transparent plasma cloud illuminated by the gamma ray flux. Such model was proposed for a GRB explosion near the neutron star surface in [10], when the galactic origin of GRB was overwhelming. It is quite unclear how to construct a similar model for the cosmological GRB. The observed optical luminosity, related to the red shift reaches ergs/s, what is about 5 orders of magnitude brighter than optical luminosity of any observed supernova.
4.3 Optical afterglows from a re-radiation by the interstellar gas
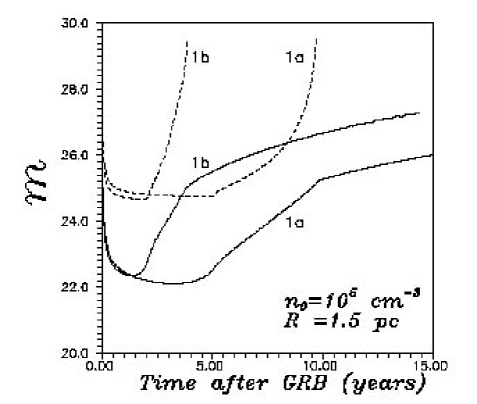
It was shown first in [46], that properties of GRB afterglows are explained better under suggestion that GRB source is situated in a dusty star forming region with a high gas density. Interaction of mighty GRB pulse with the surrounding gas with a density cm-3 create a specific form of the optical afterglow, lasting up to few tens of years. The calculations of light curve and spectrum of such afterglow have been done in [11]. Some results are represented in fig. 7. It is shown, that counterparts of cosmological GRB due to interaction of gamma-radiation with dense interstellar media are ”long-living” objects, existing for years after GRB. To distinguish GRB counterpart from a supernova event, having similar energy output, it is necessary to take into account its unusual light curve and spectrum. In the optical region of the spectrum the strongest emission lines are and . Discovery of even one optical counterpart of GRB with properties described above would give an opportunity to probe the density of the interstellar medium around the burst, and therefore would give an indication of the burst progenitor.
=06cm
5 Correlations
Up to now no correlation had been found between GRB distribution and large scale structure of the universe. This could be connected with a insufficient angular resolution of GRB (few degrees for most events). Combined with the error analysis on the BATSE catalog it is concluded in [61] after using of the 4th (current) BATSE catalog (2494 objects), that nearly GRBs will be needed to make a positive detection of the two-point angular correlation function at this angular scale, if the BATSE catalog is assumed to be a volume-limited sample up to .
Analysis of correlations between red shift, hardness and luminosity have been done in [56]. In all 112 GRBs with both luminosities and red shifts have been used, while most red shifts were derived from the luminosities and the measured peak fluxes.
It was found that the hardness ratio between BATSE channels 3 and 1 do change significantly with luminosity in that the luminous bursts are harder than faint bursts. This correlation is in accordance with the suggestion [58], based on statistical analysis (see Section 3), that there is such a strong excess of luminosity in hard GRB that they are seen from larger red shifts and overcomes the tendency of the uniform Euclidian sample.
No significant correlation between hardness and red shift was found, as might have been expected for cosmological shifting of the peak energy. However, as the low luminosity events must be nearby and the high luminosity events tend to be very distant, the effect from the previous paragraph will approximately offset the cosmological shift resulting in the lack of any apparent correlation [56].
Figure 8 displays the luminosity function, taken as the number of bursts appearing within luminosity bins of width erg/s. The luminosity function appears as a broken power law with the break at erg/s. The dependence above the break is fitted to be scaling as , while it scales as below the break [56].
Comparison of the red shifts and fluences from Table 2 shows no correlation between distance and observed flux. Even in view of large scattering of GRB power it looks rather unusual, and needs considerable skill to explain this property in the cosmological model.
=06cm

6 High-energy afterglow
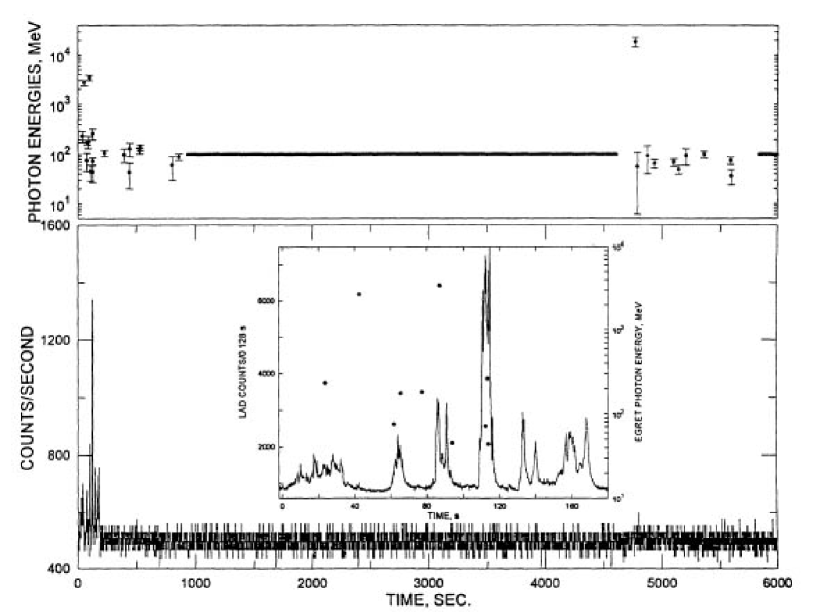
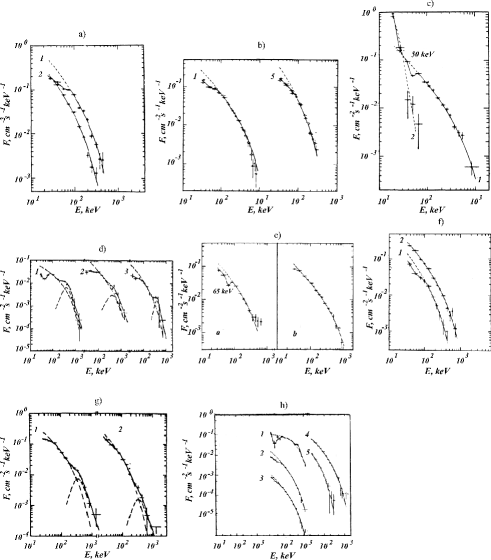
EGRET observations on CGRO have shown that GRB emit also very hard gamma photons up to 20 GeV [18]. The number of GRB with detected hard gamma radiation is about 10, from them 5 bursts with registered photon energies over 100 MeV are given in Table 4 from [59]. Hard gamma emission, as a rule, continues longer than the main (soft) gamma ray burst, up to 1.5 hours in the GRB940217, see fig.9. Comparison of the angular aperture of EGRET and BATSE leads to conclusion that hard gamma radiation could be observed in large fraction (about one half) of all GRB. Spectral slope in hard gamma region varies between (-2) and (-3.7), see Table 4, and varies rapidly, becoming softer with time (GRB920622 in [60]). Data about spectra of hard gamma radiation of radio pulsars in Crab nebula and PSR B1055-52 [44, 65] show similar numbers and variety. With account of non-pulsed Crab spectrum the slope varies between (-1.78) and (-2.75), what is close to GRB spectral slope.
| Burst ID | Max. Energy | Duration | Spectral | Delayed |
|---|---|---|---|---|
| (GeV) | Emission | Function | Emission | |
| GRB910503 | s | X | ||
| GRB910601 | s | X | ||
| GRB930131 | s | X | ||
| GRB940217 | h | X | ||
| GRB940301 | s |
=014cm
7 Hard X-ray lines
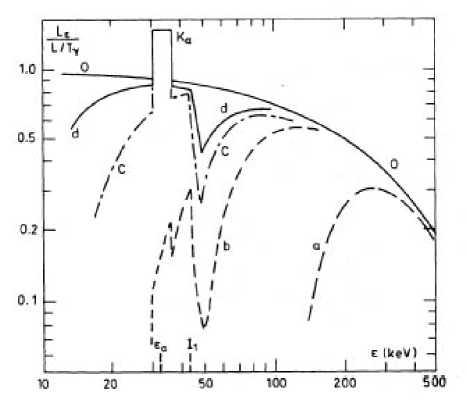
Hard gamma-ray lines in GRB spectra have been discovered by KONUS group [40]. They had been interpreted there as cyclotron lines, and have been seen in 20-30% of the GRB. These spectra had shown a distinct variability: the visible absorption decreases with time, what may be seen in fig. 10. BATSE detectors had lower spectral resolution, and for a some time no spectral features have been found in their data. Later publications appeared where possibility of existence of hard X-ray spectral features in GRB spectra was found (see [15] and references therein). In [15] 13 statistically significant line candidates have been found from 117 GRBs. One of the best cases for detecting a line is GRB 941017 in which the data from two detectors are consistent. In some GRBs the line was found only by one detector, while it was not statistically significant in the other one. The example of this situation for GRB930916 is given in figs. 11,12. The conclusion of this paper is, that until we have a better understanding of these apparent inconsistencies between the data collected from different detectors, the reality of all of the BATSE line candidates is unclear. Note that spectra in figs.11,12 have been obtained 20 s after the trigger, and according to [40] the lines are the strongest at the beginning of the burst. The interpretation of hard spectral feature in the cosmological model [22] was based on the blue-shifted () spectrum of the gas cloud illuminated by the gamma radiation of the fireball. Similar model was suggested in [10] for explanation of the lines observed by KONUS in the model of an explosion near the surface of the neutron star and formation of expanding cloud with , see fig.13, which explained the time evolution of the line strength in fig.10.
=012cm
=06cm


=06cm


=08cm
8 Discussion
The cosmological origin of GRB create many problems for construction of its physically realistic model. The main difficulty is to combine huge energy production during short time and in a small volume. The collimation should help in this situation, but its angle cannot be too small. The investigation of orphan optical bursts by all-sky optical monitoring could be very useful for putting better limits for the collimation. It is very important to obtain prompt optical spectra of the GRB afterglows when the optical counterpart is still luminous, and to investigate the polarization of the optical and X-ray afterglow for clarification of the radiation mechanism.
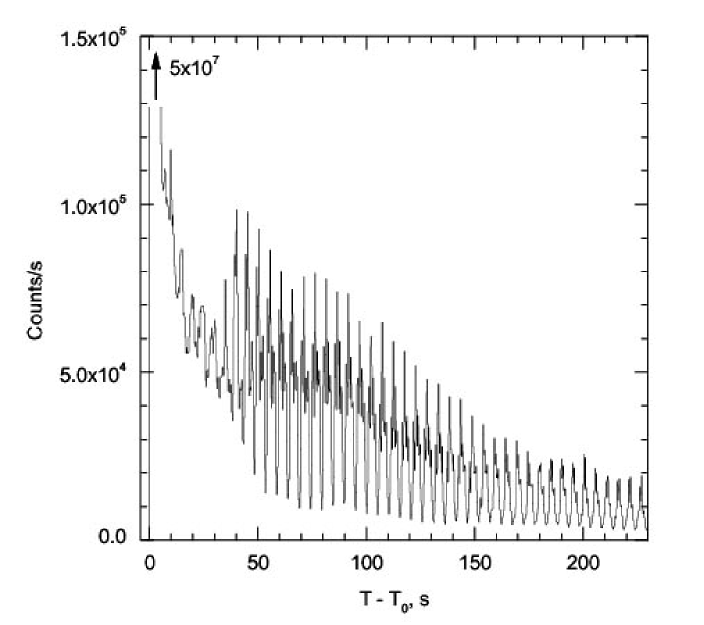
It may happen, that GRB are not a uniform sample of objects, but include phenomena of different origin. The statistical analysis reveals at least two separate samples consisting of long ( s) and short bursts. Note, that optical afterglows and redshift measurements have been done only for long bursts. Therefore, it is not excluded that short bursts have different (may be galactic) origin. It is interesting to compare the properties of short GRB with giant bursts from soft gamma-repeaters (SGR), which are situated inside the Galaxy. From the larger distance, when a usual SGR activity is not visible, only giant bursts would be registered, which without doubts could be attributed to the short GRB. Two giant bursts are given in fig. 14 according to KONUS-WIND observations [41, 42]. The existence of the giant bursts in the SGR (3 in 4 firmly known SGR in the Galaxy and LMC) implies a possibility for observation of these giant bursts, which appear as short GRB, in other neighboring galaxies. The estimation gives more than 10 expected ”short GRB” of this type from M 31 and other close neighbors [9]. The absence of any GRB projecting on the local group galaxies may indicate that SGR are more close and less luminous objects, than it is now accepted [9].
=06cm
Acknowledgements
This work was partially supported by RFBR grant 02-02-16900 and INTAS-ESA grant 120. I am very grateful to Franco Giovannelli and other organizers of the Workshop for support and kind hospitality, and to Olga Toropina for help in preparation of this contribution.
References
- [1] C.W. Akerlof et al. Nature, 398 (1999) 400
- [2] C.W. Akerlof and T.A. McKay (1999) GCN GRB Obs. Rep. 205 (GRB 990123)
- [3] C.W. Akerlof, et al. Nature 398 (1999) 400
- [4] N.V.Ardeljan, G.S. Bisnovatyi-Kogan and S.G. Moiseenko Physics-Uspekhi 40 (1997) 1076
- [5] N.V.Ardeljan, G.S. Bisnovatyi-Kogan and S.G. Moiseenko Astron. Ap. 355 (2000) 1181
- [6] V.S. Berezinsky and O.F. Prilutsky Astron. Ap. 175 (1987) 309
- [7] G.S. Bisnovatyi-Kogan Sov. Astron. 14 (1971) 652
- [8] G.S. Bisnovatyi-Kogan Astron. Ap. 324 (1997) 573
- [9] G.S. Bisnovatyi-Kogan Proc Vulcano99 Workshop: Mem. Soc. Astron. It. 73 (2002) 318
- [10] G.S. Bisnovatyi-Kogan and A.F. Illarionov Astron. Ap. 213 (1989) 107
- [11] G.S. Bisnovatyi-Kogan and A.N.Timokhin Sov. Astron. 41 (1997) 423
- [12] R.D. Blandford and R.L. Znajek MNRAS 179 (1977) 433
- [13] S.I. Blinnikov and K.A. Postnov MNRAS 293 (1998) L29
- [14] J. S. Bloom, S. R. Kulkarni, S. G. Djorgovski astro-ph/0010176 (2000)
- [15] M.S. Briggs et al. astro-ph/9901224 (1999)
- [16] S. Dado, A. Dar and A. De Ru’jula Astron. Ap. 388 (2002) 1079
- [17] S.G. Djorgovski et al. astro-ph/0107535 (2001)
- [18] G.J. Fishman, C.A. Meegan Ann. Rev. Astron. Ap. 33 (1995) 415
- [19] T.J. Galama et al. Nature, 395 (1998) 670
- [20] R.R. Gal et al. (1999) GCN GRB Obs. Rep. 207 (GRB 990123)
- [21] P.J. Groot et al. Astrophys. J. Lett. 493 (1998) L27
- [22] C.J. Hailey, F.A. Harrison, K. Mori Astrophys. J. Lett. 520 (1999) L25
- [23] T.E. Harrison, W.R. Webber, B.J.McNamara Astron. J. 110 (1995) 2216
- [24] J.C. Higdon, M. Schmidt ApJ 355 (1990) 13
- [25] K. Hurley et al. Nature 372 (1994) 652
- [26] K. Hurley et al. (1999) GCN GRB Obs. Rep. 450 (GRB991208)
- [27] K. Hurley et al. Astrophys. J. Lett. 485 (1997) L1
- [28] K. Hurley et al. (2000) GCN GRB Obs. Rep. 529 (GRB000131)
- [29] K. Hurley et al.(2000) GCN GRB Obs. Rep. 642 (GRB000418)
- [30] K. Hurley et al. (2000) GCN GRB Obs. Rep. 736 (GRB000630)
- [31] K. Hurley et al. (2000) GCN GRB Obs. Rep. 791 (GRB000911)
- [32] K. Hurley et al. (2000) GCN GRB Obs. Rep. 802 (GRB000926)
- [33] R.W. Klebesadel, I.B. Strong and R.A. Olson ApJ. 182 (1973) L85
- [34] R. M. Kippen et al. (1999) GCN GRB Obs. Rep. 224 (GRB990123)
- [35] R. M. Kippen et al. (1999) GCN GRB Obs. Rep. 306 (GRB990506)
- [36] R. M. Kippen et al. (1999) GCN GRB Obs. Rep. 322 (GRB990510)
- [37] S. Kulkarni, et al. Nature 398 (1999) 389
- [38] N. Masetti et al. Astron. Ap. 354 (2000) 473
- [39] E.P. Mazets et al. Soviet Astronomy Letters 6 (1980) 318
- [40] E.P. Mazets et al. Astrophys. Space Sci. 82 (1982) 261
- [41] E.P. Mazets et al. Astron. Lett. 25 (1999) 635
- [42] E.P. Mazets et al. Astrophys. J. 519 (1999) L151
- [43] C. Meegan et al. Nature 355 (1992) 143
- [44] R. Much et al. Astron. Ap. Suppl. 120 (1996) 703
- [45] W. S. Paciesas et al. The Fourth BATSE Gamma-Ray Burst Catalog (Revised). On-line Data Catalog: IX/20A. Originally published in ApJ Suppl 122 (1999) 465, 497
- [46] B. Paczynski ApJ 494 (1998) L45
- [47] A. Paolino et al. (2000) GCN GRB Obs. Rep. 557 (GRB000214)
- [48] R. Perna, A. Loeb Ap. J. 509 (1998) L85
- [49] L. Piro (2001) GCN GRB Obs. Rep. 959 (GRB010222)
- [50] O.F. Prilutsky and V.V. Usov Astroph. Sp. Sci. 34 (1975) 387
- [51] J.E. Rhoads astro-ph/0103028 (2001)
- [52] M. Ruffert, H.-Th. Janka Astron. Ap. 338 (1998) 535
- [53] M. Ruffert, H.-Th. Janka Astron. Ap. 344 (1999) 573
- [54] R. Ruffini and J.R. Wilson Physical Review D 12 (1975) 2959
- [55] R. Ruffini et al. Astron. Ap. 359 (2000) 855
- [56] B.E. Schaefer, M. Deng, D.L. Band astro-ph/0101461 (2001)
- [57] M. Schmidt ApJ Lett. 523 (1999) L117
- [58] M. Schmidt astro-ph/0101163 (2001)
- [59] E.J. Schneid et al. Proc. 17 Texas Symp. Ann. NY Acad. Sci. 759 (1995) 421
- [60] E.J. Schneid et al. Astrophys. J. 453 (1995) 95
- [61] S. K. Sethi, S. G. Bhargavi, J. Greiner astro-ph/0001006 (2000)
- [62] D. Smith et al. (1998) GCN GRB Obs. Rep. 126 (GRB980703)
- [63] D. A. Smith et al. (2000) GCN GRB Obs. Rep. 568 (GRB000301C)
- [64] V.V. Sokolov astro-ph/0102492 (2001)
- [65] D.J. Thompson Astrophys. J. 516 (1999) 297
- [66] M.H.P.M. van Putten Physics Reports 345 (2001) 1
- [67] P. Woods, R. M. Kippen et al.(1998) GCN GRB Obs. Rep. 112 (GRB980613)