A large X-ray flare from the Herbig Ae star V892 Tau
We report the XMM-Newton observation of a large X-ray flare from the Herbig Ae star V892 Tau. The apparent low mass companion of V892 Tau, V892 Tau NE, is unresolved by XMM-Newton. Nevertheless there is compelling evidence from combined XMM-Newton and Chandra data that the origin of the flare is the Herbig Ae star V892 Tau. During the flare the X-ray luminosity of V892 Tau increases by a factor of , while the temperature of the plasma increases from keV to keV. From the scaling of the flare event, based on hydrodynamic modeling, we conclude that a 500 G magnetic field is needed in order to confine the plasma. Under the assumptions that a dynamo mechanism is required to generate such a confining magnetic field and that surface convection is a necessary ingredient for a dynamo, our findings provide indirect evidence for the existence of a significant convection zone in the stellar envelope of Herbig Ae stars.
Key Words.:
Stars: flare – Stars: coronae – Stars: formation – Stars: pre-main sequence – Stars: individual: V892 Tau – X-rays: starsggiardin@rssd.esa.int
1 Introduction
Understanding the genesis and early evolution of intermediate mass stars is a fundamental problem in studies of star formation. Owing to the differences in stellar and circumstellar physics, as well as in time scales, the evolution of intermediate pre-main-sequence stars is qualitatively different from that of lower- and higher-mass stars. The past 10 years or so have witnessed an increased interest in the subject, and a key issue is the nature and evolution of Herbig Ae/Be stars. These pre-main-sequence stars, with masses ranging between about 2 and 10 , are the more massive counterparts of T Tauri stars. They share with lower mass T Tauri stars peculiarities such as infrared excess emission, conspicuous (optical and UV) line emission and irregular photometric variability (see Waters & Waelkens 1998 for a review).
According to classical models (Iben 1965), pre-main-sequence stars with masses in excess of 2 are expected to follow fully radiative tracks once the quasi-static contraction has ended. The detection of Herbig Ae/Be stars in X-rays (Zinnecker & Preibisch 1994; Damiani et al. 1994) was therefore somewhat unexpected. Main sequence stars of the same class (from later B to later A stars) do not possess either a strong stellar wind nor a corona (as no magnetic dynamo mechanism is available). In contrast Herbig Ae/Be stars appear to possess a strong stellar wind (Skinner et al. 1993; Bouret et al. 1997) and a magnetic dynamo associated with an outer convection zone has been invoked to explain the periodic variation of the emission lines (Praderie et al. 1986) as well as the stellar wind itself (Finkenzeller & Mundt 1984).
Zinnecker & Preibisch (1994) proposed that the observed X-ray luminosity is linked to the stars’ strong stellar winds, possibly originating in shocks due to wind instabilities and/or in the collision between the fast wind and the remnant circumstellar material. Damiani et al. (1994) also favored a stellar wind origin for the X-ray emission from Herbig Be stars. Nevertheless a magnetically heated corona could also be at the origin of the observed X-ray emission (Zinnecker & Preibisch 1994).
The presence of winds and the possibility of magnetic activity make these objects interesting targets for X-ray studies. The unambiguous detection of flaring activity in any Herbig Ae/Be star would be significant as it would provide indirect but strong evidence for the presence of a magnetically confined corona and thus of an operational dynamo mechanism.
So far there is only one reported observation of flaring activity in an Herbig Be star: Hamaguchi et al. (2000) performed ASCA observations of the Herbig Be star MCW 297, and reported the detection of a large flare during which the X-ray luminosity of the source increased by a factor of 5, with the plasma temperature increasing from 2.7 keV during the quiescent phase to 6.7 keV at flare maximum. The interpretation however is affected by some ambiguity due to the large ASCA point spread function (PSF). Testi et al. (1998) found about 20 infrared sources in the ASCA error circle around MWC 297, the majority of which are likely to be low-mass protostars. The peak X-ray luminosity of erg s-1 reported by Hamaguchi et al. (2000) would correspond to a very large – but still possible – flare for a typical low-mass active T Tauri. For example Tsuboi et al. (1998) have reported ASCA observations of a large flare from the Weak-lined T Tauri star (WTTS) V773 Tau, in which the peak flare luminosity was at least erg s-1. The MWC 297 event therefore would not be exceptional for a low mass pre-main-sequence star. Hamaguchi et al. (2002b) have recently re-observed MWC 297 with Chandra, finding the source hundred times less luminous in X-rays than estimated from ASCA observation, and with no evidence for variability, thus casting some doubts on the original interpretation.
In this article we report the observation of a large X-ray flare from the Herbig Ae star V892 Tau. We have used publicly available XMM-Newton and Chandra data to monitor the X-ray activity of V892 Tau and during one of the two XMM-Newton exposures a large flare is observed. While the apparent companion of V892 Tau, V892 Tau NE, is unresolved by the XMM-Newton PSF, as discussed later, the evidence that the observed flare is coming from the Herbig Ae star is compelling.
The present paper is organized as follow: after a brief introduction of the properties of V892 Tau below, the observations are described in Sect. 2. The spectral and timing analysis of the data are presented in Sect. 3 and the results are discussed in Sec. 4.
1.1 The Herbig Ae star V892 Tau
V892 Tau – also known as Elias 1 – is a young stellar object located in the Taurus dark cloud complex, and is supposed to be the source of the illumination for the faint nebula IC 359. The apparent magnitude of V892 Tau is (Strom & Strom 1994) and its spectral classification varies from B9 (Strom & Strom 1994) and A0 (Elias 1978; Finkenzeller & Mundt 1984) to A6 (Cohen & Kuhi 1979, Berrilli et al. 1992, The et al. 1994). Estimates for the visual extinction also vary from (Elias 1978) and (Strom & Strom 1994, derived from a simultaneous estimate of the spectral type and of the apparent color, ) to (Zinnecker & Preibisch 1994). The star is usually placed at a distance of 140 pc because of its association with the Taurus dark clouds (Elias 1978). The bolometric luminosity of V892 Tau is (Berrilli et al. 1992) and the source is variable in the near-infrared (Elias 1978).
Through near-infrared speckle interferometry Kataza & Maihara (1991) resolved V892 Tau into an unresolved core and a sub-arcsec structure elongated in the east-west direction. They interpret the light of the elongated structure as being reflected within an edge-on circumstellar disk of moderate optical depth. Newer near-infrared speckle interferometry observations were performed by Haas et al. (1997), who favor a scenario in which the diffuse component is due to scattering in bipolar lobes with a polar axis oriented east-west.
V892 Tau appears to be a binary system (Leinert et al. 1997). The apparent stellar companion, hereafter referred to as V892 Tau NE, lies arcsec to the northeast, at position angle 111In the convention adopted by Skinner et al. (1993), position angle is north and position angle is east. (Skinner et al. 1993). The available measurements allow a tentative classification of V892 Tau NE as a WTTS with spectral type M2 reddened by 8–12 mag of visual extinction (Leinert et al. 1997). The study by Leinert et al. (1997), based on speckle interferometry, was carried out with the explicit purpose of detecting binaries among Herbig Ae/Be stars. Leinert et al. (1997) achieved a resolution of arcsec, that at a distance of 140 pc correspond to 14 AU, and they do not detect other stars in the vicinity of V892 Tau. They conclude that in the near-infrared V892 Tau is basically a wide binary system.
2 Observations
The X-ray observations discussed in this paper were obtained with the XMM-Newton and the Chandra observatories. The XMM-Newton observations of V892 Tau consists of two deep (74.4 and 45.1 ks nominal) consecutive exposures, the first starting on March 11 2001 at 12:40:22 UT and the second one starting on March 12 2001 at 10:23:10 UT. All three EPIC cameras were active at the time of the observations, in full-frame mode with the medium filters. The Principal Investigator for these observations is F. Walter and the observation target is the triple WTTS system V410 Tau. The observations are publicly available from the XMM-Newton archive.
The raw XMM-Newton data have been processed by us with the standard SAS V5.4.1 pipeline system, concentrating, for the spectral and timing analysis, on the EPIC-pn camera. In each of the two XMM-Newton exposures the background is affected by a large proton flares of more than 10 ks of duration. We have retained only time intervals in which the count rate for the whole frame of photons above 5 keV was below a certain threshold (3.3 cts/s in the present case). This operation omits roughly 30% of the observing time, but effectively reduces the background level by a factor of . Source and background photons were extracted using a set of scripts purposely developed at Palermo Observatory.
Source and background regions were defined interactively in the ds9 display software, with the background extracted from regions on the same CCD chip and at the same off-axis angle as for the source region. Response matrices (“rmf and arf files”) appropriate for the position and size of the source extraction regions were computed. The spectral analysis has been performed using the XSPEC package, after rebinning the source spectra to a minimum of 20 source counts per (variable width) spectral bin.
The Chandra ACIS observation of V892 Tau was taken starting on March 7 2002 at 6:15:28 UT (18.0 ks nominal). The Principal Investigator for these observations is P. Predehl and also in this case the observation target is V410 Tau222There are other two Chandra exposures of V410 Tau available in the public archive (of 15 and 11 ks respectively). In these observations however V892 Tau is at an extreme off-axis angle, and we have therefore not analysed them.. The data were retrieved from the public data archive, with no re-processing done on the archival data. Source and background regions were defined in ds9, and light curves and spectra were extracted from the cleaned photon list using CIAO V. 2.2.1 threads, which were also used for the generation of the relative response matrices. Spectral analysis was performed in xspec in the same way as for the XMM-Newton spectra.
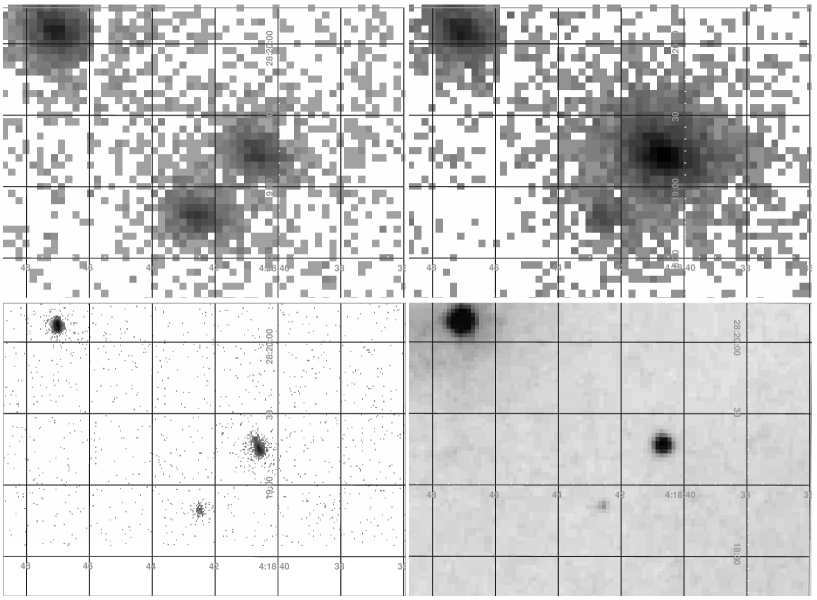
Fig. 1 shows the images of the V892 Tau system in the Chandra ACIS camera and XMM-Newton EPIC-pn camera (before and after the large flare) as well as the Palomar Digital Sky Survey image of the field. The 4 images are on the same sky coordinate scale. The source at the centre of the images is the V892 Tau system. V892 Tau and V892 Tau NE are clearly resolved in the Chandra observations. The XMM-Newton point spread function has a full width at half maximum of arcsec and therefore cannot resolve the system. The source at arcsec to the SE of the V892 Tau system is [BHS98] MHO 11, a T Tauri star (Briceño et al. 1998), first identified in ROSAT data by Strom & Strom (1994). The bright source in the North-East corner is Hubble 4, a well known T Tauri.
In Table 1 we report the coordinates of V892 Tau and V892 Tau NE as derived from the radio (VLA) observation of Skinner et al. (1993), to be compared with the coordinates of the sources in the XMM-Newton and Chandra data. The source coordinates from the EPIC-pn data correspond to the peak of a gaussian distribution fitted to the source image, the source coordinates for the Chandra data simply correspond to the brightest pixel in the source image. The agreement between the sources’ positions in the Chandra image and as determined from VLA observations is excellent (within 0.4 arcsec). The source coordinates derived from the XMM-Newton observations before the flare have a 2.4 arcsec offset from V892 Tau (well within the uncertainty expected for the determination of positions of EPIC X-ray sources) and a 6 arcsec offset from V892 Tau NE. After the flare the position offsets become 3.1 arcsec and 6.8 arcsec from V892 Tau and V892 Tau NE respectively.
| Source | VLA | XMMa | XMMb | Chandra |
| RA(J2000) | RA(J2000) | RA(J2000) | RA(J2000) | |
| Dec(J2000) | Dec(J2000) | Dec(J2000) | Dec(J2000) | |
| V892 Tau | 4 18 40.60 | 4 18 40.67 | 4 18 40.67 | 4 18 40.63 |
| 28 19 15.9 | 28 19 13.7 | 28 19 12.9 | 28 19 15.8 | |
| V892 Tau NE | 4 18 40.70 | c | c | 4 18 40.74 |
| 28 19 19.7 | c | c | 28 19 19.3 |
aX-ray quiescent, bX-ray flaring, cunresolved from V892 Tau.
3 Spectral and timing analysis of V892 Tau and V892 Tau NE
3.1 Chandra observation
The light curves of V892 Tau and V892 Tau NE during the 18 ks Chandra observation of March 2003 are shown in Fig. 2. In the Chandra data, The Herbig Ae star V892 Tau is clearly resolved from the less luminous companion, the WTTS V892 Tau NE.
During the Chandra observation V892 Tau shows significant variability, with its X-ray luminosity varying by a factor of 2 in less than 1 ks. The rise in the source luminosity is impulsive (the source doubles its luminosity in less than 1 ks) and it is followed by a slow decay. A proper time resolved spectral analysis of the rise phase is not possible with the signal to noise ratio of this data set. We have inspected the light curves of the source in a soft band (– keV) and in a hard band(– keV) and see evidence for a hardening of the spectrum during the rise phase. The decay time hr is typical of X-ray stellar flaring events.
The bottom panel of Fig. 2 shows the light curve of V892 Tau NE. The source is weak, on average 8 to 10 times less luminous than V892 Tau. Within the uncertainty of the large error–bars the source does not appear significantly variable. The probability of constancy of V892 Tau NE according to the Kolmogorov-Smirnov test (which measures the maximum deviation of the integral photon arrival times from a constant source model) is 21%.
The ACIS spectra of V892 Tau and V892 Tau NE are shown in Fig. 3. As summarised in Table 3 the spectrum of V892 Tau is well fitted by an absorbed 1-T plasma model with and temperature keV. The metallicity of the plasma is not well constrained by the data. The spectral data for V892 Tau NE have poor signal to noise ratio, nevertheless a fit with an absorbed 1-T plasma model provide a useful estimate of the absorbing column density and the plasma temperature. We derive a value of , which is similar to the value derived for V892 Tau and therefore consistent with the hypothesis that V892 Tau NE is a physical companion of V892 Tau. The derived best-fit value of keV for the plasma temperature of V892 Tau NE is instead significantly different from the value derived for V892 Tau. The model dependent fluxes (as derived from the best-fit models) are erg cm-2 s-1 in the band – keV, and erg cm-2 s-1, in the band – keV, respectively for V892 Tau and V892 Tau NE.


3.2 XMM-Newton observations
The light curve of the V892 Tau system derived from the two consecutive XMM-Newton exposures are shown in Fig. 4. All the gaps in the light curve except the one around 64 ks are due to the filtering process that we have applied to the raw data in order to remove the effect of solar proton flares. In particular roughly 10 ks at the beginning of the first exposure have been removed. The gap around 64 ks is due to the time difference between the end of the first exposure and the start of the second (one hour).
During the first ks the light curve of the V892 Tau-V892 Tau NE system presents significant variability with a time scale and amplitude similar to the one observed for V892 Tau in the Chandra data. During the last 30 ks the light curve of the system undergoes a dramatic variation, in what appears to be a large flare. The source counts increases by a factor of in less than 10 ks. The source flux then remains at around the maximum level until the end of the XMM-Newton exposure.
We have performed the spectral analysis of the two XMM-Newton exposures separately and we summarise the results into two separate tables: Table 2 for the first exposure and Table 3 for the second exposure. The reason for this is that while for the first exposure two temperature plasma models are necessary to obtain acceptable fits to the spectra for the second exposure one-temperature plasma models provide adequate fits to the spectral data.
The spectrum of the V892 Tau system during the first exposure of 74 ks, corresponding to an effective integration time of ks (after the proton flare filtering process), is shown in Fig. 5, together with the best fit absorbed 2 temperature plasma model. The best fit values for the model parameters are summarised in Table 2 together with the reduced of the fit and its null hypothesis probability, . A model with an absorbing column density of cm-2, plasma temperatures keV and keV and a metal abundance provides a good fit to the integrated spectrum. An absorbed one temperature plasma model (as used for the Chandra data, which however have lower statistics) does not provide an acceptable description of the spectrum. Nevertheless a two temperature plasma model with a metal abundance and two plasma temperatures frozen at the values above (, keV and ) provides a good fit to the Chandra data () by letting the two emission measures and the absorbing column density vary – see Table 2. The fitted values for the two emission measures are and , consistent with the values derived from the XMM-Newton spectrum. The relative model flux level is erg cm-2 s-1 (in the – keV band). The value for the absorbing column density derived in this way from the Chandra data, cm-2 is higher than the value derived from XMM-Newton (and a model with the value derived from XMM-Newton does not provide an acceptable description of the data). We note though that a systematically higher value for the absorbing column density derived from Chandra data is consistent with the known presence of (likely carbon-based) contamination on the ACIS chips. This causes additional low-energy absorption (up to 50% near the C edge) not accounted for in the current response matrices (Plucinsky et al. 2003).
Given the source variability during these ks of observation, we have investigated the presence of significant spectral variation. We have subdivided the data into three intervals (the first 30 ks, the following 18 ks and the final 16 ks), chosen to ensure similar statistics in the resulting spectra. As the initial part of the observation is rather heavily contaminated by high background, a higher fraction of it was discarded, and therefore the first interval is significantly longer. The three spectra were modeled with an absorbed two temperature plasma model. The fitted values of the model parameters are summarised in Table 2. As it can be seen by inspecting the table, the short term variability observed in the system V892 Tau during this first XMM-Newton observation does not appear to be associated with significant spectral changes.
A time resolved spectral analysis was also performed for the second XMM-Newton observation of V892 Tau system, when the large flare took place. The data were subdivided into three intervals: a first 14 ks interval while the source is quiescent, a second 8 ks interval while the source counts are rising and the last 10 ks, while the source is at its luminosity maximum333The segment lengths do not add up to 45 ks, because of the gaps in the data due to the filtering out of the solar proton flares.. The three spectra are shown in Fig. 6, and their best-fit parameters are listed in Table 3. As explained at the beginning of this section an absorbed one-temperature plasma model provides an acceptable description for all the three spectra derived from this exposure, so we did not attempted fits with two-temperature plasma models (which were necessary to obtain acceptable fits of the spectra derived from the first XMM-Newton exposure). In addition, the approach to flare modelling that we present in Sect. 4.2.1 relies on single temperature paramaterization of the X-ray spectrum. Nevertheless, for the spectrum derived from the first 14 ks interval of this exposure (corresponding to the quiescent phase), we verified that an absorbed two temperature plasma model with a metal abundance and two plasma temperatures frozen at the values derived from the first XMM-Newton exposure (, keV and ) indeed fits the spectrum (). The value for the absorbing column density derived in this way is cm-2, somewhat higher than the value derived with the one-temperature plasma fit ( cm-2, second line of Table 3), and in better agreement with the value derived from the first XMM-Newton exposure. This confirms the lack of significant spectral variation in the V892 Tau system during the quiescent phase.
As can be seen from Table 3, during the flare the only significant spectral variation occurs in the plasma temperature, while the fitted values for absorbing column density and plasma metallicity remain essentially unchanged. The plasma temperature increases from keV before the flare to during the rising phase and remains around that value afterwards. The model dependent flux density of the source, in the energy band – keV, goes from erg cm-2 s-1 before the flare to erg cm-2 s-1 during the flare maximum. The peak X-ray luminosity for the flare is erg s-1, high but not exceptionally so for stellar X-ray flares.

| Time interval | ||||||||
|---|---|---|---|---|---|---|---|---|
| ks | keV | keV | cm-3 | cm-3 | Z⊙ | |||
| 0–64 (total) | 1.07 | 0.21 | ||||||
| 0–30 | 0.940.10 | 0.980.10 | 2.690.32 | 2.652.16 | 4.461.09 | 0.510.20 | 0.92 | 0.66 |
| 30–48 | 0.890.07 | 1.080.09 | 3.171.26 | 7.424.98 | 3.033.08 | 0.130.09 | 1.14 | 0.15 |
| 48–64 | 0.980.13 | 0.770.08 | 1.950.17 | 3.792.84 | 4.431.11 | 0.310.15 | 1.17 | 0.16 |
| 0–18∗ | 1.240.09 | 1.02 (froz.) | 2.82 (froz.) | 4.31.6 | 2.20.4 | 0.21 (froz.) | 0.88 | 0.72 |
∗Chandra data (total exposure time)
| Source | ||||||
|---|---|---|---|---|---|---|
| keV | cm-3 | Z⊙ | ||||
| V892 Tau (Chandra) | 0.830.08 | 2.100.19 | 4.310.95 | 0.060.07 | 1.04 | 0.40 |
| V892 Tau (XMM 1) | 0.650.06 | 1.530.16 | 5.191.49 | 0.090.05 | 1.33 | 0.06 |
| V892 Tau (XMM 2) | 0.970.05 | 8.111.00 | 21.221.01 | 0.160.09 | 0.90 | 0.79 |
| V892 Tau (XMM 3) | 1.000.04 | 6.680.58 | 26.441.11 | 0.260.08 | 1.01 | 0.46 |
| V892 Tau NE | 1.100.21 | 1.080.22 | 0.780.56 | 0.2 (froz.) | 0.40 | 0.98 |
XMM 1: X-ray quiescent, XMM 2: rising phase of large flare, XMM 3: flare maximum


4 Discussion
During the 18 ks Chandra observation, V892 Tau (which is well resolved from the apparent companion) presents significant variability, with its X-ray flux varying by a factor of 2 in less than 1 ks. This type of variability has never been reported before for a Herbig Ae star. Undoubtedly, though, it is the large variation of luminosity of the V892 Tau system (the large flare) observed with XMM-Newton that is most remarkable. The steep impulsive rise of the source counts by a factor of 10 together with the impulsive rise of the plasma temperature (from 1.5 to 8.1 keV) are all consistent with the interpretation of the observed variation in terms of a large coronal flare.
As already mentioned, V892 Tau and V892 Tau NE are unresolved by the XMM-Newton PSF, nevertheless the evidence that the origin of the observed flare is the Herbig Ae star is compelling. First, as summarised in Table 1, the XMM-Newton position, before and during the flare, of the source associated with system the V892 Tau is between 2.4 and 3.1 arcsec from the radio position of the main star V892 Tau, while is between 6 and 6.8 arcsec off the position of V892 Tau NE. The absolute measurement accuracy of the XMM-Newton pointing is 4 arcsec (XMM-Newton Users’ Handbook), so the offset of the source in the EPIC-pn image from the radio coordinates of V892 Tau is well within 1 of the pointing accuracy. This is fully consistent with V892 Tau being the dominant source of X-ray emission throughout the XMM-Newton observation, as it is the case during the Chandra observation, where V892 Tau is roughly 10 times more luminous than V892 Tau NE.
Second, the XMM-Newton position of the source associated with the system V892 Tau before and during the flare is constant within 0.7 arcsec444The 0.7 arcsec shift of position of the source before and during the flare is to the south, while V892 Tau NE is to the north-north east of V892 Tau. Therefore, although not significant given the arcsec accuracy of XMM-Newton relative pointing error, the position shift is consistent with V892 Tau becoming even stronger in respect with V892 Tau NE., while the angular separation of V892 Tau and V892 Tau NE is 4.1 arcsec. At the same time (as shown in the previous section) the spectral characteristic of the EPIC-pn data on the V892 Tau system while quiescent are in good agreement with the characteristics derived from the spectral data on V892 Tau from Chandra but significantly different from the ones derived from the Chandra spectral data on V892 Tau NE. These two facts strongly indicate that the XMM-Newton data are, for both the quiescent emission and the flare, fully dominated by the emission of V892 Tau. Had the flare been associated with V892 Tau NE, a shift of the X-ray source position during the flare would have been observed.
Finally, if one wanted to explain the XMM-Newton light curves as mostly determined by V892 Tau NE, disregarding the evidence coming from the pointing and spectral information, one would have to require that the source which does not appear significantly variable in the Chandra observation becomes from ten (before the flare) to a hundred times (during the flare) brighter during XMM-Newton observation. This is unlikely.
Given the facts above, we conclude that the XMM-Newton light curve shown in Fig. 4 and the EPIC-pn spectra shown in Fig. 6 and Fig. 5 are determined by the activity of the Herbig Ae star V892 Tau and minimally influenced by the presence of V892 Tau NE. Consequently, below we discuss the XMM-Newton data as originating from V892 Tau and do not further comment on the unresolved presence of V892 Tau NE.
4.1 Quiescent emission
By “quiescent” here we mean the time when V892 Tau is not undergoing the large flare, even though during this phase we do observe smaller flare-like events (both in Chandra and XMM-Newton data).
The Chandra spectrum and the XMM-Newton spectra of V892 Tau while the source is quiescent can all be well described by an absorbed two temperature plasma model with keV, keV and a relative metal abundance of . As discussed above, for the Chandra data a slightly higher value of is required in order to fit the spectrum, consistent with the known contamination of the ACIS chips. Here therefore we only refer to the value for derived from the XMM-Newton data.
The X-ray emission from V892 Tau has been studied previously by Strom & Strom (1994) and Zinnecker & Preibisch (1994). These two works use the same ROSAT observation but derive from it different model parameters. Strom & Strom (1994) fit the spectral data with an absorbed two temperature plasma model with , , and estimate an X-ray luminosity erg s-1 (in the 0.2–2.4 keV band). Zinnecker & Preibisch (1994) model the spectra of V892 Tau with an absorbed 1 temperature plasma with , keV and estimate erg s-1 (a factor of lower than the estimate of Strom & Strom 1994).
We derive , compatible to the estimate of Strom & Strom (1994). This value for the absorbing column density corresponds to a visual extinction555using a conversion factor atoms cm-2 mag-1 (see e.g. Cox 2000). of , which is close to the value estimated by Zinnecker & Preibisch (1994) from the value given in Herbig & Bell (1988) and a factor of lower than derived by Elias (1978) and Strom & Strom (1994)666Strom & Strom (1994) estimate from optical observation. This may explain why their value for the absorbing column density is close to our estimate while their estimate for is a factor of 2 higher.. We note that a lower value of visual extinction is consistent with the star spectral type being A6 rather than B9.
The two temperatures for the two component plasma model that we derive here are significantly higher than the values given by Strom & Strom (1994); this is not unexpected given the much softer (and narrower) bandpass of the ROSAT PSPC instrument used by Strom & Strom (1994). The temperature derived from our 1 plasma component fit to the Chandra data ( keV) is however consistent with plasma temperature estimated by Zinnecker & Preibisch (1994). The values we derived for the two plasma temperatures in V892 Tau are somewhat higher than the typical values derived for the X-ray emission from low mass PMS in Taurus: in an analysis of the spectral characteristic of 9 T Tauri stars in L1551 we found typically and (Favata et al. 2003). On the other hand the value for the plasma metallicity for V892 Tau is typical of the value we derived in the same study for the 4 Weak Lined T Tauri stars in the sample.
The intrinsic luminosity we estimate for V892 Tau in its quiescent state is erg s-1, in good agreement with the value given by Zinnecker & Preibisch (1994) and a factor of lower than derived by Strom & Strom (1994). This indicate that Zinnecker & Preibisch (1994) are probably correct when they suggest that the reason for the discrepancy between their values and the one derived by Strom & Strom (1994) is the fact that Strom & Strom may have erroneously included the nearby source [BHS98] MHO 11 in the source circle of V892 Tau.
A wind-related origin of the X-ray emission has been proposed for Herbig Ae/Be stars by Zinnecker & Preibisch (1994) and Damiani et al. (1994). This scenario, however, seems an unlikely explanation for the origin of the X-ray emission on V892 Tau in its quiescent phase.
As described in Sect. 3, during this phase, V892 Tau presents significant short term variability, with its X-ray flux varying by a factor of 2 in less than 1 ks. The impulsive rise in flux appears to be associated with an hardening of the spectrum in the Chandra data. This type of variability is similar to the one observed in lower-mass pre-main-sequence stars, where the X-ray emission is of coronal origin, while being substantially different from the 20–30% X-ray flux variations observed in OB stars (Collura et al. 1989; Cassinelli et al. 1994) where the emission mechanism is wind-related.
In addition, from the luminosity of V892 Tau estimated to be around (Berrilli et al. 1992), its ratio of X-ray luminosity to the total luminosity while quiescent is . This is two orders of magnitudes greater than the typical ratios found for OB stars. On the other hand a value of is not uncommon for low mass stars in which the X-ray emission mechanism is coronal.
The possibility of a wind related origin of the X-ray emission from V892 Tau in its quiescent phase appears therefore unlikely. This is in agreement with the conclusions reached in the two statistical studies of the properties of Herbig Ae/Be stars of Preibisch & Zinnecker (1996) and Hamaguchi et al. (2002a). These studies indicate that the X-ray emission from Herbig Ae/Be stars is generally associated with higher plasma temperature and higher X-ray to bolometric luminosity ratios than typically observed for the X-ray emission from main sequence OB stars.
A wind scenario, finally, cannot account for the observed flare event of V892 Tau.
4.2 Flare event
During the flare event the X-ray luminosity of V892 Tau increases by a factor of , from erg s-1 to erg s-1, while the temperature of the plasma increases from keV to keV. The source luminosity increases over a relatively long time of ks, and hovers close to the luminosity maximum for at least another 10 ks thereafter – the end of the observation does not unfortunately allow to study the decay phase. As demonstrated by Reale et al. (2002) flares of this type cannot take place in the freely expanding plasmoids of a stellar wind. The observed slow increase of X-ray luminosity at the beginning of the flare event requires the presence of a confining magnetic field.
In order to gain some quantitative insight on the event and given the similarities of the derived light curve with the ones of other stellar flares we have analyzed the event through scaling obtained from detailed hydrodynamic models of flaring plasma confined in a closed coronal loops, as in solar flares.
4.2.1 Flaring region characteristics
It is customary to derive information about the size of the flaring loops from the flare evolution, i.e. the light curve. It has been shown that the decay time of the light curve is linked to the plasma cooling times, which, in turn, depends on the length of the loop which confines the plasma (e.g. Reale 2002 and references therein): the slower the decay, the longer the loop, unless a significant residual heating sustains the decay and makes the decay-time/cooling-time dependence less tight.
The XMM-Newton observation of the flare on V892 Tau does not cover the decay phase and therefore diagnostics using the characteristics decay times are not feasible. For this particular flare, however, we are able to infer some information on the size of the flaring region from the observed rise phase.
The evolution of the flaring plasma confined in a loop is well-known from extensive hydrodynamic loop modeling (e.g. Peres et al. 1982): a strong heating pulse is triggered in an initially quiescent coronal loop and makes the temperature increase by up to several tens of MK along the whole loop in a few seconds, due to the high plasma thermal conduction. The dense chromosphere at the loop footpoints is heated violently and expands upwards with a strong evaporation front. The rising plasma fills up the loop, very dynamically first and then more gradually, approaching a new hydrostatic equilibrium at a very high pressure. The loop X-ray emission increases mostly following the increase of emission measure, and forms the rise phase of the flare.
Although the evolution in the rise phase is very dynamic and non-linear, we can nevertheless derive an approximate time scaling. From the equation of energy conservation of the confined plasma (e.g. Eq.(3) in Serio et al. 1991) it can be seen that, after the very initial seconds, dominated by the plasma kinetics, the evolution in the bulk of the rise phase can be approximately described as a linear increase of the plasma internal energy density driven by the (constant) energy input rate per unit volume:
| (1) |
The pressure increases linearly as well, with a rate . The linear trend goes on until other energetic terms, and in particular the plasma radiative losses, become important in the energy balance. Then the pressure increase slows down to approach asymptotically the equilibrium condition described by the loop scaling laws (Rosner et al. 1978) for a loop with heating volume rate . A constantly linear pressure increase with a rate would imply that the loop reaches the equilibrium pressure in a time .
Detailed hydrodynamic simulations of the flaring loop rising phase have been performed on purpose for the present work. We simulated the evolution of the plasma confined in a coronal loop brought to flare conditions by a strong impulsive heating, as done in previous extensive modeling of solar and stellar coronal flare (Peres et al. 1982, 1987; Reale et al. 1988; Reale & Peres 1995; Betta et al. 1997, 2001). The assumption specific for this work is that of a constant flare heating lasting long enough to let the loop reach equilibrium conditions. The simulations show that the pressure linear increase rate is % slower than . If we also include the slowing of the pressure increase at later times, we obtain that the time taken to reach % of the equilibrium pressure is twice , i.e. . Serio et al. (1991) have shown that is the loop thermodynamic decay time, where is the loop half-length in units of cm and is the plasma maximum temperature in units of K. Therefore, we end up with an expression which links the time taken by the loop to approach the flare equilibrium condition to the loop thermodynamic decay time.
We note that in this flare the rise phase is relatively long ( ks), and the flaring loop may therefore approach equilibrium condition. So, if we set equal to the rise duration time of s, we obtain an estimate for , once is known. In this case 777Briggs & Pye (2003) give the empirical expression linking the temperature obtained from spectral fitting of EPIC data () to the loop maximum temperature (), so that we obtain .
This estimate for the size of the flaring region has been obtained under a few assumptions which deserve some comments. First, we have considered a flare occurring in a single loop. This may not hold true for such an intense and long-lasting flare, which may perhaps be described more properly as a two-ribbon flare, consisting of progressively reconnecting higher and higher loops. Nevertheless, it often occurs in solar two-ribbon flares that the rise phase mostly involves a dominant loop structure, and then gradually extends to others (e.g. Aschwanden & Alexander 2001). We may associate the estimated length to such dominant structure.
Another implicit non-trivial assumption is that of a heating pulse constantly high during the rise phase. Indeed, a gradually increasing heating function may drive the observed gradual rise of the light curve, invalidating the estimations made above. However, in such a case we should observe also a gradual increase of the temperature, while the indications are for a sudden jump of the temperature to the flare value, which is more typical of a heating pulse. We may be therefore quite confident that the total loop length is cm.
If we assume a loop aspect , where is the radius of the loop cross-section, assumed circular and constant along the loop, we obtain a total loop volume cm3; a maximum emission measure of cm-3 then implies a maximum average loop plasma density of cm-3 and a maximum pressure of the order of dyne cm-2. This value is compatible with the equilibrium pressure obtained from loop scaling laws (Rosner et al. 1978) and consistent with the hypothesis of the loop at maximum X-ray luminosity being close to equilibrium conditions. In order to confine a plasma at such a pressure, a magnetic field of more than Gauss is required. The origin of such a field in stars that are thought to be fully or nearly-fully radiative is puzzling.
4.2.2 What is the origin of the magnetic field?
In low-mass stars the presence of a significant convection zone supports the dynamo mechanism that can generate the confining magnetic fields at the origin of the X-ray flare events, but according to classical models, pre-main-sequence star with masses in excess of 2 are expected to follow fully radiative tracks once the quasi-static contraction has ended.
Palla & Stahler (1990) have made the suggestion that the surface activity and winds observed in Harbig Ae/Be may be related to the presence of an outer convection zone. In their interpretation, this convection zone results from the subsurface shell burning of residual deuterium which was accreted during the protostar phase. Nevertheless Palla & Stahler (1993) reconsider their hypothesis, and explain that according to their models the retreat of the proto-star outer convection zone does last a substantial fraction of the pre-main-sequence lifetime of an intermediate mass star. During this retreat, however, the effective temperature remains relatively low, so that the star would not be observed with an A or B spectral type. They conclude that the presence in Herbig Ae/Be stars of surface activity and strong winds is not linked to an outer convection zone, since their model shows that such convection always vanishes with the rising effective temperature.
Recently Siess et al. (2000) have presented calculations of pre-main-sequence evolutionary tracks for low- and intermediate-mass stars. These models predict the existence of a thin convective envelope in young AB stars. In their review, Favata & Micela (2003) suggest that this thin convective envelope, of roughly times the stellar radius, could be at the origin of a low-coronal activity (at the level of the observed minimum for solar type stars) in Altair (A7V) and thus explain the source X-ray luminosity of erg s-1.
According to the same models a star with mass 1.9 , the same metallicity of the Sun and an age of 10 million years, would have a spectral type A6, a luminosity of 12 , not too far from the one of V892 Tau, and a convective envelope of a fraction of 0.0018 its radius. Since the model predicts a stellar radius of cm, the size of the convective region would be cm ( 0.3% ). It is not clear whether such a thin convective envelope, that may be sufficient to generate the low coronal activity invoked to explain the 3 to 4 order of magnitude fainter X-ray emission of a main sequence A star, can sustain the dynamo action necessary to explain the strong X-ray activity of V892 Tau. Indeed, from our flare model we derive a flare loop length of cm. This is comparable to the stellar radius and corresponds to a size of times the thin convective envelope.
An alternative mechanism to sustain the dynamo activity in these predominantly radiative stars has been proposed by Tout & Pringle (1995). They argue that dynamo activity can be sustained in AB stars for a substantial fraction of their pre-main-sequence life time by tapping the initial stellar differential rotation – or shear energy.
5 Conclusions
We have analysed the light curves and spectral data of the system V892 Tau and V892 Tau NE in a Chandra 18 ks exposure and 2 consecutive XMM-Newton exposures of 74 and 45 ks (nominal). In the Chandra data, the Herbig Ae star V892 Tau is well resolved from the low mass later type apparent companion V892 Tau NE. During the Chandra observations V892 Tau shows significant variability, with its X-ray flux varying by a factor of 2 in less than 1 ks. This type of variability is reminiscent of the type of flaring variability observed in lower-mass pre-main-sequence star and has never been reported before for a Herbig Ae star.
During the second XMM-Newton exposure of the system V892 Tau and V892 Tau NE a large flare event takes place. The source luminosity impulsively increases by a factor of 15, from erg s-1 to erg s-1, while the temperature of the plasma increases from keV to keV.
V892 Tau and V892 Tau NE are unresolved by the XMM-Newton PSF, nevertheless the combined XMM-Newton and Chandra data set provide strong evidence that the origin of the observed flare is the Herbig Ae star.
We have modeled the flare event and find that a magnetic field of 500 Gauss in intensity is necessary to confine the plasma which reaches a temperature in excess of 100 MK. The generally accepted mechanism that can sustain confining magnetic fields of this intensity is a dynamo action. Therefore under the assumption that surface convection is a necessary ingredient for a dynamo, our findings imply the presence of a convective envelope in the Herbig Ae star V892 Tau.
Recent models by Siess et al. (2000) indicate that a pre-main-sequence A6 star similar to V892 Tau has a very thin convection zone, extending to a depth of only 0.2% of the stellar radius. Whether this thin convective envelope is sufficient to sustain the dynamo action required to explain the vigorous X-ray activity of this Herbig Ae star remains to be assessed.
Acknowledgements.
This paper is based on observations obtained with XMM-Newton, an ESA science mission with instruments and contributions directly funded by ESA Member States and the USA (NASA). GM and FR acknowledges support by Agenzia Spaziale Italiana and by Ministero della Università e della Ricerca Scientifica e Tecnologica.References
- Aschwanden & Alexander (2001) Aschwanden, M. J. & Alexander, D. 2001, Solar Physics, 204, 91
- Berrilli et al. (1992) Berrilli, F., Corciulo, G., Ingrosso, G., et al. 1992, ApJ, 398, 254
- Betta et al. (1997) Betta, R. M., Peres, G., Serio, S., et al. 1997, A&AS, 122, 585.
- Betta et al. (2001) Betta, R., Peres, G., Reale, F., et al. 2001, A&A, 380, 341.
- Bouret et al. (1997) Bouret, J.-C., Catala, C., & Simon, T. 1997, A&A, 328, 606
- Briceño et al. (1998) Briceño, C., Hartmann, L., Stauffer, J., et al. 1998, AJ, 115, 2074
- Briggs & Pye (2003) Briggs, K. & Pye, J. 2003, MNRAS, in press (astro-ph/0307095)
- Cassinelli et al. (1994) Cassinelli, J. P., Cohen, D. H., Macfarlane, J. J., et al. 1994, ApJ, 421, 705
- Cohen & Kuhi (1979) Cohen, M. & Kuhi, L. V. 1979, ApJS, 41, 743
- Collura et al. (1989) Collura, A., Sciortino, S., Serio, S., et al. 1989, ApJ, 338, 296
- Cox (2000) Cox, A. N., ed. 2000, Allen’s astrophysical quantities (Springer)
- Damiani et al. (1994) Damiani, F., Micela, G., Sciortino, S., et al. 1994, ApJ, 436, 807
- Elias (1978) Elias, J. H. 1978, ApJ, 224, 857
- Favata et al. (2003) Favata, F., Giardino, G., Micela, G., et al. 2003, A&A, 403, 187
- Favata & Micela (2003) Favata, F. & Micela, G. 2003, Space Science Reviews (Kluwer), in press
- Finkenzeller & Mundt (1984) Finkenzeller, U. & Mundt, R. 1984, A&AS, 55, 109
- Haas et al. (1997) Haas, M., Leinert, C., & Richichi, A. 1997, A&A, 326, 1076
- Hamaguchi et al. (2002a) Hamaguchi, K., Koyama, K., Yamauchi, S., et al. 2002a, in F. Favata and J. Drake eds., ASP Conf. Ser. 277: Stellar Coronae in the Chandra and XMM-Newton Era, 193
- Hamaguchi et al. (2000) Hamaguchi, K., Terada, H., Bamba, A., et al. 2000, ApJ, 532, 1111
- Hamaguchi et al. (2002b) Hamaguchi, K., Yamauchi, S., & Koyama, K. 2002b, Bulletin of the American Astronomical Society, 201, 20.13
- Herbig & Bell (1988) Herbig, G. H. & Bell, K. R. 1988, Lick Obs. Bull., 1111, 1
- Iben (1965) Iben, I. J. 1965, ApJ, 141, 993
- Kataza & Maihara (1991) Kataza, H. & Maihara, T. 1991, A&A, 248, L1
- Leinert et al. (1997) Leinert, C., Richichi, A., & Haas, M. 1997, A&A, 318, 472
- Palla & Stahler (1990) Palla, F. & Stahler, S. W. 1990, ApJ, 360, L47
- Palla & Stahler (1993) Palla, F. & Stahler, S. W. 1993, ApJ, 418, 414
- Peres et al. (1982) Peres, G., Serio, S., Vaiana, G. S., et al. 1982, ApJ, 252, 791
- Peres et al. (1987) Peres, G., Reale, F., Serio, S., et al. 1987, ApJ, 312, 895.
- Plucinsky et al. (2003) Plucinsky, P. P., Schulz, N. S., Marshall, H. L., et al. 2003, in Astronomical Telescopes and Instrumentation 2002, ed. S. C. P. J. Truemper & H. Tananbaum, Vol. 4851, 89
- Praderie et al. (1986) Praderie, F., Catala, C., Simon, T., et al. 1986, ApJ, 303, 311
- Preibisch & Zinnecker (1996) Preibisch, T. & Zinnecker, H. 1996, in H. U. Zimmermann, J. Trumper and H. Yorke eds., Roentgenstrahlung from the Universe, MPE Report 263, 17
- Reale et al. (1988) Reale, F., Peres, G., Serio, S., et al. 1988, ApJ, 328, 256.
- Reale & Peres (1995) Reale, F., & Peres, G. 1995, A&A, 299, 225.
- Reale (2002) Reale, F. 2002, in F. Favata and J. Drake eds., ASP Conf. Ser. 277: Stellar Coronae in the Chandra and XMM-Newton Era, 103
- Reale et al. (2002) Reale, F., Bocchino, F., & Peres, G. 2002, A&A, 383, 952
- Rosner et al. (1978) Rosner, R., Tucker, W. H., & Vaiana, G. S. 1978, ApJ, 220, 643
- Serio et al. (1991) Serio, S., Reale, F., Jakimiec, J., Sylwester, B., & Sylwester, J. 1991, A&A, 241, 197
- Siess et al. (2000) Siess, L., Dufour, E., & Forestini, M. 2000, A&A, 358, 593
- Skinner et al. (1993) Skinner, S. L., Brown, A., & Stewart, R. T. 1993, ApJS, 87, 217
- Strom & Strom (1994) Strom, K. M. & Strom, S. E. 1994, ApJ, 424, 237
- Testi et al. (1998) Testi, L., Palla, F., & Natta, A. 1998, A&AS, 133, 81
- The et al. (1994) The, P. S., de Winter, D., & Perez, M. R. 1994, A&AS, 104, 315
- Tout & Pringle (1995) Tout, C. A. & Pringle, J. E. 1995, MNRAS, 272, 528
- Tsuboi et al. (1998) Tsuboi, Y., Koyama, K., Murakami, H., et al. 1998, ApJ, 503, 894
- Waters & Waelkens (1998) Waters, L. B. F. M. & Waelkens, C. 1998, ARA&A, 36, 233
- Zinnecker & Preibisch (1994) Zinnecker, H. & Preibisch, T. 1994, A&A, 292, 152