Multi-wavelength Observations of the Gas-rich Host Galaxy of PDS 456: a New Challenge for the ULIRG-to-QSO Transition Scenario
Abstract
We report new -band, radio continuum, and CO (1–0) imaging observations and 850 m photometric observations of PDS 456, the most luminous QSO in the local universe (). The resolution -band image obtained using the Keck telescope shows three compact () sources at a projected distance of kpc to the southwest, and the host galaxy of PDS 456 may be interacting or merging with one or more companions. The observations using the OVRO millimeter array has revealed a narrow CO (1–0) line (FWHM = 181 km s-1) centered at , and of molecular gas mass is inferred. Radio continuum luminosity is nearly an order of magnitude larger than expected from its FIR luminosity, and the radio source, unresolved by the 2″ beam of the VLA, is dominated by the AGN activity. Our 850 m photometric observations suggest that the cold dust content of the host galaxy is less than one half of the amount in Arp 220.
The analysis of the spectral energy distribution reveals both a QSO-like and a ULIRG-like nature, and the observed IR, X-ray, and gas properties suggest that the AGN activity dominates its luminosity. PDS 456 displays many characteristics expected of an object undergoing a transition from an ultra-luminous infrared galaxy (ULIRG) to a classical QSO phase as proposed by Sanders et al., including an optical spectrum dominated by broad emission lines, large X-ray and IR luminosity, a large cold gas/dust content, and an extremely large ratio (). ULIRGs and IR QSOs form a broad continuous track in the “star formation efficiency” plot in the manner consistent with the ULIRG-QSO transition scenario, relating the evolution in the dust processed luminosity with the available fuel (gas and dust) supply. However, the location of PDS 456 is clearly offset from the apparent track traced by the ULIRGs and IR QSOs on this plot. Therefore, PDS 456 appears to be a rare, exceptional object, and the duration of the physical process governing its present properties must be short compared with the length of the luminous QSO phase.
1 Introduction
The remarkable similarity between cosmic star formation history (e.g. Madau et al., 1996) and quasar evolution (e.g. Shaver et al., 1996) suggests an intriguing possibility of coeval evolution between galaxies and massive black holes in the universe. This is strengthened by the observed correlation between black hole mass and mass of host galaxy’s spheroid component (Magorrian et al., 1998; Ferrarese & Merritt, 2000; Gebhardt et al., 2000). The bulk of star formation and AGN activity in the early universe may have been driven by mergers of massive, dusty, and gas-rich galaxies (see Blain et al., 1999), and the high frequency of submm continuum detections of high redshift optically selected QSOs (about 30%, see Omont et al., 2001; Carilli et al., 2001) also support the coeval formation and evolution scenario.
If the same underlying physical process continues to drive the formation and evolution of massive galaxies and black holes today, then evidence for such activities may still be observable. Citing both starburst and AGN activities along with large molecular gas contents among the most luminous infrared galaxies in the local universe, Sanders et al. (1988a) suggested an evolutionary connection between ultraluminous infrared galaxies (ULIRGs) and QSOs. Possible formation scenarios for supermassive black holes inside ULIRGs have been suggested by several theoretical investigations (Weedman, 1983; Norman & Scoville, 1988; Taniguchi, Ikeuchi, & Shioya, 1999). Ubiquitous presence of one or more luminous active galactic nucleus among ULIRGs has been questioned recently (see Genzel et al., 1998; Tacconi et al., 2002), but nevertheless a close link between the QSO and the ULIRG phenomenon appears to exist and deserves further investigations.
Here, we report a detailed multi-wavelength observational study of PDS 456 (IRAS 172541413), the most luminous QSO in the local universe (), in order to shed further light on the ULIRG-QSO connection. As part of a systematic survey for young stellar objects at Pico dos Dias Observatory, Torres et al. (1997) have obtained an optical spectrum of the 15th magnitude stellar object PDS 456, selected based on its bright IRAS detection ( mJy, mJy). To their surprise, its optical spectrum is dominated by broad emission lines characteristic of a QSO at a redshift of . When corrected for extinction, its absolute B magnitude of is 30% more luminous than 3C 273, the most luminous quasar in the local universe previously known. Because it is located near the Galactic Plane (), confusion is a serious problem at 100 m, and only an upper limit of Jy is offered by the IRAS data. Nevertheless, both and suggest PDS 456 is a warm IRAS source, consistent with the presence of a luminous AGN (see de Grijp et al., 1985; Yun et al., 2001). Its 60 m luminosity alone is , high even among the ultraluminous infrared galaxies in the local universe. Therefore presence of significant amount of molecular gas and associated massive starburst is a strong possibility although not all warm ultraluminous IRAS sources are detected in CO emission (see below).
Given its large bolometric and IR luminosity, PDS 456 represents a particularly important object, potentially representing a critical transition between an ultraluminous infrared galaxy and a bona fide QSO with large optical/UV luminosity and broad emission lines. We have investigated the nature of the host galaxy by obtaining a high resolution image using the Keck telescope in the -band where the QSO-host contrast may be the most favorable for revealing the underlying galaxy. We have also imaged PDS 456 using the VLA in order to locate the non-thermal activity with subarcsecond accuracy and CO (1–0) emission using the OVRO millimeter array in order to determine whether the host galaxy contains a large amount of molecular gas, typical of ULIRGs. Finally, submillimeter continuum measurements have also been obtained using the SCUBA camera on James Clerk Maxwell Telescope (JCMT) in order to constrain the thermal dust spectrum and dust mass. We examine these new observational results in terms of the ULIRG-QSO evolution scenario.
2 Observations
2.1 -band Imaging at the Keck telescope
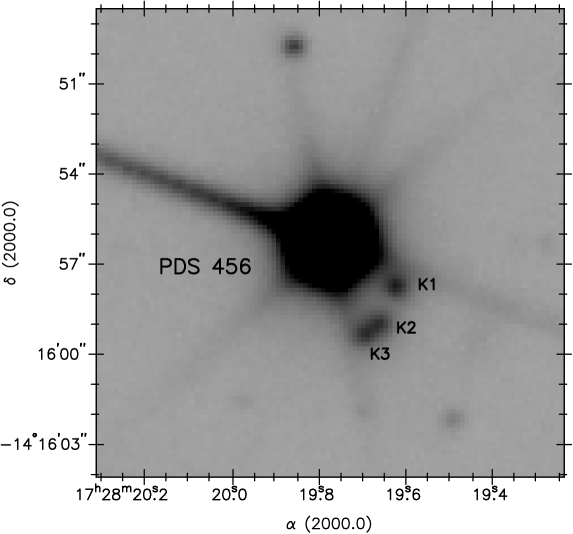
Near infrared observations of PDS 456 were obtained on September 1, 2001 with the Near Infrared Camera (NIRC) on the W. M. Keck telescope (Matthews & Soifer, 1994). Observations were carried out using the filter centered at m with a FWHM of m. The final image was constructed from the 8 dithered images with 30 second exposure time each, for a total exposure of 240 seconds. Seeing was as measured from several point sources in the field. The dithered images were dark-subtracted, flat-fielded, and then combined using the NIRCtools package written by D. Thompson and run using the Image Reduction and Analysis Facility (IRAF).111 IRAF is written and supported by the IRAF programming group at the National Optical Astronomy Observatories (NOAO) in Tucson, Arizona. NOAO is operated by the Association of Universities for Research in Astronomy (AURA), Inc. under cooperative agreement with the National Science Foundation. The fractional offsets used to combine the images were determined from the IRAF task IMALIGN which centroids on several point sources in the field common to all of the images. The resulting rotated -band image is shown in Figure 1.
2.2 8.5 GHz and 1.2 GHz Imaging at the VLA
Radio continuum image of PDS 456 at 8.5 GHz (3.6 cm) wavelength was obtained using the Very Large Array (VLA)222The National Radio Astronomy Observatory is a facility of the National Science Foundation operated under cooperative agreement by Associated Universities, Inc. in Socorro, NM, on January 13, 1998. The observations were made in the D-configuration using 14 antennas in the continuum mode with 100 MHz total bandwidth. The nearby quasar 1730130 was observed periodically to track the instrumental gain, and 3C 286 was used for absolute flux calibration. The data were calibrated and imaged following the standard procedure within the NRAO AIPS software system. The naturally weighted image has an rms noise of Jy. PDS 456 is detected with a peak flux density of mJy ( W Hz-1)333The quoted uncertainty in the flux density reflects the 20% uncertainty in the transfer of the absolute flux scaling., unresolved by the synthesized beam of (PA=) in size.
Radio continuum image of PDS 456 at 1.2 GHz (25 cm) wavelength were obtained using the VLA on July 16, 1999. The observations were made in the A-configuration using 27 antennas in the spectral line mode with 6.25 MHz total bandwidth. The nearby quasar 1730130 was observed periodically to track the instrumental gain, and 3C 286 was used for absolute flux calibration. The naturally weighted image has an rms noise of mJy. PDS 456 is detected with a peak flux density of mJy ( W Hz-1), unresolved by the synthesized beam of (PA=) in size. The best astrometric position of PDS 456 is derived from this image, which is and with an uncertainty of less than .
2.3 CO (1–0) Imaging at OVRO
Aperture synthesis CO (1–0) observations of PDS 456 were carried out using the Owens Valley Millimeter Array between April 2000 and May 2001. There are six 10.4 m diameter telescopes in the array, providing a field of view of about (FWHM) at 100 GHz. The telescopes are equipped with SIS receivers cooled to 4 K, and typical single sideband system temperatures () were between 250 and 350 K. Baselines of 15-115 m E-W and 15-115 m N-S were used. The total on-source integration time was about 28 hours.
The redshifted CO (1–0) line at occurs at 97.3574 GHz. A digital correlator configured with MHz channels (12 km s-1) covered a total velocity range of 1440 km s-1. By tuning the receivers to this frequency, the spectrometer covers the redshift range of . The nearby quasar 1730130 was observed at 20 minute intervals to track the phase and short term instrument gain. Uranus ( K), Neptune ( K), 3C 273, and 3C 454.3 were observed for the absolute flux calibration. The data were calibrated using the standard Owens Valley array program MMA (Scoville et al., 1992) and were mapped and analyzed using the imaging program DIFMAP (Shepherd et al., 1994) and the NRAO AIPS software system. The uncertainty in absolute flux calibration is about 20%, mainly due to the uncertainty in transferring the calibration between the source and the flux calibrators. The positional accuracy of the resulting maps is better than .
2.4 850 m Photometry
The 850 m photometry observations were conducted on October 26 & 29, 2002, using the submillimeter camera SCUBA on the James Clerk Maxwell Telescope (JCMT) in a photometry mode. The 225 GHz zenith opacity was 0.1 and 0.06, respectively, on those days, and high temporal resolution measurements from the JCMT line-of-sight water-vapor radiometer were used to correct for the opacity variations. The flux calibration was done using Uranus. Due to the early times in the night, the atmosphere was somewhat unstable. This was compounded by the low elevation () of the source at the time of the observations. The sensitivity achieved is about 2.5 mJy () after a total of 2 hours of integration. The data does not reveal any positive emission above the noise level, but the 3 upper limit of 7.5 mJy at 850 m provides a useful constraint on the dust continuum spectrum and the amount of cold dust associated with the host galaxy of PDS 456.
3 Results
3.1 -band Image
The final co-added -band image of PDS 456 is shown in Figure 1. The point-like QSO and the point spread function (PSF) of the telescope dominates the image, and three compact sources lying about to the southwest of the QSO are seen (named K1, K2, and K3). We performed aperture photometry on the QSO as well as the three compact components, and the results are summarized in Table 1. Photometric zero-points are determined using separate observations of several standard stars observed at varying airmass throughout the night. Aperture corrections were made for the , , and pixel radius aperture for K1, K2+K3, and the QSO, respectively. We derive -band magnitude of for the QSO. After subtracting the wings of the QSO, we derive a -band magnitude of for K1. K2 and K3 are approximately equal in brightness, and the combined -band magnitude is . The near-IR photometry for the QSO reported by the Two Micron All Sky Survey (2MASS: Skrutskie et al., 1997) is , , and (see Table Multi-wavelength Observations of the Gas-rich Host Galaxy of PDS 456: a New Challenge for the ULIRG-to-QSO Transition Scenario), in an excellent agreement with our measurement. The absolute astrometry for the -band image is good to only about 1″, and the astrometric information is improved by replacing the the -band QSO centroid position with the radio centroid position (§ 2.2).
The whole co-added -band image is about 50″ by 50″ in size and includes about 90 sources brighter than . The integrated source count is shown in Figure 2. The number density of sources brighter than is about 10 per square arcminute, and this corresponds to about objects per square degree, which is nearly two orders of magnitudes higher than the -band galaxy count in the field (e.g., see Fig. 2 by Djorgovski et al., 1995). A natural explanation for the elevated source count is that PDS 456 is located in the direction of Galactic Center, near the Galactic Plane, at and . Therefore foreground stars likely account for most of the sources found in the -band image.
The three compact features K1, K2, and K3 found adjacent to the QSO are very likely physically associated with PDS 456, and the host galaxy may have undergone a tidal interaction or a merger recently. For km s-1 Mpc-1, , and , angular distance for PDS 456 at is 595 Mpc, and the angular separation of 3″ corresponds to a projected distance of 9 kpc, which is the natural size scale for the underlying host galaxy or companions. The source count shown in Figure 2 suggests that the probability of a random source falling within a 3″ radius of any given position is less than 1%. The likelihood of a chance projection for three random sources of this magnitude within 3″ of PDS 456 is less than . Therefore, a random occurrence of three foreground or background sources near the position of PDS 456 is extremely unlikely. If they are at the same distance as PDS 456, their -band absolute magnitude () ranges between and , which is about 4 magnitudes fainter than that of an galaxy. Attempts to subtract the QSO image using the PSF derived from calibration stars were not successful in revealing any underlying structures within kpc of the QSO (). An L∗ stellar host may be present underneath the QSO image, but it cannot be determined by our present data.
A faint extension to the southwest of the QSO is also visible even in the Digitized Sky Survey and 2MASS plate images. This feature is not clearly resolved by these low resolution images, however, and little else can be learned from them. In an unpublished -band image obtained with the Pico dos Dias Observatory 1.6 m telescope in 1999 by F. Jablonski under a good seeing condition, sources K1 and K2+K3 appear clearly resolved, and the K1 source, which appears extended toward the QSO, has a -band magnitude of while the combined brightness of K2+K3 is (F. Jabloski & C. Torres 2003, private communication). The colors of K1 and K2+K3, and respectively, are somewhat redder than the ensemble average color of 2MASS galaxies, , but they are consistent with that of a stellar system located at the redshift of the QSO when the foreground extinction (see § 4.2) and the -correction are taken into account. In an imaging survey of 20 nearby luminous QSOs at using the HST, Bahcall et al. (1997) reported finding eight companion galaxies with -band magnitude within 4 magnitudes of at projected distances less than 10 kpc. Other HST imaging studies have also reported a high frequency of tidal tails and close companions associated with the nearby luminous QSOs (McLeod & McLeod, 2001; Dunlop et al., 2003). Therefore finding compact stellar systems surrounding PDS 456 itself is not unusual, but the large number and the asymmetric distribution are curious. The asymmetry and the clumpy appearances are similar to the features seen around 3C 273 (Martel et al., 2003) and PKS 2349014 (Bahcall et al., 1997; McLure et al., 1999), and therefore these stellar clumps are also likely the remnants of a recent accretion or a merger event. A definitive characterization of the nature of these clumps will require a more sensitive higher angular resolution imaging using the HST.
3.2 CO (1–0) and 100 GHz Continuum
The CO (1–0) channel maps of PDS 456 are shown in Figure 3. The naturally weighted image has a synthesized beam of about (PA=). Emission features brighter than 6 mJy beam-1 (4) are seen within 3″ of the QSO position marked with a cross at channels corresponding to 97.269 GHz and 97.301 GHz. The CO (1–0) spectrum obtained at the QSO position after smoothing to the 16 MHz (49 km s-1) and 64 MHz (197 km s-1) resolution is shown in Figure 4. The thick solid curve is a model Gaussian line profile with MHz (77 km s-1; FWHM = 181 km s-1) centered at 97.283 GHz (). The velocity integrated line flux is Jy km s-1. At a luminosity distance of 834 Mpc, this translates to a H2 mass of using the standard conversion factor derived from the Galactic molecular clouds (see Young & Scoville, 1991). This derived H2 mass is on the high end of the mass range found for PG QSOs (1-10, Evans et al., 2001; Scoville et al., 2003) and is only slightly less than those of ULIRGs (2-5 using the same conversion, e.g. Solomon et al., 1997).
The spatial resolution of the CO data is about 21 kpc 15 kpc, and the CO emitting structure is not expected to be substantially resolved. However, the centroids of the brightest CO peaks in the two channel maps shown in Figure 3 are offset from each other by about 2″ (6 kpc). Given the low S/N of the data, this displacement of the peak positions may not be very significant. On the other hand, the displacement of the blueshifted CO peak is in the direction of the two -band sources K2 & K3 (see Fig. 1). These two -band sources are likely associated with the host of the QSO (see § 3.1), and this apparent alignment with the CO displacement, perhaps fortuitous, adds to the possibility that the molecular gas associated with PDS 456 may be extended over 5-10 kpc scales.
The data from the image sideband of the OVRO receivers are also cross-correlated to produce continuum visibility data centered at 100.3574 GHz. The 100 GHz continuum image obtained from these visibility data has an rms noise of 0.2 mJy beam-1, and no statistically significant source is found with the field of view of the interferometer. From this we can place an upper limit of 0.6 mJy () for the QSO continuum flux density at 100 GHz. The continuum spectral energy distribution of PDS 456 is discussed in greater detail below.
4 Discussions
4.1 Spectral Energy Distribution of PDS 456
The spectral energy distribution (SED) holds information on the temperature and the physical processes involved, even when the angular resolution of the observations are insufficient to yield any structural information. In examining the ULIRG-QSO connection, a comparison of the SEDs is particularly useful since the underlying physical processes and host galaxy properties can be directly compared.
The SED of PDS 456, shown with large squares in Figure 5, nicely demonstrates its QSO-like and ULIRG-like nature. The SEDs of the previously most luminous QSO 3C 273 (), an IR luminous radio-quiet QSO I Zw 1 (), and the prototypical ULIRG Arp 220 () are shown after redshifting their continuum spectra to for a direct comparison. The SED data for PDS 456 are also tabulated in Table Multi-wavelength Observations of the Gas-rich Host Galaxy of PDS 456: a New Challenge for the ULIRG-to-QSO Transition Scenario. The SED data for 3C 273, I Zw 1, and Arp 220 come from the NASA Extragalactic Database (NED) and literature. The SEDs of PDS 456 and 3C 273 are remarkably similar and are essentially identical between the far-IR (FIR) and optical wavelengths. When corrected for extinction of , the bolometric luminosity of PDS 456 becomes about 30% larger than that of 3C 273 (Torres et al., 1997; Simpson et al., 1999). Identified as one of the “warm ULIRGs” that are possibly in transition from galaxy to quasar by Sanders et al. (1988b), 3C 273 has both thermal and non-thermal emission mechanisms contributing to its SED (see Courvoisier, 1998). The SEDs at radio wavelengths differ by more than 3 orders of magnitude, reflecting the presence of a beamed radio jet in 3C 273. This part of the SED contributes little to the total luminosity, however.
The SED of PDS 456 covering the far-IR through radio wavelengths is modeled using the dusty starburst SED model by Yun & Carilli (2002) and is shown using a solid curve in Figure 5. As in QSOs 3C 273 and I Zw 1, non-thermal emission from the AGN dominates the short wavelength () part of the SED in PDS 456, but dust reprocessed AGN emission and light from young stars should account for the dust peak from millimeter to FIR wavelengths (e.g. Rowan-Robinson, 1995). There are no continuum detections of PDS 456, only upper limits, between 100 GHz (3000 m) and 2000 GHz (150 m), and therefore there is only limited information to constrain the cold gas content and cold dust properties. The turnover in the FIR dust peak occurs at a much higher frequency, near 6000 GHz (50 m), implying the dust temperature is on average much higher than that in Arp 220 ( K, Scoville et al., 1991; Yun & Carilli, 2002). The model SED shown in Figure 5 is chosen to match the 100 m measurement by Reeves et al. (2000) and has dust temperature of 120 K in its rest frame. This means a substantial amount of dust in the host galaxy of PDS 456 is exposed to a significantly higher mean radiation field and to the high energy photons originating from the AGN. The total dust mass derived from the existing SED data, assuming K and emissivity , is (using Eq. 3 of Yun & Scoville, 1998). Both the dust mass and temperature are well within the range of dust properties derived for a large sample of Palomar-Green (PG) QSOs by Haas et al. (2000, ). The effective diameter for the emitting area is about 135 pc (using Eq. 4 of Yun & Carilli, 2002), which is similar in size to the nuclear starburst region in Arp 220 (Scoville, Yun, & Bryant, 1997; Sakamoto et al., 1999). The strong mid-IR emission from PDS 456 and 3C 273 are indicative of abundant warm and hot dust (a few hundred to 1000 K), and this is a clear indication of an energetic AGN in these objects (see Figure 10 of Yun et al., 2001). The measured radio continuum flux density of PDS 456 is 8 times larger than what is expected from a starburst system with the same FIR luminosity, and this is a clear indication that a radio AGN is also present in PDS 456.
The total dust mass of PDS 456 could be potentially much larger if substantial amount of cold ( 10-40 K) dust is present. The best constraint on the cold dust content come from our new 850m measurement made using the SCUBA camera on JCMT. As shown in Figure 5, the dust continuum emission from Arp 220 should have been detected by our observation with S/N . The upper limit at 850 m shown here suggests that the total cold dust mass of PDS 456 is less than one half of the amount in Arp 220 ( K). The model SED for PDS 456 shown in Figure 5 is consistent with that of the composite starburst+QSO system I Zw 1 with estimated cold dust mass of (Hughes et al., 1993; Haas et al., 1998; Andreani, Franceschini, & Granato, 1999). More sensitive submillimeter continuum measurements are needed to constrain the total dust mass in PDS 456.
A useful insight into the AGN contribution to the observed FIR and bolometric luminosity can be obtained by examining its hard X-ray luminosity. The best-fit model spectrum for the BeppoSAX measurements yields an intrinsic 2-10 keV luminosity of about erg s-1 (Vignali et al., 2000, after correcting for ), which is about 10% of its total FIR luminosity, . If the AGN activity should account for a substantial fraction of its FIR and bolometric luminosity, one would expect the X-ray luminosity of the AGN to be comparable or larger than the FIR luminosity. While the intrinsic 2-10 keV luminosity does not account for the entire FIR luminosity, this fraction is quite substantial, similar to other IR bright, optically selected QSOs and Seyfert 1 AGNs and and 2-3 orders of magnitudes larger than most ULIRGs and composite starburst+AGN systems (see Figure 6; also Risaliti et al., 2000; Levenson, Weaver, & Heckman, 2001). PDS 456 stands out even among the FIR bright QSOs as its ratio is an order of magnitude larger than that of IR luminous QSOs Mrk 1014 and I Zw 1 and two orders of magnitudes larger than that of a prototypical ULIRG/QSO system Mrk 231. Therefore, the hard X-ray properties of PDS 456 is much closer to optically selected luminous QSOs, and it can be strongly argued that the bolometric luminosity of PDS 456 is dominated by the AGN activity.
4.2 Geometry of the Circum-AGN Disk
Most of the warm dust responsible for the mid- and far-IR emission modeled in Figure 5 has to be located within a rotationally supported circum-AGN disk surrounding the central AGN in order to achieve the observed high mean temperature. A lower limit to the dynamical mass of the gas/dust disk surrounding the optical QSO in PDS 456 can be estimated using the FIR source size derived in § 4.1 and the gas rotation speed derived from the CO line width in Figure 4. Assuming the gas is in a circular rotation with rotation speed of km s-1 at a radius of 70 pc, the resulting dynamical mass is
This is far smaller than the gas mass inferred from the CO luminosity, (see § 3.2), unless the gas disk is viewed nearly face-on with an inclination angle smaller than . The CO-to-H2 conversion factor is thought to be 2-3 times smaller than the standard Galactic value for the warm, dense clouds in circum-nuclear regions (Scoville, Yun, & Bryant, 1997; Downes & Solomon, 1998) while both and are only known to a factor of two or so. However, these factors alone cannot fully account for the difference between the inferred molecular gas mass and the dynamical mass.
The simple fact that the optical QSO is readily visible requires the line-of-sight to the QSO be mostly free of any obscuring material, and this also favors a face-on geometry for the circum-AGN disk. A similar inference on the face-on nature and the resolution of the apparent discrepancy between the derived gas mass and the dynamical mass for gas disks within ULIRGs hosting an optical QSO (e.g. Mrk 231) has been made previously (Bryant & Scoville, 1996; Downes & Solomon, 1998). Since PDS 456 is seen through the Galactic plane, some foreground extinction is naturally expected, and the spectral slope between the near-IR and optical wavelengths is indeed steeper than expected. The analysis of the optical and near-IR colors, continuum spectral shape, and the Balmer line ratios all consistently suggests reddening of the QSO light by (see Torres et al., 1997; Simpson et al., 1999). Torres et al. further estimate that the reddening due to the Galactic foreground derived from the extinction map of Burstein & Heiles (1982) and from the diffuse interstellar bands and Na D1 line in their spectra also suggest a foreground reddening of , accounting for all of the reddening associated with the QSO light. The only result that contradicts this conclusion is the analysis of the X-ray spectrum that requires a highly ionized absorber with cm-2 and an additional cold absorber with cm-2 (Vignali et al., 2000). However, this inference is highly model dependent.
The CO emission from PDS 456 may instead arise primarily from the cold gas and dust yet undetected in continuum, rather than from the circum-AGN disk traced in IR in Figure 5. The channel maps shown in Figure 3 suggests that the CO emitting region may be extended over a region 10 kpc in extent (see § 3.2). Even with the physical extent of 5-10 kpc for the CO emitting region, the dynamical mass is still smaller than the H2 mass inferred from the CO luminosity unless the inclination of the disk is more face-on ().
While the face-on geometry for the dust and gas disks in PDS 456 and Mrk 231 seems quite secure, a surprising result is that a general inference of a face-on geometry for nuclear gas disks in other QSO host systems is not supported by the observed distribution CO line widths. As demonstrated by the discussion above, the face-on geometry requirement arises mainly from the small observed line widths in the dynamical mass calculation. However, when the histograms of observed CO line widths are compared between QSO hosts and ULIRGs as shown in Figure 7, QSO hosts show comparable CO line widths as ULIRGs. The median CO line width for ULIRGs is larger ( km s-1) than that of QSO hosts ( km s-1), consistent with the general expectation, but the difference is much smaller than expected from the viewing geometry consideration alone. Furthermore, the CO line widths observed in three out of nine QSO hosts are larger than 350 km s-1 (FWHM), too large to be consistent with a face-on geometry. One solution to this general problem is that the parsec scale circum-AGN disk that dictates the viewing angle of the central source is not aligned with the extended gas/dust disk or ring traced in CO. Since only a few of these objects have been imaged in CO or in dust continuum with sub-kpc resolution, the possibility of optical AGNs viewed through gaps in a large scale gas/dust ring or disk at an arbitrary inclination angle or through a highly warped disk cannot be ruled out. Therefore, Figure 7 cautions strongly against the common assumption of a face-on geometry for gas and dust distribution around optically visible QSOs.,
4.3 Dusty QSO hosts and ULIRGs
In the ULIRG-to-QSO evolutionary scenario proposed by Sanders et al. (1988a), an ultraluminous infrared galaxy is thought to go through a warm IR source phase as observed in PDS 456 today with large IR luminosity, warm IR color, a large molecular gas content, and a dust enshrouded luminous AGN. In accordance with this scenario, a large number of optically selected PG quasars that are also detected by IRAS have been studied in detail and are found to contain large amounts of molecular gas (Alloin et al., 1992; Evans et al., 2001; Scoville et al., 2003). Similarly, the majority of warm ULIRGs are also shown to be composite objects hosting one or more luminous AGNs and an active starburst fueled by the large molecular gas content in their nuclear regions (Sanders et al., 1988b).
IR luminosity and total gas/dust mass are the two key variables characterizing the ULIRG-QSO evolution. Specifically, the transition from a ULIRG to a QSO is driven by rapid conversion of gas into stars and/or the subsequent growth of a massive black hole, followed by the dispersion of gas and dust surrounding these activities. Therefore such an evolution scenario should follow a distinct track in the plot between IR luminosity and the total gas mass. In particular, a dusty QSO emerging from a ULIRG phase should show the characteristic large FIR luminosity and rapidly diminishing gas content, distinguishable from ULIRGs. If the IR-bright QSO PDS 456 is such a transition object, then it should appear in the bridging region between the areas occupied by ULIRGs and by QSOs.
To scrutinize the ULIRG-QSO evolutionary scenario further, optically selected IR QSOs, including PDS 456, are compared with ULIRGs and luminous IR galaxies (LIRGs) in a plot of FIR luminosity () versus CO luminosity (), which can be translated into a total molecular gas mass () using the standard conversion relation (see Young & Scoville, 1991). This plot shown in Figure 8 is commonly referred to as the “star formation efficiency (SFE)” plot because historically it is used to demonstrate that IR-bright starburst systems are not only forming stars at high rates but also with a greater efficiency, producing 1-2 orders of magnitudes more luminosity (thus more massive stars) per solar mass of molecular gas. A constant ratio of is an upper bound to what is expected if massive star formation is primarily responsible for the FIR luminosity (see Scoville & Soifer, 1991), and this plot can also offer a glimpse on whether the dust obscured powering source is massive stars or has to be a dust enshrouded AGN. Among the 14 optically selected QSOs with measured molecular gas contents (shown in filled circles), only Mrk 1014 is found in the area of high FIR luminosity and a large molecular gas mass occupied by ULIRGs (empty circles). The remaining 13 QSOs fall near the line which is characteristic of less luminous IR starbursts (crosses; Sanders et al., 1991). This comparison suggests that optically selected QSOs are distinct from the ULIRG population in general, even when their host galaxies are fairly rich in molecular gas ().
The location of PDS 456 is distinct from most ULIRGs, less luminous IR starbursts, and even other optically selected QSOs in Figure 8. The uncertainty associated with the data points plotted in Figure 8 is typically about 20%, and the size of the error bars should be comparable or smaller than the size of the symbols used. Therefore the observed scatter in this plot reflects substantial variations in the underlying physical processes (see below), far in excess of the measurement uncertainties. PDS 456 has about 5 times more FIR luminosity than other IR detected PG QSOs and LIRGs with comparable CO luminosity (molecular gas mass). In fact, it is one of the objects showing the most extreme () ratio, and such a high ratio is reasonably expected if a large fraction of the FIR luminosity arises from the ionizing radiation originating from the AGN. Another noteworthy object with a similarly extreme ratio is IRAS 08572+3915, which is a well-known warm ULIRG ( and ) with a Seyfert/LINER optical spectrum and shows IR-excess (see Sanders et al., 1988b; Veilleux et al., 1995; Yun et al., 2001). From the near-IR and mid-IR imaging and spectroscopy, Dudley & Wynn-Williams (1997), Imanishi & Dudley (2000), and Soifer et al. (2000) have argued that dust-obscured AGN activity is the dominant energy source for IRAS 08572+3915. On the other hand, the failure to detect hard X-ray emission ( erg s-1, Risaliti et al., 2000) or an unresolved VLBI radio source (Smith et al., 1998) challenges the AGN interpretation. Both X-ray and radio signatures of an AGN can be obscured by a large column of neutral and ionized gas, and we identify its proximity to the line in Figure 8, adjacent to the bona fide QSO PDS 456, as another evidence that AGN activity is the primary power source for IRAS 08572+3915.
The rare and unique nature of PDS 456 is further demonstrated by the fact that the majority of the “warm ULIRGs”, identified as possible ULIRGs in transition to a QSO phase by Sanders et al. (1988b), are indistinguishable from other ULIRGs in Figure 8. Nine out of the 12 “warm ULIRGs” identified by Sanders et al. have been observed in CO thus far. All nine have been detected in CO, and they are already included as ULIRGs in Figure 8. All but one of these sources cluster together with the other ULIRGs in this figure. IRAS 08572+3915 is the one exception, and indeed it stands out from the others with a large ratio as noted already. No CO measurements are available for the remaining three (IRAS 010032238, IRAS 120710444, 3C 273), and we cannot rule out the possibility that one or more of these three objects also have the large ratio similar to PDS 456. Regardless, we can safely conclude that objects like PDS 456 are rare, even among the “warm ULIRGs”.
Morphological studies of QSO host galaxies have found that not all QSO hosts display evidence of a recent merger while IR-detected QSO hosts often do (see Bahcall et al., 1997; Clements, 2000; Surace, Sanders, & Evans, 2001). Because the size of the accretion disk, mass accretion rate, and total gas mass requirement for QSO activity are relatively small, major mergers involving two massive gas-rich galaxies is not a necessary ingredient for the QSO phenomenon in general. However, given the high probability of finding more massive black holes in more massive progenitors (Magorrian et al., 1998; Ferrarese & Merritt, 2000; Gebhardt et al., 2000) involved in major mergers as well as the theoretical possibility of forming and/or growing massive black holes within massive merger remnants (Weedman, 1983; Norman & Scoville, 1988; Taniguchi, Ikeuchi, & Shioya, 1999), the likelihood of finding one or more massive black holes in an object undergoing a ULIRG phase should be naturally quite high. To this end, a recognizable trend is expected in Figure 8 between ULIRGs and IR-detected QSOs. Indeed ULIRGs (empty circles) and IR QSOs (filled circles) form a continuous distribution in Figure 8 – IR QSOs follow a diagonal line, which connects smoothly to the nearly vertical distribution of ULIRGs near log . If an IR-detected QSO represents a later stage of evolution following the ULIRG phase, then this trend would indicate that the post-ULIRG evolution occurs along a constant line characteristic of IR bright starbursts.
This observed trend between ULIRGs and IR QSOs is somewhat surprising since it is not what is predicted by the existing ULIRG-QSO evolution scenarios. There is a plausible a posteriori explanation to this trend, however. Some scatter is seen in the distribution of the ULIRGs, LIRGs, and PG QSOs in Figure 8, and one can interpret this as evidence for a wide range of “efficiency” in converting fuel into luminosity. Alternatively, one can interpret that this wide range of observed “efficiency” reflects a range in the ratios of dust processed luminosity contribution by AGN and starburst activity in these objects. Among the optically visible QSOs, as radiation pressure and winds clear out gas and dust from the immediate surroundings and reveal the optical AGN, the geometrical cross-section and the solid angle for dust heating by the AGN decrease rapidly (see Downes & Solomon, 1998), and the AGN contribution to the FIR luminosity diminishes quickly to the level where the underlying massive star formation again dominates the FIR luminosity. In this scenario, a nearly vertical upturn in the distribution of ULIRGs near K km s-1 pc2 represents ubiquitous presence of luminous AGNs among ULIRGs, providing a broad range of additional luminosity. Arp 220, which is thought to be powered mostly by an intense starburst, thus appears in the lower half of the ULIRG distribution while Mrk 231 and Mrk 1014, both hosting luminous AGNs, appear near the top of the vertical ULIRG distribution where the elevated AGN contribution to the bolometric luminosity becomes significant. Relatively little overlap between the two populations suggests that the transition is quite rapid.
As noted earlier, PDS 456 and IRAS 08572+3915 are clearly displaced from ULIRGs and IR QSOs in Figure 8, and they represent an interesting challenge to the above ULIRG-QSO evolutionary scenario. One possible explanation is that these objects follow a slightly different evolutionary path. Starting initially as a ULIRG with one or more luminous AGNs (e.g. Mrk 231, Mrk 1014), one possible evolutionary path they might follow is a rapid exhaustion of the gas reservoir via a yet unknown mechanism, retaining only the compact, dense, and warm circum-AGN dust cocoon – i.e., evolving nearly horizontally to the left in Figure 8. This evolutionary scenario is qualitatively similar to what was proposed by Sanders et al. (1988a) although little detailed descriptions were offered by these authors. Few objects are found along this possible evolutionary track, however, and this is not likely a commonly followed evolutionary path.
An alternative explanation is that objects like PDS 456 represent a brief transient phase of highly elevated FIR emission in the ULIRG-QSO evolution. One possible scenario is a momentary obscuration of the AGN by a episodic inflow of gas and dust, resulting in brief periods of dust coverage with a large solid angle and brief increases in FIR luminosity by a factor of a few to ten. Such an event would materialize in Figure 8 as a vertical upward displacement anywhere along the nominal evolutionary track. The rarity of objects like PDS 456 suggests that this period is brief compared with the duration of the IR QSO phase. Numerical simulations of major mergers involving two gas-rich disk galaxies (e.g. Barnes & Hernquist, 1996; Mihos & Hernquist, 1996) have shown that a large fraction of gas can be concentrated into the central 100 pc of the post-merger potential, fueling luminous starbursts seen in the centers of ULIRGs. These simulations also show that the gas inflow, which can last over several hundred million years after the merger, can be lumpy, predicting a significant variation in the gas arrival rate over the entire duration of merger that can last up to a billion years. If a luminous AGN is already present, then this episodic nature of the gas (and dust) inflow would predict a highly variable obscuration of the central AGN – the crossing time for a large gas/dust clump should be much shorter ( years) than the galaxy merger time scale. In this scenario, objects like PDS 456 and IRAS 08572+3915 are thus seen at a special moment in their ULIRG-QSO evolution, rather than being a critical transition phase as considered in § 1. Another important consequence of this scenario is that it predicts a rare but distinct class of FIR sources with , spanning perhaps the entire range of and . A small number of “IR-excess” objects (characterized by a high FIR-to-radio flux density ratio) identified by Yun et al. (2001) among the IRAS detected galaxies may indeed represent this rare population. As mentioned already, IRAS 08572+3915 is such an object. Another of the few well studied “IR-excess” objects, NGC 4418, has a high SFE of (log , log , Sanders et al., 1991) and is indeed thought to host a dust-enshrouded AGN (see Spoon et al., 2001).
The unusually high ratio observed for objects like PDS 456 and IRAS 08572+3915 may have a different explanation, unrelated to the ULIRG-QSO evolution scenario. Whatever the process, it has to account for both the large IR luminosity and the large dust/gas content simultaneously. The paucity of objects with the extreme ratio of PDS 456 suggests that it also has to be a rare process, and its duration must be quite short compared with the length of the luminous phase for QSOs.
5 Summary
We report a new, detailed multi-wavelength observational study of PDS 456, the most luminous QSO in the local universe (). The resolution -band image obtained using the Keck telescope shows three compact () sources located kpc southwest of the QSO, but little detail on the host galaxy is revealed. The near-IR color of these objects are consistent with their being at the same redshift as PDS 456. These imaging results suggest that the host galaxy of PDS 456 may be interacting or merging with one or more companions.
Observations using the OVRO millimeter array has revealed a narrow CO (1–0) line ( km s-1; FWHM = 181 km s-1) centered at . The narrow line width is consistent with a face-on geometry for the circum-AGN gas disk as also suggested by the optically visible QSO. A total H2 mass of is inferred for the host galaxy from the CO luminosity. The most accurate astrometry of the QSO is derived with subarcsecond accuracy using the new high resolution VLA continuum image at 1.2 GHz, and new radio continuum and millimeter continuum measurements are used to constrain the long wavelength SED of PDS 456. The eight times larger radio continuum flux density than expected from the radio-FIR correlation is a clear indication that a radio AGN is present in PDS 456.
Our 850 m photometric observations of PDS 456 using the SCUBA camera on JCMT did not produce a detection at the level of 7.5 mJy (). On the other hand, this upper limit is sufficient to rule out an Arp220-like host with copious amount of cold dust for PDS 456. The total amount of cold dust present in the host system does not exceed about one half of the dust present in Arp 220.
The SEDs of PDS 456, I Zw 1, and 3C 273 are remarkably similar between optical and FIR wavelengths, including the pronounced mid-IR enhancement which is a well known characteristic of AGNs (de Grijp et al., 1985; Yun et al., 2001). At the same time, the SED between FIR and radio wavelengths is similar to that of an ultraluminous galaxy Arp 220, suggesting a dual QSO-like and ULIRG-like nature. The observed FIR, X-ray, and CO properties of PDS 456 suggest that the AGN activity dominates its luminosity.
While a face-on geometry for the dust and gas disks in PDS 456 and Mrk 231 seems quite secure, a surprising new result is that a broad inference of a face-on geometry for nuclear gas disks among QSO host systems is not supported by the observed distribution CO line widths. Among the small number of ULIRGs and PG QSOs examined, QSO hosts show comparable CO line widths as ULIRGs, and the possibility of optical AGNs viewed through gaps in a large scale gas/dust ring or disk at an arbitrary inclination angle cannot be ruled out. We conclude that a face-on geometry for gas and dust distribution around optically visible QSOs, as expected from the AGN “unification” scheme, may be an over-simplification.
PDS 456 and IRAS 08572+3915 are two objects with an extremely large ratio, , which is the upper bound of what can be reasonably expected from a dust enshrouded starburst. A comparison of the gas mass-to-light ratio clearly shows that optically selected IR QSOs are distinct from the ULIRG population in general, even when their host galaxies are fairly rich in molecular gas (). Relatively little overlap between the two populations suggests that the transition is quite rapid. A continuous track formed by ULIRGs and IR QSOs in the “star formation efficiency” plot (Figure 8) suggests a transition in the luminosity contribution by dust obscured AGN from a starburst, in the context of the ULIRG-QSO evolution scenario. We further infer that the FIR luminosity of the IR QSOs is mostly dominated by the underlying starburst activity under the ULIRG-QSO evolution scenario. We also propose that objects like PDS 456 represent a special transient phase in the ULIRG-QSO evolution scenario where the central AGN is momentarily obscured by an episodic inflow of gas and dust. As a consequence, we predict a rare but distinct population of dust obscured AGNs with covering an entire range of FIR luminosity.
In summary, PDS 456, the most luminous QSO in the local universe, does not possess the FIR and gas properties consistent with the ULIRG-QSO evolution scenario proposed by Sanders et al. (1988b) despite its ULIRG-like FIR and CO luminosity and classical QSO signatures of broad emission lines and large X-ray luminosity. The continuous distribution of ULIRGs and IR QSOs in the “star formation efficiency” plot (Figure 8) is broadly consistent with a ULIRG-QSO evolution scenario, and the FIR emission associated with the IR QSOs are dominated by the underlying starburst under this scenario. PDS 456 clearly deviates from the observed ULIRG-QSO trend in this plot. The paucity of PDS456-like objects in the local universe strongly suggests that PDS 456 is a rare, exceptional object, and the duration of the physical process governing its properties must be short compared with the length of the luminous QSO phase.
References
- Alloin et al. (1992) Alloin, D., Barvainis, R., Gordon, M. A., Antonucci, R. R. J. 1992, A&A, 265, 429
- Andreani, Franceschini, & Granato (1999) Andreani, P., Franceschini, A., Granato, G. 1999, MNRAS, 306, 161
- Bahcall et al. (1997) Bahcall, J. N., Kirhakos, S., Saxe, D. H., Schneider, D. P. 1997, ApJ, 479, 642
- Barnes & Hernquist (1996) Barnes, J. E., & Hernquist, L. 1996, ApJ, 471, 115
- Blain et al. (1999) Blain, A. W., Jameson, A., Smail, I., Longair, M. S., Kneib, J.-P., Ivison, R. 1999 MNRAS, 309, 715
- Bryant & Scoville (1996) Bryant, P. M., Scoville, N. Z. 1996, ApJ, 457, 678
- Burstein & Heiles (1982) Burstein, D., & Heiles, C. 1982, AJ, 87, 1165
- Carilli et al. (2001) Carilli, C. L., Bertoldi, F., Omont, A., Cox, P., McMahon, R. G., & Isaak, K. 2001, AJ, 122, 1679
- Clements (2000) Clements, D. L. 2000, MNRAS, 311, 833
- Condon et al. (1998) Condon, J. J., Cotton, W. D., Greison, E. W., Yin, Q. F., Perley, R. A., et al. 1998, AJ, 115, 1693
- Courvoisier (1998) Courvoisier, T. J.-L. 1998, A&ARv, 9 , 1
- de Grijp et al. (1985) de Grijp, M. H. K., Miley, G. K., Lub, J., de Jong, T. 1985, Nature, 314, 240
- Djorgovski et al. (1995) Djorgovski, S., Soifer, B. T., Pahre, M. A., Larkin, J. E., Smith, J. D., et al. 1995, ApJ, 438, L13
- Downes & Solomon (1998) Downes, D., & Solomon, P. M. 1998, ApJ, 507, 615
- Dudley & Wynn-Williams (1997) Dudley, C. C., & Wynn-Williams, C. G. 1997, ApJ, 488, 720
- Dunlop et al. (2003) Dunlop, J. S., McLure, R. J., Kukula, M. J., Baum, S. A., O’Dea, C. P., Hughes, D. H. 2003, MNRAS, 340, 1095
- Evans et al. (2001) Evans, A. S., Frayer, D. T., Surace, J. A., Sanders, D. B. 2001, AJ, 121, 1893
- Ferrarese & Merritt (2000) Ferrarese, L., & Merritt, D. 2000, ApJ, 539, L9
- Gebhardt et al. (2000) Gebhardt, K., Kormendy, J., Ho, L. C., Bender, R., Bower, G. et al. 2000, ApJ, 539, L13
- Genzel et al. (1998) Genzel, R., Lutz, D., Sturm, E., Egami, E., Kunze, D. et al. 1998, ApJ, 498, 579
- Haas et al. (1998) Haas, M., Chini, R., Meisenheimer, K., Stickel, M., Lemke, D. et al. 1998, ApJ, 503, L109
- Haas et al. (2000) Haas, M., Müller, S. A. H., Chini, R., Meisenheimer, K., Klaas, U. et al. 2000, A&A, 354, 453
- Hughes et al. (1993) Hughes, D. H., Robson, E. I., Dunlop, J. S., Gear, W. K. 1993, MNRAS, 263, 607
- Hughes et al. (1998) Hughes, D. H., Serjeant, S., Dunlop, J., Rowan-Robinson, M., Blain, A. et al. 1998, Nature, 394, 241
- Imanishi & Dudley (2000) Imanishi, M., & Dudley, C. C. 2000, ApJ, 545, 701
- Levenson, Weaver, & Heckman (2001) Levenson, N. A., Weaver, K. A., Heckman, T. M. 2001, ApJ, 550, 230
- Madau et al. (1996) Madau, P., Ferguson, H. C., Dickinson, M. E., Giavalisco, M., Steidel, C. C., Fruchter, A. 1996, MNRAS, 283, 1388
- Magorrian et al. (1998) Magorrian, J., Tremaine, S., Richstone, D., Bender, R., Bower, G., et al. 1998, AJ, 115, 2285
- Martel et al. (2003) Martel, A. R., Ford, H. C., Tran, H. D., Illingworth, G. D. Krist, J. E. et al. 2003, AJ, 125, 2964
- Mas-Hesse et al. (1995) Mas-Hesse, J. M., Rodríguez-Pascual, P. M., Fernández de Córdova, Mirabel, I. F., Wamsteker, W., Makino, F., Otani, C. 1995, A&A, 298, 22
- Matthews & Soifer (1994) Matthews, K., Soifer, B. T. 1994, Experimental Astronomy, 3, 77
- McLeod & McLeod (2001) McLeod, K. K., McLeod, B. A. 2001, ApJ, 546, 782
- McLure et al. (1999) McLure, R. J., Kukula, M. J., Dunlop, J. S., Baum, S. A., O’Dea, C. P., Hughes, D. H. 1999, MNRAS, 308, 377
- Mihos & Hernquist (1996) Mihos, J. C. & Hernquist, L. 1996, ApJ, 464, 641
- Norman & Scoville (1988) Norman, C., & Scoville, N. 1988, ApJ, 332, 124
- Omont et al. (2001) Omont, A., Cox, P., Bertoldi, F., McMahon, R. G., Carilli, C., & Isaak, K. 2001, A&A, 374, 371
- Ptak et al. (2003) Ptak, A., Heckman, T., Strickland, D., Levenson, N. A., Weaver, K. 2003, ApJ, 592, 782
- Reeves et al. (2000) Reeves, J. N., O’Brien, P. T., Vaughan, S., Law-Green, D., Ward, M. et al. 2000, MNRAS, 312, L17
- Risaliti et al. (2000) Risaliti, G., Gilli, R., Maiolino, R., & Salvati, M. 2000, A&A, 357, 13
- Rowan-Robinson (1995) Rowan-Robinson, M. 1995, MNRAS, 272, 737
- Sakamoto et al. (1999) Sakamoto, K., Scoville, N. Z., Yun, M. S., Corsas, M., Genzel, R., & Tacconi, L. J. 1999, ApJ, 514, 68
- Sanders et al. (1988a) Sanders, D. B., Soifer, B. T., Elias, J. H., Madore, B. F., Matthews, K. et al. 1988a ApJ, 325, 74
- Sanders et al. (1988b) Sanders, D. B., Soifer, B. T., Elias, J. H., Neugebauer, G., & Matthews, K. 1988b ApJ, 328, L35
- Sanders et al. (1989) Sanders, D. B., Phinney, E. S., Neugebauer, G., Soifer, B. T., Matthews, K. 1989, ApJ, 347, 29
- Sanders et al. (1991) Sanders, D. B., Scoville, N. Z., Soifer, B. T. 1991, ApJ, 370, 158
- Sanders & Mirabel (1996) Sanders, D. B., & Mirabel, I. F. 1996, ARAA, 34, 749
- Scoville & Soifer (1991) Scoville, N. Z., & Soifer, B. T. 1991, in Massive Stars in Starbursts, eds. C. Leitherer, N.R. Walborn, T.M. Heckman, & C.A. Norman (Cambridge Univ. Press: New York), p 233.
- Scoville et al. (1991) Scoville, N. Z., Sargent, A. I., Sanders, D. B., & Soifer, B. T. 1991, ApJ, 366, L5
- Scoville et al. (1992) Scoville, N. Z., Carlstrom, J. C., Chandler, C. J., Phillips, J. A., Scott, S. L., Tilanus, R. P., & Wang, Z. 1992, PASP, 105, 1482
- Scoville, Yun, & Bryant (1997) Scoville, N. Z., Yun, M. S., & Bryant, P. M. 1997, ApJ, 484, 702
- Scoville et al. (2003) Scoville, N. Z., Frayer, D. T., Schinnerer, E., Christopher, M. 2003, ApJ, 585, L105
- Shepherd et al. (1994) Shepherd, M.C., Pearson, T.J., & Taylor, G.B. 1994, BAAS, 26, 987
- Simpson et al. (1999) Simpson, C., Ward, M., O’Brien, P., Reeves, J. 1999, MNRAS, 303, L23
- Shaver et al. (1996) Shaver, P. A., Wall, J. V., Kellermann, K. I., Jackson, C. A., Hawkins, M. R. S. 1996, Nature, 384, 439
- Skrutskie et al. (1997) Skrutskie, M. F., et al. 1997, Proc. Workshop “The Impact of Large Scale Near-IR Sky Surveys”, ed. Garzón F. et al. (Dordrecht: Kluwer), 25
- Smith et al. (1998) Smith, H. E., Lonsdale, C. J., & Lonsdale, C. J. 1998, ApJ, 492, 137
- Soifer et al. (2000) Soifer, B. T., Neugebauer, G., Matthews, K., Egami, E., Becklin, E. E. et al. 2000, AJ, 119, 509
- Solomon et al. (1997) Solomon, P. M., Downes, D., Radford, S. J. E., Barrett, J. W. 1997, ApJ, 478, 144
- Spoon et al. (2001) Spoon, H. W. W., Keane, J. V., Tielens, A. G. G. M., Lutz, D., Moorwood, A. F. M. 2001, A&A, 365, L353
- Surace, Sanders, & Evans (2001) Surace, J. A., Sanders, D. B., & Evans, A. S. 2001, AJ, 122, 2791
- Tacconi et al. (2002) Tacconi, L. J., Genzel, R., Lutz, D., Rigopoulou, D., Baker, A. J., et al. 2002, ApJ, 580, 73
- Taniguchi, Ikeuchi, & Shioya (1999) Taniguchi, Y., Ikeuchi, S., & Shioya, Y. 1999, ApJ, 514, L9
- Torres et al. (1997) Torres, C. A. O., Quast, G. R., Coziol, R., Jablonski, F., de La Reza, R. et al. 1997, ApJ, 488, L19
- Veilleux et al. (1995) Veilleux, S., Kim, D.-C., Sanders, D. B., Mazzerella, J. M., & Soifer, B. T. 1995, ApJS, 98, 171
- Vignali et al. (2000) Vignali, C., Comastri, A., Nicastro, F., Matt, G., Fiore, F., Palumbo, G. G. C. 2000, A&A, 362, 69
- Weedman (1983) Weedman, D. W. 1983, ApJ, 266, 479
- Young & Scoville (1991) Young, J. S., & Scoville, N. Z. 1991, ARAA, 29, 581
- Yun & Scoville (1998) Yun, M. S., & Scoville, N. Z. 1998, ApJ, 507, 774
- Yun et al. (2001) Yun, M. S., Reddy, N. A., Condon, J. J. 2001, ApJ, 554, 803
- Yun & Carilli (2002) Yun, M. S., & Carilli, C. L. 2002, ApJ, 568, 88


| Object | |||
|---|---|---|---|
| (J2000) | (J2000) | ||
| QSO | 17:28:19.78 | 14:15:56.12 | 9.89 0.02 |
| K1 | 17:28:19.64 | 14:15:57.54 | 16.3 0.2 |
| K2+K3 | 17:28:19.69 | 14:15:59.02 | 15.6 0.1 |
| Reference | |||
|---|---|---|---|
| (GHz) | (mJy) | ||
| 25 cm | 1.2 | 245 | this work |
| 21 cm | 1.4 | 30.4 | 1 |
| 21 cm | 1.4 | 2 | |
| 6 cm | 4.85 | 8.23 | 1 |
| 3.6 cm | 8.5 | 4.60.9 | this work |
| 3000 m | 100 | 0.6 | this work |
| 850 m | 350 | 7.5 | this work |
| 100 m | 3000 | 1 | |
| 100 m | 3000 | 3 | |
| 80 m | 3750 | 1 | |
| 60 m | 5000 | 3 | |
| 50 m | 6000 | 1 | |
| 25 m | 12000 | 3 | |
| 25 m | 12000 | 1 | |
| 12 m | 25000 | 3 | |
| 12 m | 25000 | 1 | |
| 4.8 m | 62500 | 4 | |
| 3.8 m | 78900 | 4 | |
| 2.2 m | 136400 | 4 | |
| 2.2 m | 136400 | 737 | this work |
| 2.159 m | 139000 | 5 | |
| 1.662 m | 178300 | 5 | |
| 1.65 m | 181800 | 4 | |
| 1.25 m | 240000 | 4 | |
| 1.235 m | 242800 | 5 |
References. — (1) Reeves et al. 2000; (2) Condon et al. 1998; (3) IRAS ADDSCAN; (4) Simpson et al. 1999; (5) 2MASS