An Intriguing X-ray Arc Surrounding the X-ray Source RX J0533356854.9 toward the Large Magellanic Cloud
Abstract
ROSAT observations of the Large Magellanic Cloud (LMC) have revealed a large diffuse X-ray arc around the point source RX J0533356854.9. The relative locations of the diffuse and point sources suggest that they might originate from a common supernova explosion. We have analyzed the physical properties of the diffuse X-ray emission and determined that it is most likely a supernova remnant in a low-density medium in the LMC. We have also analyzed the X-ray and optical observations of RX J0533356854.9 and concluded that it is a foreground dMe star in the solar neighborhood. Therefore, despite their positional coincidence, these two X-ray sources are physically unrelated.
1 Introduction
The Röntgen X-ray Satellite (ROSAT) observations of the Large Magellanic Cloud (LMC) have revealed a wealth of diffuse and compact X-ray sources (Snowden & Petre, 1994; Haberl & Pietsch, 1999; Sasaki et al., 2002). Many large diffuse X-ray sources have sizes greater than 100 pc. Some of these diffuse sources are associated with superbubbles and supergiant shells, and others seem to originate from fields unbounded by interstellar structures identifiable at optical or radio wavelengths (Dunne et al., 2001; Points et al., 2001).
Among the large diffuse X-ray sources, we have identified two objects whose diffuse X-ray emissions have ring morphologies and are centered on point sources. These two objects are intriguing because they are not bounded by superbubbles and the relative locations of the point source and the diffuse X-ray emission appear to suggest a physical association. The first object, at 5h07m36s, 68∘47′52′′ (J2000), is projected in the vicinity of the superbubble N103 surrounding the star cluster NGC 1850. A detailed analysis of this object shows that the large X-ray ring, 150 pc in diameter, is most likely a supernova remnant (SNR) formed in the low-density halo of the LMC and the central point source might be an X-ray binary in the cluster HS122, but the relationship between the SNR and the X-ray binary is uncertain (Chu et al., 2000).
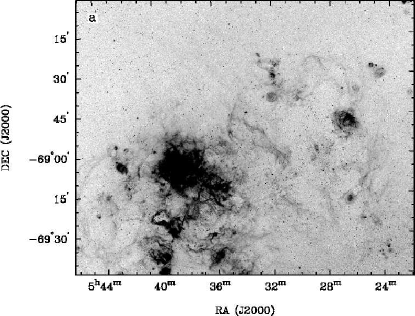
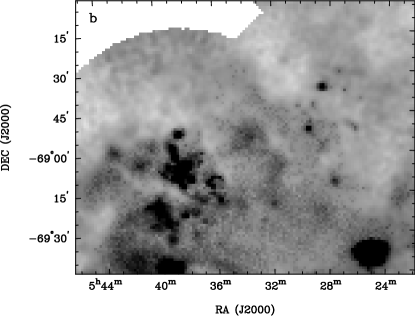
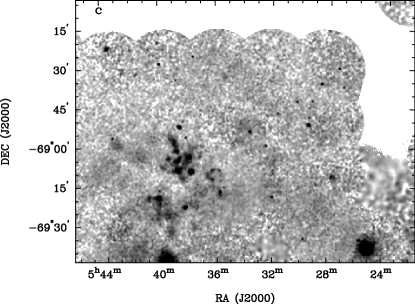
The second object, shown in Figure 1, is projected on the eastern rim of the supergiant shell LMC-3 (Goudis & Meaburn, 1978). Its 95 angular diameter corresponds to 140 pc, if it is in the LMC at a distance of 50 kpc (Feast, 1999). The ROSAT Position Sensitive Proportional Counter (PSPC) mosaic (Snowden & Petre, 1994) in Figure 1b shows semi-circular diffuse X-ray emission centered on the point source RX J0533356854.9 at 5h33m36s, 68∘54′55′′ (J2000). The ROSAT High Resolution Imager (HRI) mosaic (Chu & Snowden, 1998) in Figure 1c, having a much higher angular resolution, shows diffuse X-ray emission in an east-north-west arc centered on the point source. RX J0533356854.9 is coincident with a 14th mag stellar object in the Digitized Sky Survey (DSS). To determine the origin of the diffuse X-ray emission, we have analyzed the ROSAT observations in conjunction with optical images and high-dispersion, long-slit spectra of the underlying 104 K ionized interstellar gas. To determine the nature of the point source, we have examined both the photometric and spectral properties of its optical counterpart, and compared them with the spectral properties of the X-ray source. The results of our analysis are reported in this paper.
2 Observations
2.1 ROSAT X-ray Observations
ROSAT observations of RX J0533356854.9 and its surrounding diffuse X-ray emission have been made with both the PSPC and the HRI detectors. The PSPC is sensitive in the energy range 0.1–2.4 keV and has a 45% spectral resolution with on-axis angular resolution of 25′′ at 1 keV. The HRI is sensitive at 0.1–2.0 keV; it has a negligible spectral resolution, but a high on-axis angular resolution of 5′′.
We have retrieved all ROSAT observations where RX J0533356854.9 falls within 45′ and 20′ from the field center for the PSPC and HRI, respectively. These observations are listed with their exposure times, locations, original targets of the observations, and the offset of RX J0533356854.9 from the field center in Table 1. Note that for all PSPC observations, RX J0533356854.9 lies either close to or outside the circular window support structure of 40′ diameter. For the former, the wobbling of the telescope moves the source in and out of the shadow of the window support ring and decreases the number of counts, while for the latter the detector sensitivity is reduced and the point spread function is degraded at large off-axis angles. Therefore, we used the PSPC observations to carry out only the spectral analysis and used the higher resolution HRI observations for morphological analysis and comparisons with optical images.
We have used the PROS111PROS/XRAY Data Analysis System, http://hea-www.harvard.edu/PROS/pros.thml software package within IRAF222Image Analysis and Reduction Facility, IRAF is distributed by the National Optical Astronomy Observatories operated by the Association of Universities for Research in Astronomy, Inc., under cooperative agreement with the National Science Foundation. for spatial and spectral analyses of these observations. To improve the S/N, we merged the PSPC observations centered on SN 1987A with exposure times 9 ks (see Table 1) to produce a 90 ks equivalent exposure, and extracted spectra from the combined data for further analysis. The other PSPC data were deemed to be less useful and were not used.
2.2 Optical Images
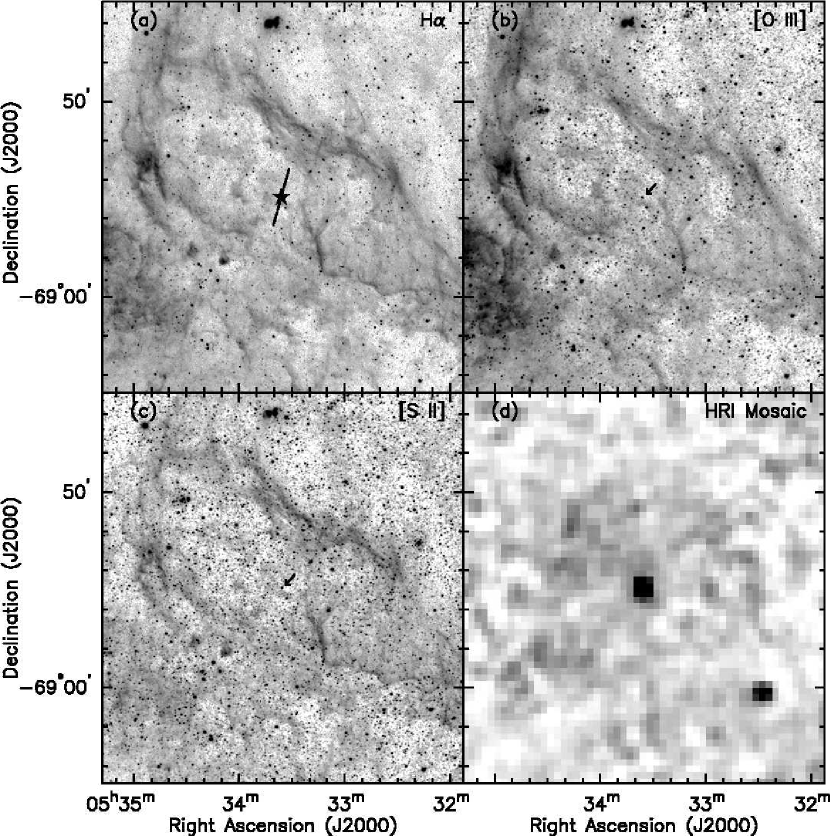
Optical images were taken at the Cerro Tololo Inter-American Observatory (CTIO) with a CCD camera on the Curtis Schmidt telescope. The observations were part of the Magellanic Cloud Emission-Line Survey (MCELS) by Smith et al. (1999). The detector was the SITe2048 #5 CCD. Its 24 m pixel size corresponds to 23. Images were obtained with the following filters and exposure times: H ( = 6568 Å, FWHM = 28 Å), 150 s; [O III] ( = 5023 Å, FWHM = 40 Å), 600 s; [S II] ( = 6738 Å, FWHM = 50 Å), 600 s; green continuum ( = 5130 Å, FWHM = 155 Å), 300 s; red continuum ( = 6852 Å, FWHM = 95 Å), 300 s. The H, [S II], and red continuum images were obtained on 1998 November 27, and the [O III] and green continuum images were obtained on 2000 December 30. The emission-line images of RX J0533356854.9 and its vicinity are presented in Figure 2.
2.3 High-Dispersion Spectra
To determine the radial velocity of the optical counterpart of RX J0533356854.9 and to examine the kinematics of the 104 K ionized gas underlying the diffuse X-ray emission, we obtained high-dispersion spectroscopic observations using the echelle spectrograph on the Blanco 4 m telescope at CTIO on 2002 June 24. The spectrograph was used with the 79 line mm-1 echelle grating and the long-focus red camera in the single-order, long-slit mode. This observing configuration provided a reciprocal dispersion of 3.4 Å mm-1 and covered the H and [N ii] 6548,6584 lines over a slit length of 3′. The SITe2048 CCD used has a pixel size of 24 m, which corresponds to 3.7 km s-1 pixel-1 along the dispersion direction and pixel-1 along the slit. The slit width was and the resultant instrumental FWHM was 15 km s-1. The angular resolution, determined by the seeing, was 2. The slit was oriented at PA = and the total integration time was 900 s.
3 Discussion: Physical Nature of the X-ray Sources
The X-ray point source RX J0533356854.9 is projected within the LMC and apparently surrounded by the diffuse X-ray arc. Below we discuss the nature of the diffuse emission and the point source individually.
3.1 Physical Nature of the X-ray Arc
The circular boundary of the diffuse X-ray emission surrounding RX J0533356854.9 suggests that the hot gas may have been energized by a supernova explosion at its geometric center. The angular radius varies from 4′ on the east side to 55 on the west side. This diffuse X-ray emission region does not show morphological correspondence with optical emission. As shown in Figure 2, long ( 20′) optical filaments exist but are associated with the supergiant shell LMC-3 and do not delineate the X-ray emission region. From the morphology alone, the hot gas responsible for the diffuse X-ray emission does not appear to be associated with the cooler gas responsible for the optical emission.
It is unlikely that this diffuse X-ray source is associated with a SNR in the Galactic plane (within 500 pc), because its linear size (2 pc) implies a very young age and it would have been much brighter. The probability is also small for this source to originate from a SNR in the Galactic halo, because massive stars do not reside in the halo and the low stellar density in the halo implies a very low Type Ia supernova rate. On the other hand, its projected location in the LMC is within a large-scale star-forming region where the supernova rate is expected to be high; therefore, it is most likely that a SNR in the LMC is responsible for this diffuse X-ray emission. The linear radius of the X-ray emission region, 60–82 pc, is larger than those of most SNRs, a few tens of pc in diameter, but is reasonable for SNRs formed in a low-density medium.
The physical conditions of the X-ray-emitting gas can be derived from the observed X-ray spectra, which are a convolution of the intrinsic spectra, the intervening interstellar absorption, and the PSPC response function. The contribution of the absorption and response function to the spectra is energy-dependent, therefore it is necessary to model the spectra in order to determine the temperature and emission measure of the X-ray sources. The diffuse emission appears to originate from hot ionized gas therefore we used the Raymond & Smith (1977) models of thin plasma emission and the Morrison & McCammon (1983) models of absorption to simulate the observed spectra, and determined the best fit by minimization.
The best-fit model for the background-subtracted PSPC spectrum (see Figure 3a) gives a plasma temperature of 0.3 keV, an absorption column density of cm-2, and a normalization factor cm-5. This plasma temperature is within the range commonly seen in SNRs. The rms electron density can be determined from the normalization factor , where is the electron density of the plasma, is the volume of the X-ray-emitting plasma, and is the distance to the X-ray source. Assuming a filled hemispherical emitting volume with a 70 pc radius, the rms is 0.03 cm-3, which is lower by at least an order of magnitude than most SNRs in the LMC. If the volume filling factor of the X-ray-emitting plasma is less than 1, the density would be times higher, but still lower than those of most SNRs. The total thermal energy of the hot gas is ergs. The unabsorbed X-ray flux for the diffuse emission is ergs cm-2 s-1, and the X-ray luminosity is ergs s-1 in the 0.5–2.0 keV band. Both the thermal energy and X-ray luminosity are similar to those observed in mature Magellanic Cloud SNRs yr of age (Williams et al., 1997, 1999).
The physical properties of the diffuse X-ray emission around RX J0533356854.9 are fully consistent with those of a mature SNR in a low-density medium, much like the large X-ray ring around RX J0507366847.8 (Chu et al., 2000). The low density of the ambient interstellar medium explains the large size and the absence of a detectable optical shell.
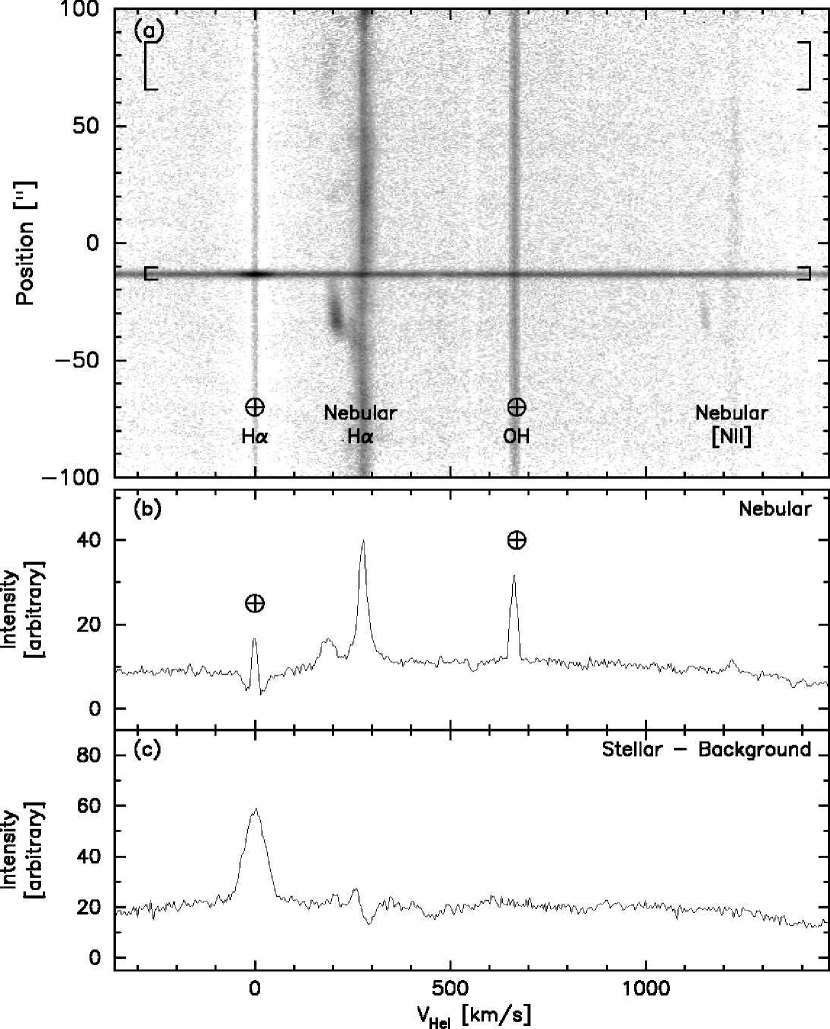
The association of the diffuse X-ray arc with a SNR is further supported by the high-velocity ionized gas detected in our echelle observation. The echellogram in Figure 4 shows two nebular components. The first component has a fairly uniform surface brightness and a nearly constant velocity, at = 2794 km s-1, along the entire slit length. This component originates from a large-scale diffuse ionized medium in the LMC. The second component is blue-shifted from the stationary component, and the velocity offset varies from 50 km s-1 at 05 south of RX J0533356854.9 to 100 km s-1 at 18 north of RX J0533356854.9. The high-velocity features are fainter than the large-scale diffuse component so that only the brightest feature, south of the star, can be identified with a filament in the emission-line images (compare Figures 2 and 4). The spatial scale and magnitude of velocity offset of this nebular component are similar to those seen in SNRs in the LMC (Chu & Kennicutt, 1988). It is possible that this high-velocity nebular component is associated with the SNR responsible for the diffuse X-ray arc. While the SNR is in a low-density medium in general, there may exist small dense clouds which are shocked and give rise to the high-velocity nebular emission. The scarcity of the dense clouds in a low-density medium prevents the formation of a dense SNR shell structure.
3.2 Physical Nature of the Point Source
The X-ray point source RX J0533356854.9 appears to be coincident with a 14th mag star shown in the DSS. The position of RX J0533356854.9 measured from the HRI image (RH600640N00) is 5h33m36s.0, 68∘54′55′′ (J2000). The star has been cataloged in the Guide Star Catalog 2.2 as GSC2.2 S013200256362 at 5h33m35s.2, 68∘54′54′′ (J2000), in the 2 Micron All Sky Survey (2MASS) as PSC 053335116854544 at an almost identical position, and in the US Naval Observatory-A2.0 catalog as USNO-A2.0 0150-03257930 at 5h33m35s.3, 68∘54′54′′ (J2000). The apparent offset between the X-ray source and the optical star, 45, can be accounted for by the uncertainty in the aspect solution of the ROSAT pointing. Therefore, we consider the X-ray and optical sources coincident.
The photometric measurements of the star given by the catalogs are: and in USNO-A2.0; and in GSC 2.2; and , , and in 2MASS. The colors of this star, , , and , are consistent with a red star with a spectral type of M2–M3 (Cox, 2000). As the distance to this star is unknown, it can be a supergiant in the LMC, a giant in the Galactic halo, or a dwarf in the solar neighborhood.
These three possibilities can be distinguished by the radial velocity () of the star: 300 km s-1 in the LMC, moderate to high velocities in the Galactic halo, and low velocities in the solar neighborhood. We have extracted a sky-subtracted spectrum of this star from our echelle observation and plotted it in Figure 4c. The most prominent spectral feature of the star in this wavelength range is the H emission line at km s-1, or km s-1. This small radial velocity strongly argues for this star to be located in the solar neighborhood. Thus we further conclude that the star is a dwarf M2–M3 star with H emission, one of those commonly called dMe stars. Adopting a dwarf luminosity class, the distance to the star is found to be 60–80 pc.
To determine whether RX J0533356854.9 and the star are physically associated, we examine the X-ray spectral properties. The background-subtracted PSPC spectrum of RX J0533356854.9 in Figure 3b displays a spectral shape typical for stellar coronal emission. As dMe stars are known to exhibit coronal activity, it is likely that RX J0533356854.9 and this dMe star are physically associated. We have used the thin plasma emission model of Raymond & Smith (1977) to fit the PSPC spectrum. The best-fit model gives a plasma temperature of keV and an absorption column density of cm-2. The small absorption column density indicates a small distance. Adopting the distance of the dMe star, 60–80 pc, the X-ray luminosity of RX J0533356854.9 is (2–3) ergs s-1 in the 0.5–2.0 keV range. This X-ray luminosity is completely consistent with those expected from dMe stars (Rucinski, 1984). We therefore conclude that the X-ray point source RX J0533356854.9 is physically associated with the dMe star.
4 Conclusions
ROSAT observations of the LMC have revealed a large diffuse X-ray arc in projection around the point source RX J0533356854.9. The relative locations of the diffuse and point sources suggest that they might originate from a common supernova explosion. We have analyzed the physical properties of the diffuse X-ray emission and determined that it is most likely a SNR in a predominantly low-density medium. We have also analyzed the X-ray and optical observations of RX J0533356854.9 and concluded that it is a dMe star in the solar neighborhood. Therefore, these two X-ray sources are physically unrelated. As dMe stars are the most prevalent stellar X-ray sources in the solar neighborhood (Schmitt, Fleming, & Giampapa, 1995), and as the cooling time for a SNR in a low-density medium is long, the probability for the superposition of a nearby dMe star with a large SNR in the LMC is not negligible.
References
- Chu & Kennicutt (1988) Chu, Y.-H., & Kennicutt, R. C. 1988, AJ, 95, 1111
- Chu et al. (2000) Chu, Y.-H., Kim, S., Points, S. D., Petre, R., & Snowden, S. L. 2000, AJ, 119, 2242
- Chu & Snowden (1998) Chu, Y.-H., & Snowden, S. L. 1998, AN, 319, 101
- Cox (2000) Cox, A. N. 2000, Allen’s Astrophysical Quantities, (AIP Press)
- Dunne et al. (2001) Dunne, B. C., Points, S. D., & Chu, Y.-H. 2001, ApJS, 119
- Feast (1999) Feast, M. 1999, in IAU Symp. 190, New Views of the Magellanic Clouds, ed. Y.-H. Chu et al. (San Francisco: ASP), 542
- Goudis & Meaburn (1978) Goudis, C., & Meaburn, J. 1978, A&A, 68, 189
- Haberl & Pietsch (1999) Haberl, F., & Pietsch, W. 1999, A&AS, 139, 277
- Morrison & McCammon (1983) Morrison, R., & McCammon, D. 1983, ApJ, 270, 119
- Points et al. (2001) Points, S. D., Chu, Y.-H., & Smith, R. C. 2001, ApJS, 136
- Raymond & Smith (1977) Raymond, J. C., & Smith, B. W. 1977, ApJS, 35, 419
- Rucinski (1984) Rucinski, S. M. 1984, A&A, 132, L9
- Sasaki et al. (2002) Sasaki, M., Haberl, F., & Pietsch, W. 2002, A&A, 392, 103
- Schmitt, Fleming, & Giampapa (1995) Schmitt, J. M. M. M., Fleming, T. A., & Giampapa, M. S. 1995, ApJ, 450, 392
- Smith et al. (1999) Smith, R. C., et al. 1999, in IAU Symp. 190, New Views of the Magellanic Clouds, ed. Y.-H. Chu et al. (San Francisco: ASP), 28
- Snowden & Petre (1994) Snowden, S. L., & Petre, R. 1994, ApJ, 436, L123
- Williams et al. (1997) Williams, R. M., Chu, Y., Dickel, J. R., Beyer, R., Petre, R., Smith, R. C., & Milne, D. K. 1997, ApJ, 480, 618
- Williams et al. (1999) Williams, R. M., Chu, Y., Dickel, J. R., Smith, R. C., Milne, D. K., & Winkler, P. F. 1999, ApJ, 514, 798

| Observation | Exposure | RA (J2000) | Dec (J2000) | Target | Offset |
|---|---|---|---|---|---|
| NumberaaRH – HRI observations; RP – PSPC observations. | (s) | (h m s ) | ( ∘ ′ ′′ ) | Name | (′) |
| RP180179N00 | 15924 | 05 35 28.80 | 69 16 11.6 | SN1987A | 23.5 |
| RP180251N00 | 20153 | 05 35 28.80 | 69 16 11.6 | SN1987A | 23.5 |
| RP180294N00 | 2674 | 05 35 28.80 | 69 16 11.6 | SN1987A | 23.5 |
| RP500100A00 | 16957 | 05 35 28.80 | 69 16 11.6 | SN1987A | 23.5 |
| RP500100A01 | 9657 | 05 35 28.80 | 69 16 11.6 | SN1987A | 23.5 |
| RP500140N00 | 2642 | 05 35 28.80 | 69 16 11.6 | SN1987A | 23.5 |
| RP500140A01 | 11625 | 05 35 28.80 | 69 16 11.6 | SN1987A | 23.5 |
| RP500140A02 | 10758 | 05 35 28.80 | 69 16 11.6 | SN1987A | 23.5 |
| RP500303N00 | 9416 | 05 35 28.80 | 69 16 11.6 | SN1987A | 23.5 |
| RP600100A00 | 5803 | 05 35 38.40 | 69 16 11.6 | REGION F | 23.9 |
| RP600100A01 | 16865 | 05 35 38.40 | 69 16 11.6 | REGION F | 23.9 |
| RP500131N00 | 15959 | 05 38 33.60 | 69 06 36.0 | N157 | 29.1 |
| RP500138N00 | 2478 | 05 26 36.00 | 68 50 23.6 | N144 | 38.2 |
| RP500138A01 | 14531 | 05 26 36.00 | 68 50 23.6 | N144 | 38.2 |
| RP500138A02 | 14581 | 05 26 36.00 | 68 50 23.6 | N144 | 38.2 |
| RH600640N00 | 24070 | 05 32 04.80 | 68 51 00.0 | LMC POINT 010 | 9.1 |
| RH600634N00 | 23619 | 05 35 52.80 | 68 51 00.0 | LMC POINT 004 | 12.9 |