Abstract
An isolated massive star can blow a bubble, while a group of massive stars can blow superbubbles. In this paper, we examine three intriguing questions regarding bubbles and superbubbles: (1) why don’t we see interstellar bubbles around every O star? (2) how hot are the bubble interiors? and (3) what is going on at the hot/cold gas interface in a bubble?
Bubbles and Superbubbles
Bubbles
1 Introduction: Definition and Basic Facts
Massive stars inject mechanical energy into the ambient medium via fast stellar winds during their lifetime and supernova ejecta at the end of their evolution. The stellar winds and supernova ejecta sweep up and compress the ambient medium into shells, called bubbles or superbubbles depending on whether the energy source is an isolated massive star or a group of massive stars such as OB associations and young clusters. As a bubble is blown by a single massive star, its size grows up to a few pc before the star explodes, while a superbubble blown by a populous cluster or OB association can grow up to a few pc before exhausting all massive stars.
The formation of a bubble is intimately dependent on the evolution and mass loss history of the central massive star. Massive stars evolve from the main sequence (MS), through a luminous blue variable (LBV) or red supergiant (RSG) phase, to the Wolf-Rayet (WR) phase before rushing toward the final supernova explosion. Along these evolutionary stages, a massive star loses mass via tenuous fast (1000-2500 km s-1) stellar wind during the MS stage, copious slow (10-50 km s-1) wind during the RSG stage, copious slow or not-so-slow wind at the LBV stage, and fast stellar wind again during the WR stage. A MS O-type star is most likely surrounded by the relics of its natal cloud, thus its wind-blown bubble contains interstellar material and is an interstellar bubble. A WR star, on the other hand, is surrounded by the slow wind ejected by its progenitor during the RSG or LBV phase; thus its wind-blown bubble contains stellar material and is a circumstellar bubble.
The most realistic hydrodynamic modeling of bubbles has been carried out by García-Segura et al. (1996a, 1996b). They take into account the stellar evolution and the mass loss history, forming an interstellar bubble around a MS O star at first and a circumstellar bubble around a WR star at the end. Their models and the most well cited interstellar bubble model by Weaver et al. (1977) both assume that the fast stellar wind is shocked and forms a contact discontinuity with the dense swept-up shell, and that the thermal pressure of the shocked fast wind drives the expansion of the bubble.
The physical structure of a superbubble can be similar to that of an interstellar bubble, if the fast stellar winds and the supernova ejecta are thermalized and confined in the superbubble interior (Mac Low & McCray 1988). If supernovae occur near a superbubble shell, the impact on the shell will produce signatures similar to a supernova remnant (SNR), and the shell will appear as a SNR-superbubble hybrid (Chu & Mac Low 1990).
Finally, we note that planetary nebulae (PNe) are also bubbles, as they are formed by the current fast wind of the central star plowing into the circumstellar material shed by the progenitor via copious slow wind during the asymptotic giant branch (AGB) and post-AGB stages, much like the formation of a WR bubble. The optical morphology of a PN is frequently complicated by the presence of jets and collimated outflows, but the overall bubble structure is still well shown in X-rays, and comparisons between PNe and WR bubbles may help us understand both objects.
2 Three Questions: Physical Structure of Bubbles
The different layers of a wind-blown bubble can be observed at
different wavelengths: the photoionized swept-up shell is best
seen in the H line, the shocked stellar wind can be
detected in X-rays, and the interface is best observed in UV
or FUV.
Three questions naturally come to mind:
(1) Why don’t we see interstellar bubble around every MS
O star?
(2) How hot is the bubble interior?
(3) What is going on at the hot/cold gas interfaces in a
bubble?
Below we present recent observations to answer these questions.
Q1: Why Don’t We See More Interstellar Bubbles?
Theoretically, every massive O star should be surrounded by an interstellar bubble, and as long the ambient interstellar gas is dense enough the bubble should be visible as a “ring nebula” in H images. However, the Bubble Nebula (NGC 7635) appears to be an exception, rather than the rule. Why don’t we see more interstellar bubbles around O stars?
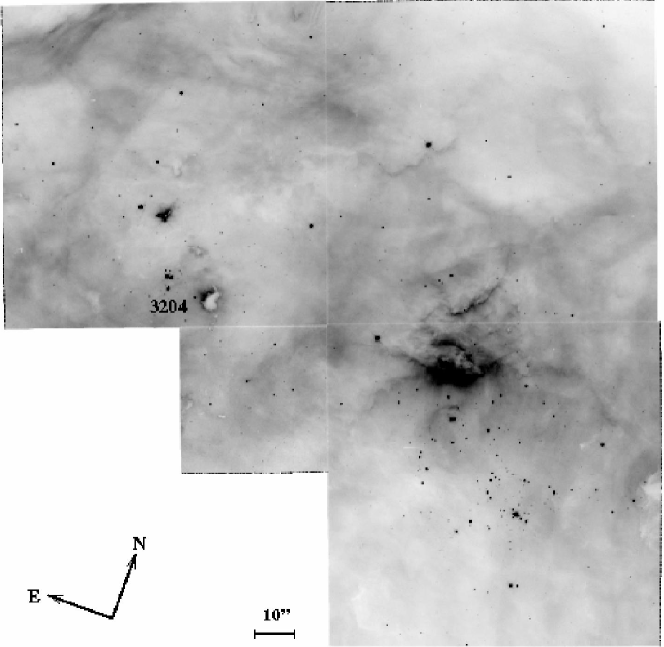
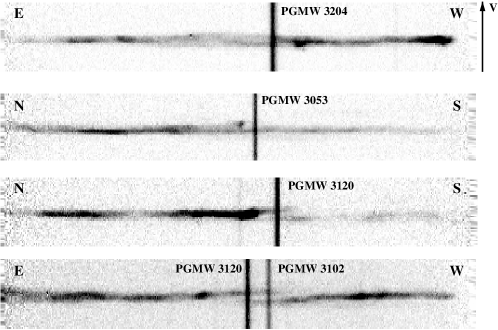
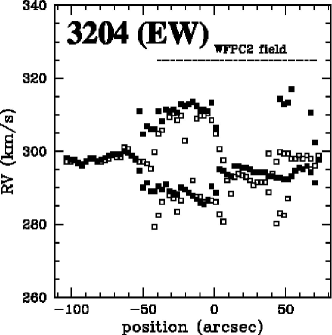
The best way to answer this question is to observe H II regions of young OB associations, where no supernova explosions have occurred and the ambient interstellar gas is visibly dense. This has been attempted by using HST WFPC2 images of the H II regions N11B and N180B in the Large Magellanic Cloud (LMC), but no bubbles can be identified morphologically (Fig. 1) The presence of interstellar bubbles in these young H II regions is nevertheless clearly illustrated by long-slit echelle spectroscopic observations, in which expanding shell structures around early O stars are detected (Fig. 1). These expanding shells, centered on concentrations of O stars, often exhibit different brightness in the approaching and receding sides, suggesting that the stars are formed on the surface of a cloud and their bubbles have a “blister” structure.
Why can’t the expanding bubbles in N11B and N180B be morphologically identified in H images? While the bright background H II region makes it difficult to detect the surface brightness perturbations caused by bubbles, the most important reason is that the swept-up shell is not strongly compressed to raise its emission measure. The compression of a bubble shell depends on the shocks advancing into the ambient medium. As shown in Fig. 1, the expansion velocities of the bubbles in young H II regions are only 10-15 km s-1, comparable to or slightly higher than the isothermal sound velocity of the 104 K H II region, 10 km s-1. Therefore, the expanding bubbles hardly compress the ambient medium to produce the density contrast needed to exhibit a ring nebula morphology in H images (Nazé et al. 2001).
Interestingly, H I 21-cm line observations frequently detect interstellar bubbles around WR stars with expansion velocities of 10 km s-1 (Cappa et al. 2003). These interstellar bubbles are consistent with the bubbles seen in the young H II regions N11B and N180B. As massive stars evolve and lose ionizing power, their interstellar bubbles and ambient medium will recombine and cool. The isothermal sound velocity of an H I medium is 1 km s-1, so the expansion of the interstellar bubbles becomes highly supersonic and causes stronger compression, producing larger contrast between the bubble and the background.
Q2: How Hot Is the Superbubble/Bubble Interior?
The hot gas in bubble interiors can be detected in X-rays. Einstein and ROSAT observations have revealed diffuse X-ray emission from two WR bubbles (NGC 6888 and S 308), and a large number of superbubbles in the LMC. It has been demonstrated that superbubbles in a quiescent state are X-ray-faint with luminosities at least an order of magnitude lower than expected from Weaver et al.’s (1977) interstellar bubble models (Chu et al. 1995), and that superbubbles can be intermittently heated by supernovae near the shell walls and become X-ray-bright (Chu & Mac Low 1990). The impact of supernovae not only generates bright X-ray emission but also may produce breakouts through which hot gas is vented to the surroundings, as shown in the LMC superbubble N44 (Chu et al. 1993; Magnier et al. 1996).


Chandra and XMM-Newton X-ray Observatories have made great strides in detecting hot gas in superbubble and bubble interiors. The most interesting superbubbles are the young ones that have not hosted any supernovae, so that their hot gas is energized purely by fast stellar winds and can be compared with the hot gas in single-star bubbles. Chandra has detected diffuse X-ray emission from two of such young superbubbles in the Galaxy, the Rosette Nebula and the Omega Nebula (Townsley et al. 2003). Their X-ray spectra (Fig. 2) indicate that the hot gas has a major component at temperatures of almost 107 K and a minor component at temperatures of K.
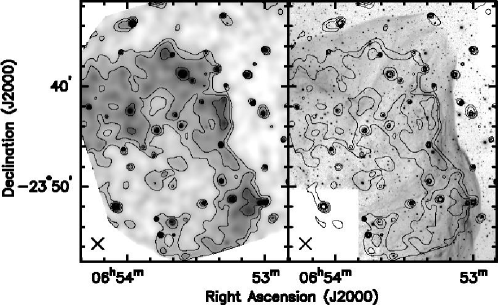
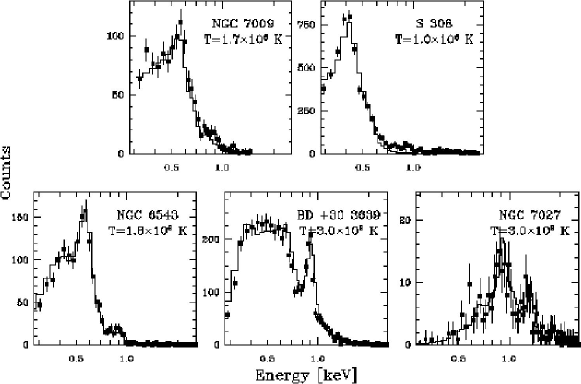
No new detections of diffuse X-ray emission from single-star bubbles have been made. NGC 6888 and S 308 remain the only two bubbles with known diffuse X-ray emission. Chandra ACIS-S observations of NGC 6888 (Gruendl et al. 2004) and XMM-Newton EPIC observations of S 308 (Chu et al. 2003) show differences in both the distribution and the temperature of the interior hot gas. The X-ray image of S 308 shows a distinct gap between the outer edge of the X-ray emission and the outer rim of the optical shell (Fig. 3), while the diffuse X-ray emission from NGC 6888 reaches all the way to the rim of the optical shell. The X-ray spectrum of diffuse emission from S 308 (Fig. 4) is extremely soft, indicating a plasma temperature of only K. The X-ray spectrum of diffuse emission from NGC 6888 is also soft, but the plasma temperature is slightly higher at 2–3 K.
Chandra and XMM-Newton have detected shocked fast stellar winds from 5 PNe: BD+30∘3639, Mz-3, NGC 6543, NGC 7009, and NGC 7027 (Kastner et al. 2000, 2001, 2003; Chu et al. 2001; Guerrero et al. 2002). Their X-ray spectra, four shown in Fig. 4, are all soft, and their best spectral fits indicate plasma temperatures of 2–3 K.
It is interesting to compare the physical properties of hot gas among the superbubbles, WR bubbles, and PNe. In bubbles blown by a single star the hot gas temperatures are all low, 1–3 K, while in superbubbles blown by large numbers of massive stars the hot gas temperatures are much higher, reaching 107 K. The X-ray morphologies of single-star bubbles show limb-brightening, while those of young superbubbles show brighter emission near stars at the center. These results suggest that the hot gas in superbubbles is dominated by colliding stellar winds in the vicinity of massive stars, while the hot gas in single-star bubbles is generated by shocked fast wind mixing with nebular material. The mixing of cool nebular material into the hot gas is not simply thermal evaporation, as the observed X-ray luminosities are much lower than those expected from models with thermal conduction at the interface layer. This problem leads to the next question.
Q3: What Is Going on at the Hot/Cold Gas Interfaces in a Bubble?


The interfaces are conventionally observed with absorption lines of highly ionized species such as C IV and N V. The first convincing detection of a single interface was reported by Boroson et al. (1997) in the WR bubble S 308 (Fig. 5); the 50 km s-1 component of the N V line is identified as originating from the interface on the approaching side of the bubble. It is evident that the S II absorption originates from low-ionization gas along the line of sight, and that C IV, peaking at the same velocity, is most likely photoionized unlike N V which is collisionally ionized.
The Far UV Spectroscopic Explorer (FUSE) opened up a new window to observe the interface – the O VI lines. The two WR bubbles with known diffuse X-ray emission provide the best laboratory to study interfaces. FUSE observations of the O VI emission and HST long-slit STIS observations of the N V emission may spatially resolve the temperature structure of the interfaces. It will then be possible to assess the relative importance of thermal evaporation and dynamical ablation for mixing nebular material into the hot bubble interior. We do not have an answer to the question on the interface yet, but we are working on it and will find the truth one day.
3 Conclusion
HST, Chandra, XMM-Newton, and FUSE observations of bubbles and superbubbles are beginning to reveal their physical structure. These results will provide valuable guidance for future theoretical modeling of bubbles.
References
- [1] Boroson, B., McCray, R., Oelfke Clark, C., et al. 1997, ApJ, 478, 638
- [2] Cappa, C.E., Arnal, E.M., Cichowolski, S., Goss, W.M., & Pineault, S. 2003, in IAU Symp. 212, A Massive Star Odyssey from Main Sequence to Supernova, eds. K.A. van der Hucht, A. Herrero, & C. Esteban, 596
- [3] Chu, Y.-H., Chang, H., Su, Y., & Mac Low, M.-M. 1995, ApJ, 450, 157
- [4] Chu, Y.-H., Guerrero, M.A., Gruendl, R.A., et al. 2001, ApJ, 553, L69
- [5] Chu, Y.-H., Guerrero, M.A., Gruendl, R.A., et al. 2003, ApJ, in press
- [6] Chu, Y.-H., & Mac Low, M.-M. 1990, ApJ, 365, 510
- [7] Chu, Y.-H., Mac Low, M. M., García-Segura, G., et al. 1993, ApJ, 414, 213
- [8] Dunne, B. C., Chu, Y.-H., Chen, C.-H. R., et al. 2003, ApJ, 590, 306
- [9] García-Segura, G., Langer, N., & Mac Low, M.-M. 1996a, A&A, 316, 133
- [10] García-Segura, G., Mac Low, M.-M., & Langer, N. 1996b, A&A, 305, 229
- [11] Gruendl, R.A., Guerrero, M.A., & Chu, Y.-H. 2004, in preparation
- [12] Guerrero, M. A., Gruendl, R. A., & Chu, Y.-H. 2002, A&A, 387, L1
- [13] Kastner, J. H., Balick, B., Blackman, E. G., et al. 2003, ApJ, 591, L37
- [14] Kastner, J. H., Soker, N., Vrtilek, S. D., & Dgani, R. 2000, ApJ, 545, L57
- [15] Kastner, J. H., Vrtilek, S. D., & Soker, N. 2001, ApJ, 550, L189
- [16] Mac Low, M.-M., & McCray, R. 1988, ApJ, 324, 776
- [17] Magnier, E. A., Chu, Y.-H., Points, S. D., Hwang, U., & Smith, R. C. 1996, ApJ, 464, 829
- [18] Nazé, Y., Chu, Y.-H., Points. S.D., et al. 2001, AJ, 122, 921
- [19] Townsley, L. K., Feigelson, E. D., Montmerle, T., et al. 2003, ApJ, 593, 874
-
[20]
Weaver, R., McCray, R., Castor, J., Shapiro, P., & Moore, R.
1977, ApJ, 218, 377
4. Discussion
Welsh: The trouble with using Weaver et al. equation is that there is a huge “fudge factor” called , the ambient interstellar density which can be “tweaked” to give almost any answer you want.
Chu: It is possible to use the surface brightness of the ambient H II region to estimate the ambient density, or imply the ambient density from the swept-up shell density. See the analysis of bubbles in N11B and N180B by Nazé et al. (2001), and the analysis of the superbubble in M17 by Dunne et al. (2003).
Hester: The only H spectrum you showed had two components that did not join up into a velocity ellipse. How do you argue that this is a bubble rather than a couple of different evaporative outflows along the same line of sight?
Chu: The [N II]6583 echellograms I showed were not well displayed to show the faint emission. Most split line profiles have one component stronger than the other, indicating a “blister” structure. The velocity ellipses are closed. The evaporative outflows would start from the systemic velocity and extend to blue-shifted or red-shifted velocities continuously. This is not supported by the velocity ellipses we observe, as there are no stationary components at the systemic velocity in the velocity ellipses.
Maíz-Apellániz: One of the reasons why it is hard to see bubbles morphologically in a region like N11B is that most of the optical nebular photons originate on the H II region itself (at the interface with the molecular cloud). It will be difficult to distinguish dim bubbles against the bright background.
Chu: See answer in the text.