Testing Lorentz Invariance with GRB021206
Abstract
Since the discovery of the cosmological origin of GRBs there has been growing interest in using these transient events to probe the quantum gravity energy scale in the range 1016–1019 GeV, up to the Planck mass scale. This energy scale can manifest itself through a measurable modification in the electromagnetic radiation dispersion relation for high energy photons originating from cosmological distances. We have used data from the gamma-ray burst (GRB) of 2002 December 6 (GRB021206) to place an upper bound on the energy dispersion of the speed of light. The limit on the first-order quantum gravity effects derived from this single GRB indicate that the energy scale is in excess of 1.81017 GeV. We discuss a program to further constrain the energy scale by systematically studying such GRBs.
1 Introduction
The general quantum-gravity picture of the vacuum is one of a gravitational medium containing microscopic quantum fluctuations on size scales comparable to the Planck length, . A number of approaches to quantum gravity (noncommutative geometry, loop quantum gravity) have independently been demonstrated to modify the electromagnetic dispersion relation (Amelino-Camelia et al., 1998; Amelino-Camelia, 2003), suggesting that first- or second-order spontaneous violation of Lorentz invariance at high photon energies might be a general signature of quantum gravity phenomenology (Sarkar, 2002). The effects of this dispersion (reduced propagation speeds at high energies) are expected to be very small, unless the signals travel over very large distances, and the photon energies are very different from one another. The magnitude of this in vacuo dispersion is set by an assumed energy scale, EQG, which characterizes the size scale of quantum gravitational effects:
| (1) |
where , but is commonly assumed to be positive (Amelino-Camelia et al., 2002). EQG is generally assumed to be on the order of the Planck mass (E1019 GeV); however, theoretical work has suggested that this energy scale can be as low as 1016 GeV (Witten, 1996), or even as low as 103 GeV (Arkani-Hamed et al., 1999). (Note, however, that Lorentz invariance was preserved in both of these models.) With the discovery that GRBs are at cosmological distances (van Paradis et al., 1997), it was identified that GRBs could be sensitive to effective energy scales as high as the Planck mass (Amelino-Camelia et al., 1998). GRBs can combine high energy photons, millisecond time variability, and very large source distances, making it possible to search for time delays in GRB lightcurves as a function of energy.
The dispersion relation in Eqn. 1 leads to a first-order differential time delay for signals of energy traveling from a source at cosmological distance given by (Ellis et al., 2003a):
| (2) |
where is the photon arrival time,
| (3) |
and , , are the current best estimates of the cosmological parameters (Spergel et al., 2003). In some quantum gravity models, the first-order differential time delays vanish, and a second-order delay in EQG remains. In this case, we would find (Ellis et al., 2003a):
| (4) |
These time delays hold for any astrophysical source, not just GRBs, so several high energy sources exhibiting time variability have been used to set a lower limit on EQG for first-order corrections to the dispersion. Pulsed emission from the Crab Pulsar in the GeV photon range has been used to set a lower limit of EQG 1.81015 GeV (Kaaret, 1999). Initial analysis of GRB timing in the MeV photon range for bursts at known redshifts set a lower limit of 1015 GeV (Ellis et al., 2000), while a more detailed wavelet analysis extended this limit to 6.91015 GeV (Ellis et al., 2003a). TeV observations of flares in the active galactic nucleus Mkn 421 increased this limit to 61016 GeV (Biller et al., 1999). The current limit using this method is set at 8.31016 GeV by observations of GRB930131 (Schaefer, 1999) but the lack of a distance measurement makes this subject to considerable uncertainty. Other astrophysical methods have placed more stringent constraints on EQG assuming that the electron dispersion relation is modified as well. For example, observations of TeV -rays emitted by blazars place a limit on EQG 3.41018 GeV by constraining the decay of photons into electron-positron pairs (Stecker, 2003). Also, the discovery of polarized -ray emission (Coburn and Boggs, 2003) from the same GRB discussed in this paper led to limits of EQG 1033 GeV from birefringence constraints (Jacobson et al., 2003; Mitrofanov, 2003). However, it remains possible from the models that Lorentz invariance is conserved by electrons and not by photons (Ellis et al., 2003b), in which case the photon dispersion relation remains a key constraint on EQG.
Here we report on the limits set on EQG from GRB021206, an especially bright burst with a hard spectrum extending well into the MeV range. While the time profile for GRB021206 was quite complex below 2 MeV, at higher energies it exhibited a single, fast flare of photons extending to energies above 10 MeV with a duration of 15 ms. The broad spectral range measured and the relatively short duration of this flare allow us to constrain the lower limit on EQG which is slightly higher than the previous limit using this method (Schaefer, 1999), but consistent with it, considering the uncertainties in both cases. It is also comparable to the lower limit set by absorption methods (Stecker, 2003).
2 Observations
We used the Reuven Ramaty High Energy Solar Spectroscopic Imager (RHESSI) (Lin et al., 2002) to make these -ray observations of GRB021206. RHESSI has an array of nine large volume (300 cm3 each) coaxial germanium detectors with high spectral resolution, designed to study solar X-ray and -ray emission (3 keV – 17 MeV). RHESSI has high angular resolution (2) in the 1∘ field of view of its optics; however, the focal plane detectors are unshielded and open to the whole sky. Thus, while the chances are small that RHESSI will see a GRB in its imaging field of view, it measures them frequently in the focal plane detectors themselves, providing the energy and 1-s timing of each measured photon.
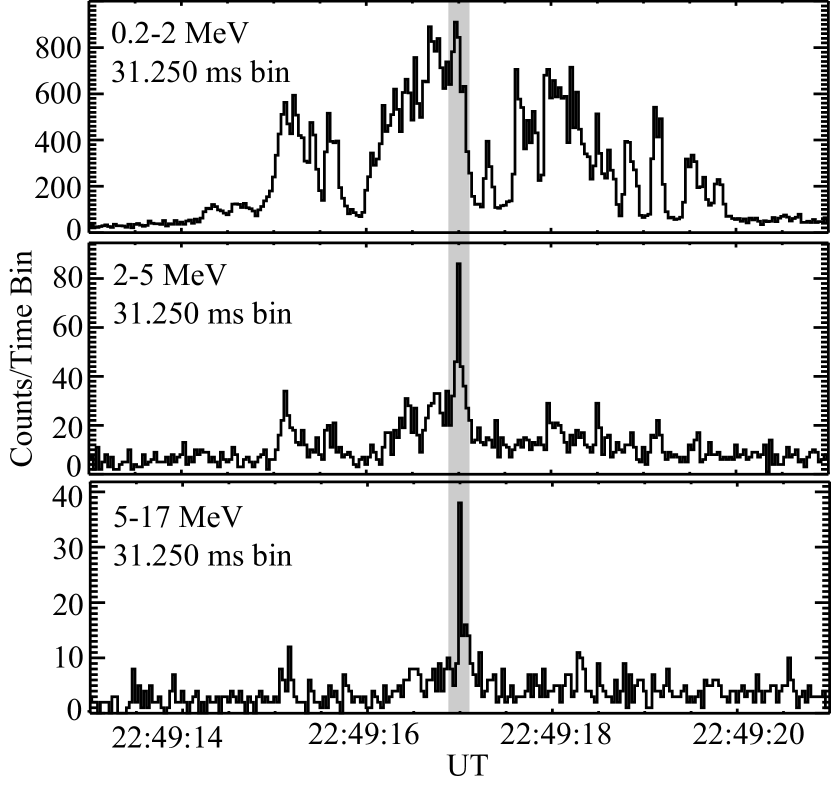
Prompt -ray emission from GRB021206 was detected with RHESSI on 2002 December 6.951 UT (Fig. 1). This GRB was also observed (Hurley et al., 2002a) with the Interplanetary Network (IPN). Refined measurements by the Ulysses and RHESSI spacecraft indicate that it had a 25-100 keV fluence of 4.810-4 erg cm-2, making this an extremely bright GRB. The IPN localized (Hurley et al., 2002b, 2003) GRB021206 to a 8.6 square arcminute error ellipse located 18∘ from the Sun. This solar proximity precluded optical afterglow observations at the time of the GRB; however, a candidate radio source was located using the VLA (Frail et al., 2003). Follow up optical observations have yet to measure the redshift of the GRB host galaxy, which is quite faint. However, we can estimate the redshift (the “pseudo-redshift”) from the GRB spectral and temporal properties alone (Atteia, 1999). We estimate the spectral parameters of the Band model (Band et al., 1993) to be , , and and the burst duration to be 20 s. This gives . We caution the reader that the redshift uncertainty with this novel method could be as high as a factor of 2, which would produce a comparable factor of 2 shift in our first-order lower limit on EQG, and a factor of shift on our second order limit.
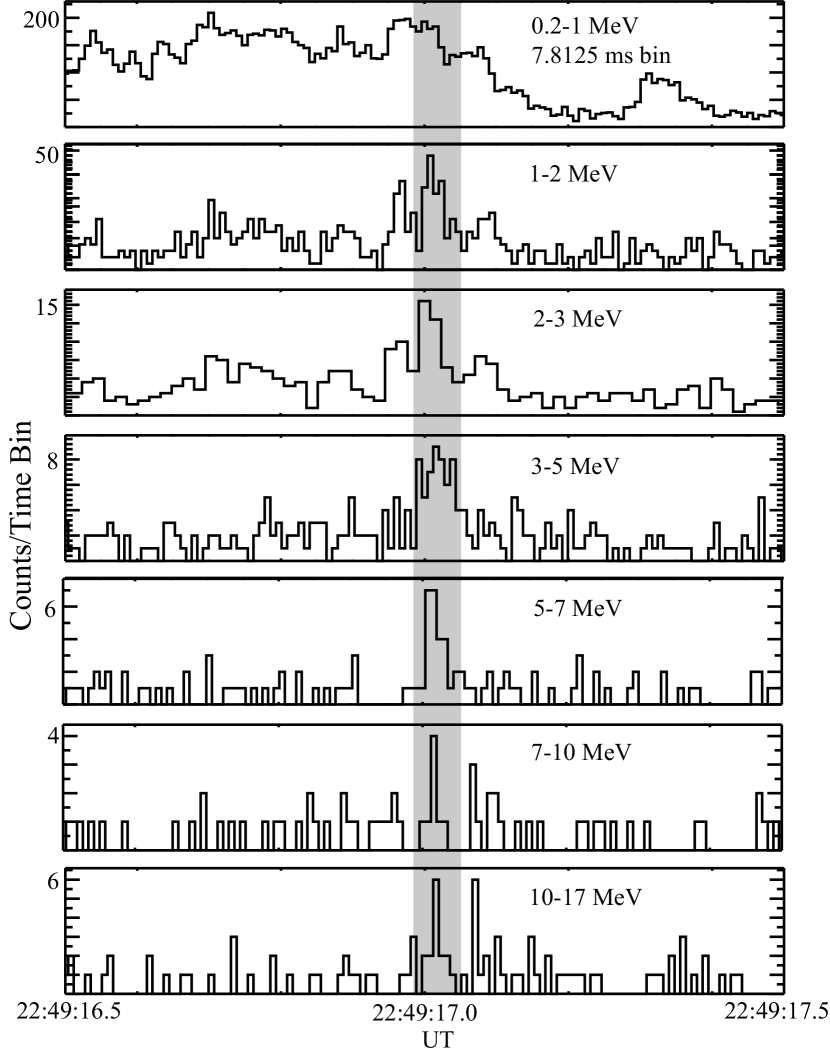
Fig. 1 shows the GRB lightcurve divided into 3 energy bins from 0.2–17 MeV. The fast flare seen so clearly in the lightcurves above 3 MeV begins to mix with lower-energy flares below 3 MeV. The 1–2 MeV range is the lowest energy band where this flare is resolved, though at these energies it is surrounded by a number of neighboring peaks. We cannot rule out unresolved flares 2 MeV contributing to this peak. Below 1 MeV, this feature is completely lost in the noise of the other low energy flares comprising the complicated lightcurve. Therefore, we focus this analysis on the 1–17 MeV energy range. In Fig. 2 we present the lightcurve divided into finer energy bands, and with finer temporal resolution. Note that while the number of flare counts in the 7-10 MeV and 10-17 MeV bands is significantly smaller than at lower energies, the combined significance of the 7-17 MeV flare is large, with a chance of 2.610-5 of being a random Poisson fluctuation in the background rate. (i.e. We would expect to randomly see this many peak counts in a single 7.8125 ms time bin about once every 8.7 hours of RHESSI background data.)
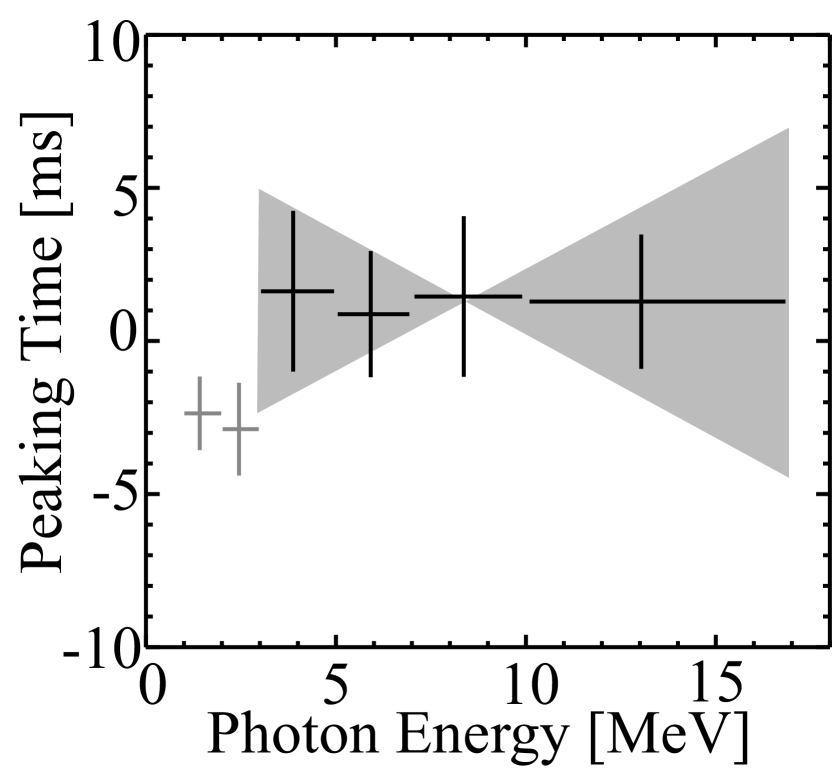
For each of the energy bands shown in Fig. 2, we analyzed the peaks with two separate methods to determine the peaking time of the flare in each band. The first method was to bin the event data into the histogrammed light curves shown in Fig. 2, and then fit the flare to a gaussian profile in order to characterize the peaking time and the uncertainty. For this analysis we chose 7.8125-ms wide bins, which are narrow enough to resolve the flare in the 7–10 and 10–17 MeV energy ranges. The second method we used to determine the peak times was to use the event data directly, and to determine the average (peak) time and standard deviation for all events in a 50 ms time window centered on the short flare. The results of this analysis were relatively insensitive to variations in the window size and center as long as the flare dominates the total counts in the window. These two methods placed comparable limits on the dispersion, and in Fig. 3 we show the results from averaging the results of these two separate analysis techniques.
From the peaking times plotted in Fig. 3, we can see that the measured slope would be strongly affected by the 1–2 MeV and 2–3 MeV data points, and we can not preclude the possibility that an additional unresolved flare at energies 3 MeV is biasing these two points to earlier peaking times. Therefore, we performed a fit of the dispersion for just the data 3 MeV. For the 3–17 MeV band, the time drift of the peak is measured to be ms, yielding:
| (5) |
This fit is consistent with a 95% confidence upper limit on the dispersion of
| (6) |
If we include the 1–3 MeV data in this fit, the upper limit remains comparable at .
Given our upper limit on the time dispersion in Eqn. 6 and the estimated source redshift, we can calculate the limit on EQG for first-order dispersion effects from Eqn. 2. This yields a lower limit of EQG 1.81017 GeV. For second-order dispersion effects from Eqn. 4, we can set a lower limit of EQG 5.5107 GeV. It has been widely speculated that GRBs are detectable to redshifts of 10 and beyond (Lamb & Reichart, 2000). If the same dispersion were measured for a burst at redshift 10, the lower limit would be 33 times higher, or 61018 Gev, which is only slightly smaller than EP.
3 Discussion
Many GRB energy spectra display hard-to-soft evolution (Preece et al., 1998). However, this refers to a global trend across the entire GRB time history and across the 25–1000 keV spectrum. In contrast, our results use the behavior of millisecond peaks at energies 1000 keV. In another study (Norris et al., 2000) the lag as a function of energy was examined for individual pulses in GRBs. A spectral lag was found, characterized by pulses peaking at high energy before they peaked at low energy. However, the pulses in question had durations of seconds, the low and high energies were 10’s of keV and 100’s of keV, and the resulting lags had magnitudes of up to several hundred milliseconds. This same study also confirmed an earlier result (Fenimore et al., 1995), namely that pulse widths are narrower at higher energies. Here, too, however, the pulse durations are seconds. We also note that this earlier study, which extended only up to 1000 keV, made no mention of spectral lag (Fenimore et al., 1995). The pulses that we are concerned with here are orders of magnitude shorter, and orders of magnitude higher in energy. The fact that pulses tend to be narrower with increasing energy is an advantage, since our estimate of is not based on rise times or fall times, but rather on the times of the peaks, which are better defined for narrower pulses. To our knowledge, no studies have focussed on such high-energy, short-duration pulses.
A reliable measurement of EQG will require a systematic study of the dispersion as a function of source redshift in order to separate out any residual GRB source geometry or emission mechanism effects that can bias the results. The ideal instrument to study EQG using GRBs would have coverage to high energies (10 MeV), and fine time resolution (0.1 ms). RHESSI, designed to study solar flares in the 3 keV – 17 MeV range with 1 s photon timing, provides a unique, all-sky GRB monitor for these studies. RHESSI nicely complements the HETE-2 and upcoming Swift missions (Ricker et al., 2001; Gehrels, 2000), which are able to localize GRBs for follow-up redshift determinations, but do not have the spectral range for these studies. RHESSI will also provide a low-energy compliment to the upcoming GLAST mission, which will also be sensitive for constraining EQG (Norris et al., 1999). We have established a program to study the high energy timing of the hundreds of bursts seen in the RHESSI detectors, with a goal of further constraining EQG. The best GRBs for this will have the high energy emission as seen in GRB021206 and, ideally, even faster flare peaks.
References
- Amelino-Camelia et al. (1998) Amelino-Camelia, G. et al., 1998, Nature, 393, 319
- Amelino-Camelia et al. (2002) Amelino-Camelia, G. et al., 2002, qc-qg/0212002
- Amelino-Camelia (2003) Amelino-Camelia, G., 2003, Int. J. Mod. Phys. D, 12, 1633
- Arkani-Hamed et al. (1999) Arkani-Hamed, N., Dimopoulos, S., & Dvali, G. 1999, Phys. Rev. D, 59, 086004
- Atteia (1999) Atteia, J.-L., 1999, A&A 407, L1
- Band et al. (1993) Band, D. et al. 1993, ApJ 413, 281
- Biller et al. (1999) Biller, S. D. et al., 1999, Phys. Rev. Lett., 83, 2108
- Coburn and Boggs (2003) Coburn, W., & Boggs, S. E., 2003, Nature, 423, 415
- Ellis et al. (2000) Ellis, J. et al., 2000, ApJ, 535, 139
- Ellis et al. (2003a) Ellis, J. et al., 2003a, A&A, 402, 409
- Ellis et al. (2003b) Ellis, J. et al., 2003b, astro-ph/0309144
- Fenimore et al. (1995) Fenimore, E., in’t Zand, J., Norris, J., Bonnell, J., and Nemiroff, R., 1995, ApJ 448, L101
- Frail et al. (2003) Frail, D. et al., 2003, GCN Circ., 2280
- Gehrels (2000) Gehrels, N. A., 2000, SPIE, 4140, 42
- Hurley et al. (2002a) Hurley, K. et al., 2002a, GCN Circ., 1727
- Hurley et al. (2002b) Hurley, K. et al., 2002b, GCN Circ., 1728
- Hurley et al. (2003) Hurley, K. et al., 2003, GCN Circ., 2281
- Jacobson et al. (2003) Jacobson, T. et al., 2003, astro-ph/0309681
- Kaaret (1999) Kaaret, P., 1999, A&A, 345, L32
- Lamb & Reichart (2000) Lamb, D., and Reichart, D., 2000, ApJ 536, 1
- Lin et al. (2002) Lin, R. P. et al., 2002, Sol. Phys., 210, 33
- Mitrofanov (2003) Mitrofanov, I. G., 2003, Nature, 426, 139
- Norris et al. (1999) Norris, J. P. et al., 1999, astro-ph/9912136
- Norris et al. (2000) Norris, J., Marani, G., and Bonnell, J. 2000, ApJ 534, 248
- Preece et al. (1998) Preece, R., et al. 1998, ApJ 496, 849
- Ricker et al. (2001) Ricker, G. R. et al., 2001, Gamma-Ray Burst and Afterglow Astronomy 2001, AIP Conf. Proc., 662, 3
- Sarkar (2002) Sarkar, S., 2002, Mod. Phys. Lett. A, 17, 1025
- Schaefer (1999) Schaefer, B. E. et al., 1999, Phys. Rev. Lett., 82, 4964
- Spergel et al. (2003) Spergel, D. N. et al., 2003, ApJS, 148, 175
- Stecker (2003) Stecker, F. W., 2003, Astropart. Phys., 20, 85
- van Paradis et al. (1997) van Paradis, J. et al., 1997, Nature, 386, 686
- Witten (1996) Witten, E., 1996, Nucl. Phys. B, 471, 135